SlideShare ist ein Scribd-Unternehmen logo
1 von 20
Downloaden Sie, um offline zu lesen
Post Medieval land use and vegetation change in
   upland Ribblesdale, Yorkshire Dales, UK.
             Helen Shaw and Ian Whyte
           Lancaster Environment Centre
               Lancaster University
Research Rationale
                      “Over the past 50 years, humans have
                      changed ecosystems more rapidly and
                      extensively than in any comparable period
                      of time in human history” (MEA, 2005).
                      Very little if any land in Europe is natural.
                      “Traditional agricultural knowledge
                      commonly promotes sustainable
                      production systems” (MEA 2005 Mountain
                      Systems p683)
                      CBD use traditional knowledge where
                      “relevant for the conservation and
                      sustainable use of biological diversity”
MEA 2005: http://www.millenniumassessment.org/en/Condition.aspx
Article 8(j): Traditional Knowledge, Innovations and Practices
http://www.cbd.int/traditional/
Two major caveats
      Generalised view at global scale.
      (Need to scale down to the local or
      regional environment to understand
      relevance)
      Ecology and traditional management
      are both driven by processes with
      adaptation strategies as change
      occurs. (We need to understand
      impacts and dynamics at a local scale).
      … and a question!
      How much do we really know about the
      impact of traditional management on
      biodiversity – is it sustainable?
Research
  Use palaeoecology and landscape history to
  determine vegetation change and likely
  drivers of that change
   Examining post-medieval landscape
  change in upland England
   Aims driven by
     lack of long-term data in ecology for
     conservation management
     lack of data on impacts of traditional
     management
     need to understand ecological
     dynamics
Palaeoecology/Palynology method


                         Pollen residue


             Send to
 Peat Core


             lab for
             14C

             dating


                       Data output and interpretation
Source area, pollen-vegetation and depth- time relationships
                Local                  Regional      Local
    TIME


Quantity of a
pollen type as a
percentage of
total pollen
counted


                Peat/Sediment Core

           Small hollows provide proxies for local vegetation
Jacobson & Bradshaw 1981. Quat. Res., 16, 80-96.
Several local scale sites can illustrate variance in landscape
                  through space and time.
English uplands: Cultural landscapes
   What is traditional management?
Is traditional management relevant to
       sustaining biodiversity?
Case study area: Ribblesdale
100 km British National Grid Squares

                                             Ribblesdale Area Map


                                       Ribblehead catchment area between the
                                       mountains of Ingleborough (724m) and
                                       Pen y Ghent (694m)

                                       Ingleborough National Nature Reserve
Wife Park
core
Pollen-vegetation relationship
                                                                      Grasses (P= 0.001)                                                                                                                                          Sedges (P=0.001)
                                                                                                                                                                                       50.0
                     100.0


                                                                                                                                                                                       45.0
                       90.0


                       80.0                                                                                                                                                            40.0


                       70.0                                                                                                                                                            35.0
Grass pollen % NAP


                                                                                                                                                                  Sedge % pollen nap
                       60.0                                                                                                                                                            30.0


                       50.0                                                                                                                                                            25.0


                       40.0                                                                                                                                                            20.0


                       30.0                                                                                                                                                            15.0


                       20.0                                                                                                                                                            10.0


                       10.0                                                                                                                                                             5.0


                              0.0                                                                                                                                                       0.0
                                         0.0          10.0   20.0   30.0     40.0   50.0          60.0   70.0    80.0    90.0   100.0                                                         0.0           10.0           20.0            30.0          40.0          50.0          60.0


                                                                                                                                                                                                                             Sedges vegetation % cover
                                                                       Grass % vegetation cover


                                                                      Herbs (P=0.015)                                                                                                               Heaths (P=0.2(ns) P=0.001 (2 outliers removed))

                                         45.0                                                                                                                             50.0


                                                                                                                                                                          45.0
                                         40.0

                                                                                                                                                                          40.0
                                         35.0


                                                                                                                                          Heaths percentage NAP
                                                                                                                                                                          35.0
                     Herb pollen % nap


                                         30.0

                                                                                                                                                                          30.0
                                         25.0
                                                                                                                                                                          25.0

                                         20.0
                                                                                                                                                                          20.0

                                         15.0
                                                                                                                                                                          15.0

                                         10.0
                                                                                                                                                                          10.0


                                          5.0                                                                                                                                    5.0


                                          0.0                                                                                                                                    0.0
                                                0.0          10.0          20.0            30.0           40.0          50.0            60.0                                             0.0              5.0       10.0            15.0          20.0          25.0          30.0      35.0

                                                                           Herb vegetation % cover                                                                                                                 Heaths % vegetation cover to 50m
Wife Park Age-depth Model
                      14C                        dates at 20cm and 40cm and SCP curve rise in 1950’s peak c. 1979
                                                                  Wife Park age-depth model
                                                                                                                              depth (cm)
                      0                                           5                     10   15                                                              20                               25                                                                           30                                                         35              40   45
               2000                                                                                                                                                                                                Atmospheric data from Reimer et al (2004);OxCal v3.10 Bronk Ramsey (2005); cub r:5 sd:12 prob usp[chron]


                                                                                                                                                                                                   600BP                                                          SUERC-27859 : 230±30BP
                                                      Wife Park SCP curve                                                                                                                                                                                                                                                 68.2% probability


                                                                                                                                 Radiocarbon determination
                                                                                                                                                                                                                                                                                                                           1640AD (35.8%) 1670AD
                                                                                                                                                                                                   400BP                                                                                                                   1780AD (26.0%) 1800AD
                                                                                                                                                                                                                                                                                                                           1940AD ( 6.4%) 1960AD
                                                SCPs (as a percentage of pollen)
                                                                                                                                                                                                                                                                                                                          95.4% probability
               1900                     0
                                            0     5    10   15   20    25   30     35
                                                                                                                                                                                                   200BP                                                                                                                   1630AD (44.7%) 1690AD
                                                                                                                                                                                                                                                                                                                           1730AD (39.5%) 1810AD
                                                                                                                                                                                                                                                                                                                           1930AD (11.3%) 1960AD

                                        5
                                                                                                                                                                                                        0BP


                                                                                                                                                                                                 -200BP
                                       10

               1800
                          Depth (cm)


                                       15


                                       20                                                                                                                                                                                         1400CalAD                                   1600CalAD                                   1800CalAD       2000CalAD
                                                                                                                                                                                                                                                                                      Calibrated date
               1700
Years cal.AD


                                       25


                                       30


               1600                    35


               1500                                                                                                                                                       Atmospheric data from Reimer et al (2004);OxCal v3.10 Bronk Ramsey (2005); cub r:5 sd:12 prob usp[chron]


                                                                                                                                                                  900BP                                                  SUERC-27860 : 700±30BP
                                                                                                                                                                                                                                                                                   68.2% probability
                                                                                                  Radiocarbon determination


                                                                                                                                                                  800BP                                                                                                             1270AD (61.7%) 1300AD
                                                                                                                                                                                                                                                                                    1370AD ( 6.5%) 1380AD
                                                                                                                                                                  700BP                                                                                                            95.4% probability
               1400                                                                                                                                               600BP
                                                                                                                                                                                                                                                                                    1260AD (76.3%) 1310AD
                                                                                                                                                                                                                                                                                    1350AD (19.1%) 1390AD


                                                                                                                                                                  500BP

                                                                                                                                                                  400BP

               1300

                                                                                                                                                                                         1100CalAD 1200CalAD 1300CalAD 1400CalAD 1500CalAD
               1200                                                                                                                                                                                                                          Calibrated date
Wife Park summary pollen data
                                                                                                                                                          Percentage of total land pollen
                                                                                                                                           0    10   20      30    40    50    60    70     80   90   100
                           1408 1451 1495 1538 1582 1625 1669 1712 1756 1799 1830 1883 1937 1961 1977 1982 1988 1995 2001 2007


                                                                                                                                    0-1

                                                                                                                                    2-3

                                                                                                                                    4-5

                                                                                                                                    6-7                                                                     Coniferous
Depth (cm)/Time years AD


                                                                                                                                    8-9                                                                     trees
                                                                                                                                 10-10.5                                                                    Broadleaved
                                                                                                                                 12-12.5
                                                                                                                                                                                                            trees
                                                                                                                                                                                                            Shrubs
                                                                                                                                 14-14.5

                                                                                                                                 16-16.5
                                                                                                                                                                                                            Heaths
                                                                                                                                 18-18.5

                                                                                                                                 20-20.5                                                                    Herbs
                                                                                                                                 22-22.5

                                                                                                                                 24-24.5                                                                    Wild grasses
                                                                                                                                 26-26.5

                                                                                                                                 28-28.5
                                                                                                                                                                                                            Grass pollen
                                                                                                                                                                                                            annulus >8μm
                                                                                                                                 30-30.5
                                                                                                                                                                                                            Sedges
                                                                                                                                 32-32.5

                                                                                                                                 34-34.5

                                                                                                                                 36-36.5

                                                                                                                                 38-38.5
Wife Park summary pollen data (nap)
                                                                                                                                                     Percentage of total non arboreal pollen
                                                                                                                                           0   10   20   30   40    50   60    70   80    90   100
                           1408 1451 1495 1538 1582 1625 1669 1712 1756 1799 1830 1883 1937 1961 1977 1982 1988 1995 2001 2007


                                                                                                                                    0-1

                                                                                                                                    2-3

                                                                                                                                    4-5

                                                                                                                                    6-7
Depth (cm)/Time years AD


                                                                                                                                                                                                     Heaths
                                                                                                                                    8-9

                                                                                                                                 10-10.5

                                                                                                                                 12-12.5
                                                                                                                                                                                                     Herbs
                                                                                                                                 14-14.5

                                                                                                                                 16-16.5

                                                                                                                                 18-18.5
                                                                                                                                                                                                     Wild grasses
                                                                                                                                 20-20.5

                                                                                                                                 22-22.5

                                                                                                                                 24-24.5                                                             Grass pollen
                                                                                                                                 26-26.5                                                             annulus >8μm
                                                                                                                                 28-28.5

                                                                                                                                 30-30.5                                                             Sedges
                                                                                                                                 32-32.5

                                                                                                                                 34-34.5

                                                                                                                                 36-36.5

                                                                                                                                 38-38.5
Wife Park possible management impacts in pollen data
                             Percentage of total land
                                     pollen


                                                                                    Fluctuations in and loss of
                                                            CAP                     sedge abundance –
Depth (cm)/Time years AD


                                                                                    influence of drainage?


                                                        Decline in timber trees reported in Manor of
                                                        Newby records from end of 17th Century after a
                                                        period of poor commons management

                                                        Enclosure began (stinted pastures) - sheep and
                                                        cattle


                                                        End of Monastic period (sheep ranching and stud farms)
Conclusions 1
    No period of stasis in management
    Large shifts in biodiversity/structural
    diversity occurred prior to 50 years ago.
    Shrub land and woodland was part of the
    pre-enclosed landscape and was part of
    the traditional resource now lost –
    adaptation.
    Wetlands or wet grasslands have been lost
    since 1900s. Amelioration of prior drainage
    schemes may need to be implemented on
    the slopes as well as the mountain tops.
    We should not assume that traditional is
    sustainable – just adaptable – to limits!
Conclusions 2
    Need to improve understanding of the
    variation of traditional management
    through time and the consequent impacts
    on ecosystems.
    Traditional managers can have valuable
    knowledge – but it can be time limited!
       For example – most of the farmers in
       the uplands of the UK today have had
       training in the agricultural colleges of
       the 1960’s and 1970’s when land
       improvement and drainage schemes
       were the norm.
h.e.shaw@lancaster.ac.uk
                     i.whyte@lancaster.ac.uk
 Acknowledgements: Research funded by the Leverhulme Trust
  Conference attendance supported by UKRC
           Travel Bursary scheme
Thanks to farmers, land owners, Natural England, Yorkshire Dales
National Park Authority and Yorkshire Dales Wildlife Trust for land
                             access.
            POLLANDCAL and LANDCLIM networks

Weitere ähnliche Inhalte

Ähnlich wie Post Medieval land use and vegetation change in upland Ribblesdale, Yorkshire Dales, UK [Helen Shaw]

2012 dk patronage slides
2012 dk patronage slides2012 dk patronage slides
2012 dk patronage slides
Michelle Gjerde
 
CR2 Apresentação - 3Q11
CR2   Apresentação - 3Q11CR2   Apresentação - 3Q11
CR2 Apresentação - 3Q11
CR2
 
TV Monthly Report Feb 2011 (Pakistan)
TV Monthly Report Feb 2011 (Pakistan)TV Monthly Report Feb 2011 (Pakistan)
TV Monthly Report Feb 2011 (Pakistan)
Ejaz Asi
 
TV Monthly Report Mar 2011 (Pakistan)
TV Monthly Report Mar 2011 (Pakistan)TV Monthly Report Mar 2011 (Pakistan)
TV Monthly Report Mar 2011 (Pakistan)
Ejaz Asi
 
3 q11 presentation
3 q11 presentation3 q11 presentation
3 q11 presentation
SiteriCR2
 
Jozef Pecho: POT and block-maxima analysis of precipitation extremes at selec...
Jozef Pecho: POT and block-maxima analysis of precipitation extremes at selec...Jozef Pecho: POT and block-maxima analysis of precipitation extremes at selec...
Jozef Pecho: POT and block-maxima analysis of precipitation extremes at selec...
Jiří Šmída
 
Laura Erika MEZA "Research in agriculture and climate change: a bibliometric...
 Laura Erika MEZA "Research in agriculture and climate change: a bibliometric... Laura Erika MEZA "Research in agriculture and climate change: a bibliometric...
Laura Erika MEZA "Research in agriculture and climate change: a bibliometric...
Global Risk Forum GRFDavos
 
Hn & Hcm Market Presentation Q4 2009 Final En
Hn & Hcm  Market Presentation Q4 2009 Final   EnHn & Hcm  Market Presentation Q4 2009 Final   En
Hn & Hcm Market Presentation Q4 2009 Final En
savillsvietnam
 
09 07 14 Web 2.0 Weekly
09 07 14 Web 2.0 Weekly09 07 14 Web 2.0 Weekly
09 07 14 Web 2.0 Weekly
David Shore
 

Ähnlich wie Post Medieval land use and vegetation change in upland Ribblesdale, Yorkshire Dales, UK [Helen Shaw] (20)

Energy-efficient extensions in passive optical networks
Energy-efficient extensions in passive optical networksEnergy-efficient extensions in passive optical networks
Energy-efficient extensions in passive optical networks
 
2012 dk patronage slides
2012 dk patronage slides2012 dk patronage slides
2012 dk patronage slides
 
CR2 Apresentação - 3Q11
CR2   Apresentação - 3Q11CR2   Apresentação - 3Q11
CR2 Apresentação - 3Q11
 
K. Markandeya
K. MarkandeyaK. Markandeya
K. Markandeya
 
MRV – SISA
MRV – SISAMRV – SISA
MRV – SISA
 
TV Monthly Report Feb 2011 (Pakistan)
TV Monthly Report Feb 2011 (Pakistan)TV Monthly Report Feb 2011 (Pakistan)
TV Monthly Report Feb 2011 (Pakistan)
 
TV Monthly Report Mar 2011 (Pakistan)
TV Monthly Report Mar 2011 (Pakistan)TV Monthly Report Mar 2011 (Pakistan)
TV Monthly Report Mar 2011 (Pakistan)
 
3 q11 presentation
3 q11 presentation3 q11 presentation
3 q11 presentation
 
Jozef Pecho: POT and block-maxima analysis of precipitation extremes at selec...
Jozef Pecho: POT and block-maxima analysis of precipitation extremes at selec...Jozef Pecho: POT and block-maxima analysis of precipitation extremes at selec...
Jozef Pecho: POT and block-maxima analysis of precipitation extremes at selec...
 
Martin Barden – The audience centre stage | congres podiumkunsten 2012
Martin Barden – The audience centre stage | congres podiumkunsten 2012Martin Barden – The audience centre stage | congres podiumkunsten 2012
Martin Barden – The audience centre stage | congres podiumkunsten 2012
 
Wait, It's Actually SOCIAL Media?
Wait, It's Actually SOCIAL Media?Wait, It's Actually SOCIAL Media?
Wait, It's Actually SOCIAL Media?
 
Three Charts
Three ChartsThree Charts
Three Charts
 
Laura Erika MEZA "Research in agriculture and climate change: a bibliometric...
 Laura Erika MEZA "Research in agriculture and climate change: a bibliometric... Laura Erika MEZA "Research in agriculture and climate change: a bibliometric...
Laura Erika MEZA "Research in agriculture and climate change: a bibliometric...
 
Anita Charlesworth: The financial outlook for the NHS
Anita Charlesworth: The financial outlook for the NHSAnita Charlesworth: The financial outlook for the NHS
Anita Charlesworth: The financial outlook for the NHS
 
QMC-based Shape Fingerprints
QMC-based Shape FingerprintsQMC-based Shape Fingerprints
QMC-based Shape Fingerprints
 
Conservation biology of freshwater and marine ecosystems
Conservation biology of freshwater and marine ecosystemsConservation biology of freshwater and marine ecosystems
Conservation biology of freshwater and marine ecosystems
 
Hn & Hcm Market Presentation Q4 2009 Final En
Hn & Hcm  Market Presentation Q4 2009 Final   EnHn & Hcm  Market Presentation Q4 2009 Final   En
Hn & Hcm Market Presentation Q4 2009 Final En
 
09 07 14 Web 2.0 Weekly
09 07 14 Web 2.0 Weekly09 07 14 Web 2.0 Weekly
09 07 14 Web 2.0 Weekly
 
Salt power
Salt powerSalt power
Salt power
 
Impact Of Foreclosures On Home Prices
Impact Of Foreclosures On Home PricesImpact Of Foreclosures On Home Prices
Impact Of Foreclosures On Home Prices
 

Mehr von University of the Highlands and Islands

The ‘State of the Art’ of Global Change Research in Mountains - An analysis o...
The ‘State of the Art’ of Global Change Research in Mountains - An analysis o...The ‘State of the Art’ of Global Change Research in Mountains - An analysis o...
The ‘State of the Art’ of Global Change Research in Mountains - An analysis o...
University of the Highlands and Islands
 

Mehr von University of the Highlands and Islands (20)

110614 tim warren presentation
110614   tim warren presentation110614   tim warren presentation
110614 tim warren presentation
 
110614 tim warren handout - choy resource sheet
110614   tim warren handout - choy resource sheet110614   tim warren handout - choy resource sheet
110614 tim warren handout - choy resource sheet
 
110614 tim warren handout - care measure
110614   tim warren handout - care measure110614   tim warren handout - care measure
110614 tim warren handout - care measure
 
110614 speaker profiles
110614   speaker profiles110614   speaker profiles
110614 speaker profiles
 
110614 self management conf programme
110614   self management conf programme110614   self management conf programme
110614 self management conf programme
 
110614 project summary
110614   project summary110614   project summary
110614 project summary
 
110614 maggie clark presentation
110614   maggie clark presentation110614   maggie clark presentation
110614 maggie clark presentation
 
110614 glenn hinds presentation
110614   glenn hinds presentation110614   glenn hinds presentation
110614 glenn hinds presentation
 
110614 garry coutts presentation
110614   garry coutts presentation110614   garry coutts presentation
110614 garry coutts presentation
 
110614 delegate list
110614   delegate list110614   delegate list
110614 delegate list
 
110614 uhi self management modules peg 2011-2012
110614   uhi self management modules peg 2011-2012110614   uhi self management modules peg 2011-2012
110614 uhi self management modules peg 2011-2012
 
110614 chair profile
110614   chair profile110614   chair profile
110614 chair profile
 
110614 abstract booklet
110614   abstract booklet110614   abstract booklet
110614 abstract booklet
 
UHI postgraduate prospectus 11-12
UHI postgraduate prospectus 11-12UHI postgraduate prospectus 11-12
UHI postgraduate prospectus 11-12
 
A Career in Teaching - Isobel Kerr [Scottish Teacher Recruitment Team]
A Career in Teaching - Isobel Kerr [Scottish Teacher Recruitment Team]A Career in Teaching - Isobel Kerr [Scottish Teacher Recruitment Team]
A Career in Teaching - Isobel Kerr [Scottish Teacher Recruitment Team]
 
The ‘State of the Art’ of Global Change Research in Mountains - An analysis o...
The ‘State of the Art’ of Global Change Research in Mountains - An analysis o...The ‘State of the Art’ of Global Change Research in Mountains - An analysis o...
The ‘State of the Art’ of Global Change Research in Mountains - An analysis o...
 
Welcome to Perth [Martin Price]
Welcome to Perth [Martin Price]Welcome to Perth [Martin Price]
Welcome to Perth [Martin Price]
 
Conducting Climate Change Risk and Vulnerability Assessments in Rural Mountai...
Conducting Climate Change Risk and Vulnerability Assessments in Rural Mountai...Conducting Climate Change Risk and Vulnerability Assessments in Rural Mountai...
Conducting Climate Change Risk and Vulnerability Assessments in Rural Mountai...
 
Global Change in Katunskiy Biosphere Reserve: Vulnerability of ecosystems and...
Global Change in Katunskiy Biosphere Reserve: Vulnerability of ecosystems and...Global Change in Katunskiy Biosphere Reserve: Vulnerability of ecosystems and...
Global Change in Katunskiy Biosphere Reserve: Vulnerability of ecosystems and...
 
Remote sensing and isotopic analysis to determine the contribution of snow- a...
Remote sensing and isotopic analysis to determine the contribution of snow- a...Remote sensing and isotopic analysis to determine the contribution of snow- a...
Remote sensing and isotopic analysis to determine the contribution of snow- a...
 

Kürzlich hochgeladen

Kürzlich hochgeladen (20)

How to Create and Manage Wizard in Odoo 17
How to Create and Manage Wizard in Odoo 17How to Create and Manage Wizard in Odoo 17
How to Create and Manage Wizard in Odoo 17
 
How to Give a Domain for a Field in Odoo 17
How to Give a Domain for a Field in Odoo 17How to Give a Domain for a Field in Odoo 17
How to Give a Domain for a Field in Odoo 17
 
How to setup Pycharm environment for Odoo 17.pptx
How to setup Pycharm environment for Odoo 17.pptxHow to setup Pycharm environment for Odoo 17.pptx
How to setup Pycharm environment for Odoo 17.pptx
 
2024-NATIONAL-LEARNING-CAMP-AND-OTHER.pptx
2024-NATIONAL-LEARNING-CAMP-AND-OTHER.pptx2024-NATIONAL-LEARNING-CAMP-AND-OTHER.pptx
2024-NATIONAL-LEARNING-CAMP-AND-OTHER.pptx
 
TỔNG ÔN TẬP THI VÀO LỚP 10 MÔN TIẾNG ANH NĂM HỌC 2023 - 2024 CÓ ĐÁP ÁN (NGỮ Â...
TỔNG ÔN TẬP THI VÀO LỚP 10 MÔN TIẾNG ANH NĂM HỌC 2023 - 2024 CÓ ĐÁP ÁN (NGỮ Â...TỔNG ÔN TẬP THI VÀO LỚP 10 MÔN TIẾNG ANH NĂM HỌC 2023 - 2024 CÓ ĐÁP ÁN (NGỮ Â...
TỔNG ÔN TẬP THI VÀO LỚP 10 MÔN TIẾNG ANH NĂM HỌC 2023 - 2024 CÓ ĐÁP ÁN (NGỮ Â...
 
Accessible Digital Futures project (20/03/2024)
Accessible Digital Futures project (20/03/2024)Accessible Digital Futures project (20/03/2024)
Accessible Digital Futures project (20/03/2024)
 
Introduction to Nonprofit Accounting: The Basics
Introduction to Nonprofit Accounting: The BasicsIntroduction to Nonprofit Accounting: The Basics
Introduction to Nonprofit Accounting: The Basics
 
Application orientated numerical on hev.ppt
Application orientated numerical on hev.pptApplication orientated numerical on hev.ppt
Application orientated numerical on hev.ppt
 
Basic Civil Engineering first year Notes- Chapter 4 Building.pptx
Basic Civil Engineering first year Notes- Chapter 4 Building.pptxBasic Civil Engineering first year Notes- Chapter 4 Building.pptx
Basic Civil Engineering first year Notes- Chapter 4 Building.pptx
 
Jamworks pilot and AI at Jisc (20/03/2024)
Jamworks pilot and AI at Jisc (20/03/2024)Jamworks pilot and AI at Jisc (20/03/2024)
Jamworks pilot and AI at Jisc (20/03/2024)
 
Spatium Project Simulation student brief
Spatium Project Simulation student briefSpatium Project Simulation student brief
Spatium Project Simulation student brief
 
Food safety_Challenges food safety laboratories_.pdf
Food safety_Challenges food safety laboratories_.pdfFood safety_Challenges food safety laboratories_.pdf
Food safety_Challenges food safety laboratories_.pdf
 
Interdisciplinary_Insights_Data_Collection_Methods.pptx
Interdisciplinary_Insights_Data_Collection_Methods.pptxInterdisciplinary_Insights_Data_Collection_Methods.pptx
Interdisciplinary_Insights_Data_Collection_Methods.pptx
 
UGC NET Paper 1 Mathematical Reasoning & Aptitude.pdf
UGC NET Paper 1 Mathematical Reasoning & Aptitude.pdfUGC NET Paper 1 Mathematical Reasoning & Aptitude.pdf
UGC NET Paper 1 Mathematical Reasoning & Aptitude.pdf
 
Sociology 101 Demonstration of Learning Exhibit
Sociology 101 Demonstration of Learning ExhibitSociology 101 Demonstration of Learning Exhibit
Sociology 101 Demonstration of Learning Exhibit
 
Understanding Accommodations and Modifications
Understanding  Accommodations and ModificationsUnderstanding  Accommodations and Modifications
Understanding Accommodations and Modifications
 
ICT Role in 21st Century Education & its Challenges.pptx
ICT Role in 21st Century Education & its Challenges.pptxICT Role in 21st Century Education & its Challenges.pptx
ICT Role in 21st Century Education & its Challenges.pptx
 
Fostering Friendships - Enhancing Social Bonds in the Classroom
Fostering Friendships - Enhancing Social Bonds  in the ClassroomFostering Friendships - Enhancing Social Bonds  in the Classroom
Fostering Friendships - Enhancing Social Bonds in the Classroom
 
SOC 101 Demonstration of Learning Presentation
SOC 101 Demonstration of Learning PresentationSOC 101 Demonstration of Learning Presentation
SOC 101 Demonstration of Learning Presentation
 
Holdier Curriculum Vitae (April 2024).pdf
Holdier Curriculum Vitae (April 2024).pdfHoldier Curriculum Vitae (April 2024).pdf
Holdier Curriculum Vitae (April 2024).pdf
 

Post Medieval land use and vegetation change in upland Ribblesdale, Yorkshire Dales, UK [Helen Shaw]

  • 1. Post Medieval land use and vegetation change in upland Ribblesdale, Yorkshire Dales, UK. Helen Shaw and Ian Whyte Lancaster Environment Centre Lancaster University
  • 2. Research Rationale “Over the past 50 years, humans have changed ecosystems more rapidly and extensively than in any comparable period of time in human history” (MEA, 2005). Very little if any land in Europe is natural. “Traditional agricultural knowledge commonly promotes sustainable production systems” (MEA 2005 Mountain Systems p683) CBD use traditional knowledge where “relevant for the conservation and sustainable use of biological diversity” MEA 2005: http://www.millenniumassessment.org/en/Condition.aspx Article 8(j): Traditional Knowledge, Innovations and Practices http://www.cbd.int/traditional/
  • 3. Two major caveats Generalised view at global scale. (Need to scale down to the local or regional environment to understand relevance) Ecology and traditional management are both driven by processes with adaptation strategies as change occurs. (We need to understand impacts and dynamics at a local scale). … and a question! How much do we really know about the impact of traditional management on biodiversity – is it sustainable?
  • 4. Research Use palaeoecology and landscape history to determine vegetation change and likely drivers of that change  Examining post-medieval landscape change in upland England  Aims driven by  lack of long-term data in ecology for conservation management  lack of data on impacts of traditional management  need to understand ecological dynamics
  • 5. Palaeoecology/Palynology method Pollen residue Send to Peat Core lab for 14C dating Data output and interpretation
  • 6. Source area, pollen-vegetation and depth- time relationships Local Regional Local TIME Quantity of a pollen type as a percentage of total pollen counted Peat/Sediment Core Small hollows provide proxies for local vegetation Jacobson & Bradshaw 1981. Quat. Res., 16, 80-96.
  • 7. Several local scale sites can illustrate variance in landscape through space and time.
  • 8. English uplands: Cultural landscapes What is traditional management? Is traditional management relevant to sustaining biodiversity?
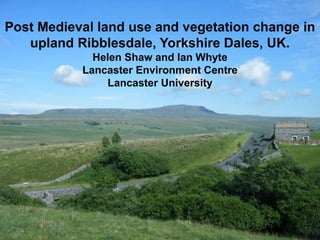
  • 9. Case study area: Ribblesdale 100 km British National Grid Squares Ribblesdale Area Map Ribblehead catchment area between the mountains of Ingleborough (724m) and Pen y Ghent (694m) Ingleborough National Nature Reserve
  • 10.
  • 11.
  • 13. Pollen-vegetation relationship Grasses (P= 0.001) Sedges (P=0.001) 50.0 100.0 45.0 90.0 80.0 40.0 70.0 35.0 Grass pollen % NAP Sedge % pollen nap 60.0 30.0 50.0 25.0 40.0 20.0 30.0 15.0 20.0 10.0 10.0 5.0 0.0 0.0 0.0 10.0 20.0 30.0 40.0 50.0 60.0 70.0 80.0 90.0 100.0 0.0 10.0 20.0 30.0 40.0 50.0 60.0 Sedges vegetation % cover Grass % vegetation cover Herbs (P=0.015) Heaths (P=0.2(ns) P=0.001 (2 outliers removed)) 45.0 50.0 45.0 40.0 40.0 35.0 Heaths percentage NAP 35.0 Herb pollen % nap 30.0 30.0 25.0 25.0 20.0 20.0 15.0 15.0 10.0 10.0 5.0 5.0 0.0 0.0 0.0 10.0 20.0 30.0 40.0 50.0 60.0 0.0 5.0 10.0 15.0 20.0 25.0 30.0 35.0 Herb vegetation % cover Heaths % vegetation cover to 50m
  • 14. Wife Park Age-depth Model 14C dates at 20cm and 40cm and SCP curve rise in 1950’s peak c. 1979 Wife Park age-depth model depth (cm) 0 5 10 15 20 25 30 35 40 45 2000 Atmospheric data from Reimer et al (2004);OxCal v3.10 Bronk Ramsey (2005); cub r:5 sd:12 prob usp[chron] 600BP SUERC-27859 : 230±30BP Wife Park SCP curve 68.2% probability Radiocarbon determination 1640AD (35.8%) 1670AD 400BP 1780AD (26.0%) 1800AD 1940AD ( 6.4%) 1960AD SCPs (as a percentage of pollen) 95.4% probability 1900 0 0 5 10 15 20 25 30 35 200BP 1630AD (44.7%) 1690AD 1730AD (39.5%) 1810AD 1930AD (11.3%) 1960AD 5 0BP -200BP 10 1800 Depth (cm) 15 20 1400CalAD 1600CalAD 1800CalAD 2000CalAD Calibrated date 1700 Years cal.AD 25 30 1600 35 1500 Atmospheric data from Reimer et al (2004);OxCal v3.10 Bronk Ramsey (2005); cub r:5 sd:12 prob usp[chron] 900BP SUERC-27860 : 700±30BP 68.2% probability Radiocarbon determination 800BP 1270AD (61.7%) 1300AD 1370AD ( 6.5%) 1380AD 700BP 95.4% probability 1400 600BP 1260AD (76.3%) 1310AD 1350AD (19.1%) 1390AD 500BP 400BP 1300 1100CalAD 1200CalAD 1300CalAD 1400CalAD 1500CalAD 1200 Calibrated date
  • 15. Wife Park summary pollen data Percentage of total land pollen 0 10 20 30 40 50 60 70 80 90 100 1408 1451 1495 1538 1582 1625 1669 1712 1756 1799 1830 1883 1937 1961 1977 1982 1988 1995 2001 2007 0-1 2-3 4-5 6-7 Coniferous Depth (cm)/Time years AD 8-9 trees 10-10.5 Broadleaved 12-12.5 trees Shrubs 14-14.5 16-16.5 Heaths 18-18.5 20-20.5 Herbs 22-22.5 24-24.5 Wild grasses 26-26.5 28-28.5 Grass pollen annulus >8μm 30-30.5 Sedges 32-32.5 34-34.5 36-36.5 38-38.5
  • 16. Wife Park summary pollen data (nap) Percentage of total non arboreal pollen 0 10 20 30 40 50 60 70 80 90 100 1408 1451 1495 1538 1582 1625 1669 1712 1756 1799 1830 1883 1937 1961 1977 1982 1988 1995 2001 2007 0-1 2-3 4-5 6-7 Depth (cm)/Time years AD Heaths 8-9 10-10.5 12-12.5 Herbs 14-14.5 16-16.5 18-18.5 Wild grasses 20-20.5 22-22.5 24-24.5 Grass pollen 26-26.5 annulus >8μm 28-28.5 30-30.5 Sedges 32-32.5 34-34.5 36-36.5 38-38.5
  • 17. Wife Park possible management impacts in pollen data Percentage of total land pollen Fluctuations in and loss of CAP sedge abundance – Depth (cm)/Time years AD influence of drainage? Decline in timber trees reported in Manor of Newby records from end of 17th Century after a period of poor commons management Enclosure began (stinted pastures) - sheep and cattle End of Monastic period (sheep ranching and stud farms)
  • 18. Conclusions 1 No period of stasis in management Large shifts in biodiversity/structural diversity occurred prior to 50 years ago. Shrub land and woodland was part of the pre-enclosed landscape and was part of the traditional resource now lost – adaptation. Wetlands or wet grasslands have been lost since 1900s. Amelioration of prior drainage schemes may need to be implemented on the slopes as well as the mountain tops. We should not assume that traditional is sustainable – just adaptable – to limits!
  • 19. Conclusions 2 Need to improve understanding of the variation of traditional management through time and the consequent impacts on ecosystems. Traditional managers can have valuable knowledge – but it can be time limited! For example – most of the farmers in the uplands of the UK today have had training in the agricultural colleges of the 1960’s and 1970’s when land improvement and drainage schemes were the norm.
  • 20. h.e.shaw@lancaster.ac.uk i.whyte@lancaster.ac.uk Acknowledgements: Research funded by the Leverhulme Trust Conference attendance supported by UKRC Travel Bursary scheme Thanks to farmers, land owners, Natural England, Yorkshire Dales National Park Authority and Yorkshire Dales Wildlife Trust for land access. POLLANDCAL and LANDCLIM networks