SlideShare ist ein Scribd-Unternehmen logo
1 von 44
Downloaden Sie, um offline zu lesen
thinkMoney/24 
• random musings for traders at TD Ameritrade 
Summer 2014 
18/VOLATILITY’S 
LITTLE SECRET 
24/HOW TO 
NEUTER YOUR 
TRADE 
CHARTING FOCUS 
32/CHARTS THAT 
RULE THE 
WORLD 
10/TIPS 
FOR 
TRADING 
WITH 
YOUR 
GUT 
Ameritrade 
again. 
it overall 
did We stars Barron's. 
TD 4.5 gets from (See page 9 for details)
WHERE DIVERSIFICATION 
LEAPS ACROSS BORDERS 
Welcome to FX Options From NASDAQ OMX 
Now individual investors can diversify their portfolios with FX Options from 
NASDAQ OMX. Trade on global economic and political events via spot FX 
Options in your existing options account and receive U.S. dollar settlement. 
© 2014, NASDAQ OMX GROUP, INC. ALL RIGHTS RESERVED. 
LEARN MORE AT NASDAQTRADER.COM/FXOPTIONS OR CALL +1 215 496 5550
thinkMoney/24 
•04 • 
Contents 
• 
Photograph by 
Fredrik Brodén 
• 
tdameritrade.com
p. 10 
Trading With A Sour Stomach 
In bull markets, sometimes logic 
goes out the window. So the next 
time your gut is telling you to get 
into a trade despite your rules, 
pick a strategy that tempers your 
enthusiasm.
iShares Silver 
Trust ETF. 
For traders 
with mettle. 
For many traders, liquidity is an important part of an overall 
investment strategy. iShares Silver Trust ETF was created with 
that in mind. Unlike physical silver, it’s easier to buy and sell — 
making it an option for investors who seek to maximize returns 
over the short term. Plus, it’s low-cost, so like other iShares ETFs, 
it can help you keep more of what you earn. 
For details, visit iShares.com/silver 
ADVERTISEMENT 
SLV iShares Silver Trust 
Investing involves risk, including possible loss of principal. The iShares Silver Trust (SLV or the “Trust”) is not an investment company registered 
under the Investment Company Act of 1940 or a commodity pool for purposes of the Commodity Exchange Act. Shares of SLV are not subject to the 
same regulatory requirements as mutual funds. Because shares of SLV are intended to reflect the price of the silver held by the Trust, the market 
price of the shares is subject to fluctuations similar to those affecting silver prices. SLV has filed a registration statement (including a prospectus) 
with the SEC for the offering to which this communication relates. Before you invest, you should read the prospectus and other documents the 
Trust has filed with the SEC for more complete information about the issuer and this offering. You may get these documents for free by visiting 
www.iShares.com or EDGAR on the SEC website at www.sec.gov. Alternatively, the Trust will arrange to send you the prospectus if you request 
it by calling toll-free 1-800-474-2737. There can be no assurance that an active trading market for shares of SLV will develop or be maintained. Buying and selling 
shares of ETFs will result in brokerage commissions. BlackRock Asset Management International Inc. (“BAMII”) is the sponsor of the Silver Trust. BlackRock Investments, LLC 
(“BRIL”), assists in the promotion of the Silver Trust. BAMII and BRIL are affiliates of BlackRock, Inc. (together with its affiliates, “BlackRock”). ©2014 BlackRock. 
All rights reserved. iSHARES and BLACKROCK are registered trademarks of BlackRock. All other marks are the property of their respective owners. iS-11612-0214
thinkMoney/24 
•07 • 
Contents 
• 
Cover photograph by 
Fredrik Brodén 
• 
tdameritrade.com 
Miscellaneous 
Features 
10/ Trading With A Sour Stomach 
No matter how many rules you strictly follow, 
there’s going to come a time when you just have 
to trust your gut on a bullish trade. But depend-ing 
on how confident you are, you can tweak the 
downside risk to help you sleep better. 
18/ News For Show, 
Vol For Dough 
Headlines may come and go. But the volatility 
resulting from headlines is what can matter 
most to traders. And before you write off 
higher-volatility markets, here’s a little secret 
you ought to know. 
24/How To Neuter Your Trade 
At some point you may have heard an option 
trader boast about being a “delta neutral” or 
“market-neutral” trader. But what do these 
terms mean and are they really useful? Let’s put 
the debate to rest. 
08/A Quick Howdy 
15/Love Notes 
Columns 
16/News + Views 
Retail options trading 
is caught in the 
crossfire of Congress-man 
Camp’s tax pro-posal. 
Should you be 
worried? 
+Ask the Suit 
28/Gear Head 
Today’s cool tool 
two-fer: A Dow-to-gold 
script from 
TD Ameritrade’s 
“Mr. Script” and how 
to share a chart with 
your loved ones. 
42/The Token 
Glossary 
32/ Special Focus: Charting for 
Everyone 
CHARTS THAT RULE THE WORLD 
No doubt you can find lots of charting programs 
out there. But seriously, why look further? Other 
than a back massage, thinkorswim® Charts can 
give you almost anything you need—even if 
you’re not a chart reader. 
PLUS: 
THINKORSWIM CHARTS Q+A 
38/Capiche? 
If you’re buying ETFs 
that track futures like 
oil and volatility, 
beware of the “rolling 
penalty” that could be 
stealing your profits. 
TD Ameritrade Contact Info You Could Use 
Client Services Representative: 800-669-3900 
New Accounts: 800-454-9272 
• 
thinkorswim Support: 
800-672-2098 
thinkorswim@tdameritrade.com 
Platform Feedback: 
thinkorswimfeedback@tdameritrade.com 
Tech Support: 
thinkorswimtechsupport@tdameritrade.com 
paperMoney Support: 
thinkorswimpapermoney@tdameritrade.com 
For all other inquiries: 
tdameritrade.com/contact-us 
• 
General Mailing Address 
200 S. 108th Ave 
Omaha, NE 68154 
• 
Follow TD Ameritrade 
31 /The Spotlight 
Fun guy Mike 
Barwacz is making 
sure your Trading 
Desk confidant at 
TD Ameritrade has 
what it takes to 
answer your tough 
questions. And he 
can show you a good 
time doing it. 
And follow thinkorswim on Twitter, too: 
@thinkorswim 
BACK ISSUES OF THINKMONEY! 
To view past issues of thinkMoney, hop on over to 
tdameritrade.com/thinkmoney. You'll be glad you did. 
22/Evolution of 
the Trader 
If you thought trading 
started under a but-tonwood 
tree, you’d 
be wrong. Think mon-keys, 
Darwin, and 
opposable thumbs. 
40/Ask the Trader Guy 
Our resident guru 
responds to why all 
options aren’t created 
equal, how to size up 
your vertical spread, and 
false promises from a 
dumb clairvoyant. 
cont.
make a huge difference in your 
probability of success, depending 
on how confident you are. And 
this is where gut meets science. 
In this month’s cover feature, 
“Trading on a Sour Stomach” 
(page 10), we’ll show you 
whether the difference between 
feeling a “sure thing” or just 
“meh” could dictate which strat-egy 
you may want to consider for 
a given trade. 
But suppose you don’t 
already have a system, and 
you’re just discovering the 
thinkorswim® trading platform 
for the first time. Continuing our 
Special Focus on the finer tools of 
the platform, we’ll dive into 
thinkorswim Charts (starting on 
page 32). Serving up nothing less 
than the kitchen sink, the Charts 
page has tools from which even 
the “I don’t use charts” trader 
could benefit. 
And of course, after you’ve 
pulled the trigger and entered a 
trade, at some point, you’ll find 
yourself in one of two situa-tions— 
facing a loss or staring at 
a profit—and not sure what to do 
next. “How to Neuter Your 
Trade” on page 24 is a must-read 
for you nail-biters that could pro-vide 
some relief. 
It’s been said that trading can 
be traced back to our simian 
ancestors. As Trader Erectus 
once wrote on his cave wall 
while contemplating his next 
Paleo snack, “mmfph”—which 
was later translated to “Buy spar-ingly 
and sell often.” We agree. 
Happy trading! 
Kevin Lund, 
Editor-in-Chief, thinkMoney 
thinkMoney/24 
•08 • 
A Quick Howdy 
• 
tdameritrade.com 
thinkMoney® 
EDITOR-IN-CHIEF 
Kevin Lund 
EDITOR 
Thomas Preston 
ASSISTANT EDITOR 
Eileen Sutton 
ART DIRECTOR 
Tom Brown 
DESIGNER 
Jennifer Roberts 
• 
CONTRIBUTING WRITERS 
Nicole Sherrod 
John Brodemus 
Chesley Spencer 
Kira Brecht 
Greg Loehr 
David Kier 
CHIEF PHOTOGRAPHER 
Fredrik Brodén 
CONTRIBUTING ILLUSTRATOR 
Joe Morse 
• 
PUBLISHER 
T3 Custom 
Email: info@t3publishing.com 
www.t3publishing.com 
PHOTOGRAPH: FREDRIK BRODÉN 
Me Go Trade 
Let’s face it. No matter how 
impressively automated your 
trading system is—custom scans, 
charts, half-eaten Twinkies—at 
the end of the day, it’s really an 
educated guess where the stock 
you’re coveting is going next. 
Though your indicators all point 
to up or down, you don’t really 
know for sure—which means 
your level of confidence in the 
trade sits on a spectrum. Of sorts. 
In other words, it’s more of a 
data-driven gut feeling that ulti-mately 
drives your decisions. 
You may know which stock 
you want to trade. But choosing 
the right option strategy could 
edit 
GOT FEEDBACK? 
Talk to us about 
thinkMoney! Take our 
survey and you’ll qualify 
for infinite brownie 
points. 
tdameritrade.com/ 
tmsurveyor write to us 
atthinkmoney@ 
tdameritrade.com
important 
info 
• The information presented in this publication does 
not consider your personal investment objectives or 
financial situation; therefore, this publication does not 
make personalized recommendations. This information 
should not be construed as an offer to sell or a solicita-tion 
to buy any security. The investment strategies or 
the securities may not be suitable for you. Any and all 
opinions expressed in this publication are subject to 
change without notice. 
• Options transactions involve complex tax considera-tions 
that should be carefully reviewed prior to entering 
into any transaction. 
• The risk of loss in trading securities, options, futures 
and forex can be substantial. Clients must consider all 
relevant risk factors, including their own personal finan-cial 
situations, before trading. Options involve risk and 
are not suitable for all investors. See the Options Disclo-sure 
Document: Characteristics and Risks of Standard-ized 
Options. A copy accompanies this magazine if you 
have not previously received one. Additional copies can 
be obtained at tdameritrade.com or by contacting us. 
• Trading foreign exchange on margin carries a high level 
of risk, as well as its own unique risk factors. Before con-sidering 
trading this product, please read the Forex Risk 
Disclosure, available at http://www.nfa.futures.org 
/NFA-investor-information/publication-library/forex.pdf. 
• A forex dealer can be compensated via commission 
and/or spread on forex trades. TD Ameritrade is subse-quently 
compensated by the forex dealer. 
• Futures and forex accounts are not protected by the 
Securities Investor Protection Corporation (SIPC). 
TD Ameritrade, Inc. Member SIPC FINRA NFA 
TD Ameritrade is a trademark jointly owned by 
TD Ameritrade IP Company, Inc. and The 
Toronto-Dominion Bank. ©2014 TD Ameritrade IP 
Company, Inc. All rights reserved. Used with permis-sion. 
Product and company names mentioned herein 
may be trademarks and/or registered trademarks of 
their respective companies. 
thinkMoney/24 
•09 • 
Disclaimers 
• 
tdameritrade.com 
• Neither Investools® nor 
its educational sub-sidiaries 
nor any of their 
respective officers, per-sonnel, 
representatives, 
agents or independent 
contractors are, in such 
capacities, licensed 
financial advisors, regis-tered 
investment advisors 
or registered broker/deal-ers. 
Neither Investools 
nor such educational 
subsidiaries provide 
investment or financial 
advice or make invest-ment 
recommendations, 
nor are they in the busi-ness 
of transacting 
trades, nor do they direct 
client futures accounts 
nor give futures trading 
advice tailored to any 
particula r client’s situa-tion. 
Nothing contained 
in this communication 
constitutes a solicitation, 
recommendation, 
promotion, endorsement 
or offer by Investools or 
others described herein, 
of any particular security, 
transaction, or invest-ment. 
Investools Inc. 
and TD Ameritrade, Inc. 
are separate but affili-ated 
companies that 
are not responsible for 
each other’s services or 
policies. 
3 
Transaction costs (com-missions 
and other fees) 
are important factors and 
should be considered 
when evaluating any 
options trade. For simplic-ity, 
the examples in these 
articles do not include 
transaction costs. At TD 
Ameritrade, the standard 
commission for online 
equity orders is $9.99, 
online option orders are 
$9.99 + $0.75 per con-tract. 
Orders placed by 
other means will have 
higher transaction costs. 
Options exercises and 
assignments will incur a 
$19.99 commission. 
TD Ameritrade was evaluated against 19 
others in the 2014 Barron's Online Broker 
Review, March 15, 2014, and was 
awarded 4.5 stars overall (along with 3 
others). The firm was ranked 1st in the 
categories “Best for Long-Term Investing” 
and “Best for Novices.” TD Ameritrade was also among 
those listed in the categories Best for Frequent Traders 
(ranked 4th), Best for Options Traders (ranked 2nd) and 
Best for In-Person Service (ranked 5th). Star ratings are 
out of a possible 5. Barron’s is a trademark of Dow Jones. 
L.P. All rights reserved.
thinkMoney/24 
• 10 • 
Gut-Trading 
Strategies 
• 
tdameritrade.com 
I N T H E W O R L D 
of numbers and analy-sis, 
a gut feeling can seem 
squishy and out of place. But 
with trading and investing, there’s no 
denying that our gut instinct can often help. It 
can make us confident or wary, no matter the analy-sis 
we used to determine a bullish or bearish direc-tional 
bias. And for the record, it’s not that our 
analysis is wrong. It’s just that our gut remembers past 
winners and losers and a different part of the brain 
engages. It’s right brain vs. left brain. In a word, our gut 
can provide a reality check. • Now, some traders 
might use their gut as a “go, no-go” indicator. The “go” 
is all in with long stock, for example. The “no-go” is 
sit on your hands and do nothing. But there’s a 
smarter approach that may help fine-tune your trad-ing 
instincts. Figure out whether your gut is mak-ing 
you slightly confident, semi-confident, or 
very confident in your bias. Let’s look at 
a few bullish strategies that may 
match what your gut might 
NO MATTER HOW MANY 
TRADING SYSTEMS YOU TRY, 
THERE’S GOING TO COME A TIME 
WHEN YOU JUST HAVE TO 
TRUST YOUR GUT ON A BULLISH 
TRADE. BUT DEPENDING ON 
HOW CONFIDENT YOU ARE, YOU 
CAN TWEAK THE DOWNSIDE RISK 
TO HELP YOU SLEEP A LITTLE 
BETTER AT NIGHT. 
suggest. 
TRADING 
WITH A 
SOUR 
STOMACH 
WORDS BY 
THOMAS 
PRESTON
thinkMoney/24 
• 12 • 
Gut-Trading 
Strategies 
• 
Photograph by 
Fredrik Brodén 
• 
tdameritrade.com 
THE SORT-OF-CONFIDENT 
BULLISH TRADE 
SHORT, OUT-OF-THE-MONEY PUT VERTICAL 
When looking at a stock, you might believe it 
will go up—at least that’s what your analysis 
is telling you. But your gut isn’t quite as psy-ched 
about it. It’s telling you that the stock might not go 
up, and might drop. Since the out-of-the-money (OTM) 
put vertical has a defined max loss and defined max 
profit, it might be an appropriate strategy when you’re 
sort of confident in the direction you think the underly-ing 
will go. 
A bullish short OTM put vertical is made up of a 
short OTM put, and a long OTM put that’s further 
OTM than the short put. This trade is designed to pro-duce 
a credit, which is the max profit the trade can 
make(less transaction costs). The max loss is the dif-ference 
Short Put Vertical 
STOCK PRICE 
Short 
Strike 
Profit 
Loss 
Long 
Strike 
between the strikes minus that credit (plus 
+ 
BREAKEVEN 
_ 
transaction costs). 
What the short OTM put vertical does is potentially 
profit not only if the stock rallies, but also if it sits at its 
current price, or even drops a bit. More than a bit 
would mean the stock drops below the short strike 
plus the credit received, in order to incur a loss. As 
long as the price of the stock is higher than the strike 
price of the short put at the expiration of the options, 
this position can be profitable. A long stock position, 
for example, can’t do that. If the price of the stock 
doesn’t go up, or drops, the long stock position isn’t 
profitable (not counting possible dividends). The 
short put vertical can also have a lower margin 
requirement than long stock. That means you don’t 
need to tie up a lot of your trading capital in a sort-of-confident 
trade. 
THE SEMI-CONFIDENT 
BULLISH TRADE 
NAKED, SHORT OUT-OF-THE-MONEY PUT 
Huh? a naked short option if you’re only 
semi-confident? That may sound risky, but 
hey, at thinkMoney, we don’t flinch. A short OTM put 
takes in a credit (the premium received for selling the 
put), which is its max potential profit (less transaction 
costs). The max potential loss is the strike price of the 
+ 
BREAKEVEN 
_ 
Short Put 
put minus the credit you realize for selling it. That’s 
the loss that would occur if the price of the stock goes 
to zero. And it’s that large potential loss that might be 
raising eyebrows for the semi-confident trader. The 
strategy also includes a high risk of purchasing the 
underlying stock at the strike price when the market 
price of the stock will likely be lower. 
But think about it. The short put has no more risk 
than long stock. The losses for both are large if the price 
of the stock drops sharply, let alone goes to zero. But 
here’s an advantage for the short OTM put—the price of 
the stock can sit where it is, or even drop a bit by expira-tion, 
and the short OTM put can still be profitable. Long 
stock can’t do that (save, for possible dividends). A 
short OTM put also has no greater margin requirement 
than long stock. In a margin account, the margin on a 
short put can be lower than on long stock, and in an 
IRA, the margin on a cash-secured short-put position 
and a long stock position can be roughly the same. 
The short OTM put and the short OTM put vertical 
share some characteristics. So, what makes the short 
OTM put the choice for the semi-confident trade? The 
short OTM put can have a higher credit than a short-put 
vertical, and thus larger potential profit. If the 
short put of the short-put vertical and the short put are 
at the same OTM strike price and same expiration, the 
credit for the short OTM put vertical will be lower than 
the credit for the short-put. The difference is the cost 
of the long-put component of the short-put vertical. 
The short put gives you potentially more profit than a 
short-put vertical in exchange for a higher margin 
requirement and higher potential risk. That’s why it 
may be a choice if you’re a bit more confident in your 
bullish bias. 
FIGURE 1: Short OTM put vertical. A smaller potential reward with 
higher probability of success than long verticals, when you’re feeling so-so 
about the direction of the underlying. For illustrative purposes only. 
FIGURE 2: Short OTM put. Wee bit bigger potential reward, 
lots more risk. Still a higher probability of success than a long vertical posi-tion, 
since you could potentially make money even if the stock stands still. 
For illustrative purposes only. 
STOCK PRICE 
Profit 
Loss 
Short 
Strike
THE CONFIDENT 
BULLISH TRADE 
LONG, AT-THE-MONEY CALL VERTICAL 
A long at-the-money (ATM) call vertical 
could be the choice as a “very confident” 
trade. A bullish long ATM call vertical is made up of a 
long slightly, in-the-money (ITM) call and a short OTM 
call in the same expiration. You pay a debit when you 
do this trade, and the debit of the long ATM vertical is 
its max possible loss. The max potential profit is the 
difference between the strike prices, minus the debit 
paid, including transaction costs, and occurs when the 
stock price is higher than the strike price of the short 
OTM call at expiration. That means the price of the 
stock has to go higher for the ATM vertical to profit. It 
can’t just stay at the same price or drop, like it can for 
the short OTM put, or short OTM put vertical. If the 
stock drops, the long ATM vertical will likely lose 
some money, and the max loss happens when the 
price of the stock drops below the strike price of the 
long call at expiration. 
The long ATM call vertical may be a confident 
choice because it can have a higher delta than an OTM 
short put vertical, or even a short put—meaning, it can 
be more responsive to a rise in the stock price. But if 
you’re so confident, why not just buy stock, or a long 
call for that matter? Neither caps your upside poten-tial, 
so why choose it? 
Compared to long stock, the long ATM call vertical 
can have less potential risk, for one. Nothing is guar-anteed 
to go higher. If the stock does drop sharply, the 
loss on the long stock can be 
much greater than on the long 
vertical. Also, the long ATM 
call vertical can have a lower 
margin requirement than long 
stock. That means that you tie 
up less of your trading capital 
with verticals. 
Compared to a long call, the 
long ATM vertical can be less 
sensitive to changes in volatil-ity 
(vega) and time (theta), 
because the vertical has both a 
long and short option in it. The 
negative vega in the short 
option offsets the positive vega 
in the long option, resulting in 
a net-lower vega than a single 
long option. Likewise, the neg-ative 
theta of the long option is 
offset by the positive theta of 
the short option, resulting in a 
net-lower time decay than a 
single long option. 
Important Information 
THE KEY IS UNDERSTANDING THAT YOUR GUT 
drives strategy, not trade size. The smart way to imple-ment 
confident analysis is with a strategy that not only 
reflects that confidence, but also can have lower risk, 
lower margin requirements, and opportunity to profit 
if you’re directional bias proves wrong. Remember, 
your gut gets you in the game. Your brain hopefully 
gets you paid. 
SEE 
GLOSSARY 
PAGE 42 
+ 
BREAKEVEN 
_ 
Long ATM Call Vertical 
STOCK PRICE 
Loss 
Long 
Strike 
Short 
Strike 
Profit 
FIGURE 3: Long ATM call vertical. The lowest probability of success 
among the three strategies discussed here, but the greatest possible 
reward when you’re feeling warm and fuzzy about the direction of the 
trend. For illustrative purposes only. 
Naked option strate-gies 
involve the high-est 
amount of risk 
and are only appro-priate 
for traders 
with the highest risk 
tolerance. Spreads 
and other multiple-leg 
option strategies 
can entail substan-tial 
transaction 
costs, including mul-tiple 
commissions, 
which may impact 
any potential return. 
Supporting docu-mentation 
for any 
claims, comparison, 
statistics, or other 
technical data will 
be supplied upon 
request. 
BEFORE YOU GUT 
Find trades your gut feels 
good about. Fire up 
thinkorswim's "MOST 
ACTIVES" lists to get 
some ideas. 
From the MarketWatch 
tab, go to the Quotes 
sub-tab. Click the little 
gear icon to the far right 
to see a menu of pre-defined 
lists, such as 
"Lovers and Losers" and 
"Top 10," featuring the 
day's hits and misses.
Kyle S. 
thinkorswim® user 
Nicole “The Suit” Sherrod 
@TDANSherrod 
Managing Director, Trading 
Access granted. 
Get an exclusive look into how “The Suit” uses thinkorswim. 
With the new sharing feature in thinkorswim, you’ll discover how our experts use the platform and 
which tools they rely on most. You can also generate new ideas and share your platform setup with 
friends, followers, and the myTrade® community. 
Explore thinkorswim sharing: 
tdameritrade.com/shareyourtos 
myTrade is a service of myTrade, Inc., a separate but af iated rm. TD Ameritrade is not responsible for the services of myTrade, or content shared through the service. 
TD Ameritrade, Inc., member FINRA/SIPC/NFA. TD Ameritrade is a trademark jointly owned by TD Ameritrade IP Company, Inc. and The Toronto-Dominion Bank. © 2014 TD Ameritrade IP Company, Inc. All rights reserved. 
Used with permission.
THE TWEETS 
• @TDANSherrod: Today I’m 
working on our 2015 Strategic 
Plan. And I’m putting the 
things that my Twitter follow-ers 
ask for FIRST. 
• @NewShoesHere: Does the 
Strategic Plan include how to 
play pocket Aces under the 
gun? ☺ 
• @TDANSherrod: No but it 
does include a new tab called 
“High Probability Racehorse Hand-icapping.” 
• @MichaelComeau: Please add Pac-Man 
to the thinkorswim platform. I will trade 
more, I swear. 
• @TDANSherrod: We already have Tetris. 
And Mine Sweeper. 
• @MichaelComeau: Yes—but Pac-Man is 
a must. Come on, I’m not asking for Ms. 
Pac-Man here. 
• @panthersfan1234: @JaviFusco Since 
you made it into a magazine, now you’re 
never gonna shut up. Thanks a lot, 
@TDANSherrod… :D 
DA QUIPS 
• On trading vanity 
It is quite possible that I just might be the 
best looking day-trader in all of Alabama, 
if not the world. 
Joe 
• On take-backs 
There are no Mulligans in trading. 
Pat 
• On disruptive technology 
I want a driverless car...so I can text while 
driving. 
Brendan 
• On domestic finances 
If your husband defaults on you, you 
can always execute a swap. 
Francine 
• On electric-car drawbacks 
Tesla. Where gas stations don’t 
know your name. 
Sam 
• On inter-market analysis 
I think Justin Bieber got arrested 
again. Not yet sure what impact it will 
have on crude. 
Jack 
• On pragmatism 
The Millionaire Next Door is not trading the 
VIX, but he is wearing four sets of clothing 
on the plane. 
Stacey 
• On predictive analysis 
Forecasting is the art of saying what will 
happen and then explaining why it didn't. 
Skip 
• One from a famous dude: 
If past history was all there was to 
the game, the richest people would be 
librarians. 
Warren Buffet 
thinkMoney/24 
•15 • 
Love Notes 
• 
Sweet tweets 
and quick quips 
from all of us 
• 
Photograph by 
Fredrik Brodén 
Follow the “experts” on 
Twitter for all things 
markets, trading, and 
thinkorswim: 
@TDANSherrod 
@TDAJJKinahan 
@thinkorswim 
Important Information 
These comments are excerpts from chat rooms, emails, and tweets submitted by 
TD Ameritrade clients, and their views may not reflect those of TD Ameritrade. 
Testimonials may not be representative of the experience of other clients and are no 
guarantee of future performance or success. 
lttrs.
thinkMoney/24 
•16 • 
News+Views 
• 
A hodgepodge of 
stuff we thought you 
should know. 
• 
Photograph by 
Fredrik Brodén 
• 
tdameritrade.com 
Q: What’s new in the world of 
education at TD Ameritrade? 
Any new events coming up? 
A: Yes! Here’s a short list of some 
of the latest and greatest: 
Market Drive events. My work 
BFF, JJ Kinahan, hooked us up 
with some amazing sponsor part-ners 
this year so we can bring our 
TD Ameritrade Market Drive 
events to even more cities and to 
larger venues. (Thanks CME, 
BlackRock, Barclay’s, and CBOE!*) 
If you’re not familiar with these 
events, in a word, get off your der-rière 
and go. “In a city near you” 
you’ll get a day of royal treatment 
learning all kinds of thinkorswim® 
tips, as well as mingle with other 
trading fanatics. And, of course, 
you’ll be inducted into our trading 
“inner circle.” Find out more 
here:www.tdameritrade.com/ 
registerformarketdrive. 
thinkorswim Chat Rooms. Don’t 
forget about the great education 
going on daily in thinkorswim Chat 
Rooms. If you’re looking for some-thing 
topical it’s there, it’s color-ful, 
it’s unedited. And our “on air” 
talent keeps stepping up their col-lective 
games to drive even more 
impact from these events. Just fire 
up thinkorswim, and select Sup-port/ 
Chat in the upper right of the 
screen. Then select the Chat 
Rooms tab. 
And for the Ladies. Finally, 
there’s one other thing that we’re 
working on. You might not know 
this, but the readership of this 
esteemed publication skews to the 
male side. Yup, it’s a fact that 
women are not as invested as men. 
But we’re going to change all 
that. That’s right—developed by 
ladies for ladies, we’re launching 
new educational content designed 
to empower women to focus on 
building even greater wealth and 
investing savvy investing in the 
markets (tdameritrade.com/up). 
Why say it here? Because I want 
you to share a link with the 
women you care about—your sis-ters, 
daughters, friends, mothers, 
and yes, even wives. 
nws. 
FOLLOW THE SUIT 
Read more of Nicole’s 
musings on her own 
blog at tickertape-monthly. 
com/blog. 
Follow Nicole on 
Twitter: 
@TDANSherrod 
Ask The 
Suit 
• 
A little Q&A with 
Nicole Sherrod, 
Managing Director, 
Trader Group 
at TD Ameritrade 
*CME, BlackRock, Barclays, CBOE, and TD Ameritrade are separate and unaffiliated companies and are not responsible for each other's services or policies.
toys 
Toys for 
Traders 
A few of our 
latest trading 
faves 
thinkorswim® 
TRADE FLASH 
This toy displays 
trade-related events 
as they happen— 
such as analyst 
up/downgrades, 
block trades, trade 
imbalances, events 
on the trading floor, 
and more. To trade 
on a “Flash,” just 
click on the symbol 
in the Trade Flash 
feed and you’ll be 
sent to the Trade tab. 
MY TOOLS 
Instead of scroung-ing 
around all the 
submenus for your 
favorite indicators or 
chart functions, this 
toy gives you easy 
access and one click 
for each of your 
faves. Apply it to one 
or all the charts, or 
just those detached. 
To turn on My Tools, 
bring up Chart Set-tings 
and look under 
the General tab, bot-tom 
right. 
ISE SPREAD BOOK 
This old tool has 
been turned back on 
to let you see all the 
working spread 
orders on the ISE 
that your peers are 
trading. Similar to 
the regular spread 
book, you can search 
for all types of 
spreads (verticals, 
butterflies, etc.) for 
any symbol traded 
there to analyze for 
your own purposes. 
Can I interest you in 
a little light reading? 
House Ways and 
Means Committee 
Chairman Dave 
Camp, a Michigan 
Republican, has 
issued a 979-page 
door stop called the 
“Tax Reform Act of 
2014.” In his 
defense, an overly 
complex U.S. tax 
code requires noth-ing 
short of a beefy 
rewrite. And there 
among the fine print 
is the proposal he 
first pushed in Janu-ary 
2012, a “mark-to- 
market” 
treatment of certain 
derivatives that will 
snag listed options 
that retail investors 
favor in the sweep-ing 
list of changes. 
Essentially, the pro-posal 
calls for mark-ing 
all derivatives to 
industry 
spotlight 
market in order to 
put a price on that 
investment, then 
tax it as income. 
This means 
investors would be 
required to pay 
taxes on gains, even 
if it’s an open posi-tion. 
The Act calls 
for treating the 
option, including 
buying a put, as if it 
were sold on the 
last business day of 
the year. Toss in 
straddles with a 
derivative, and non-derivative, 
offset-ting 
position — 
including stock that 
is not part of a qual-ified 
covered call — 
both sides would be 
marked to market. 
The aim is to 
clean up and clarify 
taxation and regula-tion 
of the increas-ingly 
complex suite 
of derivatives prod-ucts 
launched in the 
last decade. Guilty 
by association is the 
decades-old listed - 
options market. 
Options’ tax treat-ment 
has been 
“well-settled” for 30 
years, argues the 
Options Industry 
Council. Other 
potential problems, 
according to tax-law 
firm Chapman and 
Cutler: Valuation of 
lightly traded deriv-atives; 
attempting 
to price as individ-ual 
products 
embedded deriva-tives 
whose “value” 
may depend on 
what happens with 
the entire trade; and 
perhaps most 
importantly, expect-ing 
investors to 
pony up taxes on 
money they don’t 
actually have in 
hand. 
Stay tuned. 
Camp has some 
bipartisan support, 
but the proposal 
faces a long road, 
especially in a mid-term 
election year 
that may give Con-gress 
a facelift. Pick-ing 
on retail 
derivatives is just 
the tip of the iceberg 
for a proposal that 
takes on individual 
and corporate tax 
rates, and many 
more complexities. 
For now, a red pen 
awaits its call. 
If it Ain’t 
Broke, Don’t 
Tax It 
Will a tax proposal that picks on 
retail option traders survive? 
• 
Words by 
Rachel Koning Beals 
Illustration by 
Joe Morse 
AND THERE 
AMONG THE 
FINE PRINT OF 
THE "TAX 
REFORM ACT 
OF 2014," 
MARK-TO-MARKET 
TREATMENT 
WILL SNAG 
LISTED 
OPTIONS THAT 
RETAIL 
INVESTORS 
FAVOR IN THE 
SWEEPING 
LIST OF 
CHANGES.
thinkMoney/24 
•18 • 
Volatility Secrets 
• 
tdameritrade.com 
VOL 
FOR 
DOUGH 
HEADLINES MAY COME AND GO. BUT VOLATILITY 
IN REACTION TO THOSE HEADLINES IS WHAT CAN 
MATTER MOST TO TRADERS. AND BEFORE YOU 
WRITE OFF HIGHER-VOLATILITY MARKETS, HERE’S A 
LITTLE SECRET YOU OUGHT TO KNOW. 
WORDS BY THOMAS PRESTON 
NEWS 
FOR 
SHOW,
PHOTOGRAPHS BY FREDRIK BRODÉN
OUR 
TRADING 
DAYS 
good news, bad news, news you consider important, 
news you ignore. Of course, how you interpret news is 
up to you. But there’s no mistaking the one signal— 
implied volatility—that can tell us how the market 
itself feels about news. Simply put, implied vol meas-ures 
the magnitude of an index or stock’s potential 
price change. It goes up when the market is uncertain 
or fearful about what a headline might 
mean for future price changes, and 
down when news makes the market 
confident. 
Sometimes, though, market volatil-ity 
itself becomes news. And talking 
heads sound the alarm when the VIX— 
the Chicago Board Options Exchange 
(CBOE) volatility index—spikes higher. 
The VIX might not be reacting to news 
at all. But scary headlines about volatil-ity 
can make novice investors skittish 
and afraid to act. 
Sure, it’s a free country. And you can 
choose to trade or not, depending on 
your nervous system. But savvy traders 
understand that higher volatility may 
actually signal potential opportunities. 
In fact, veteran traders may use strate-gies 
that leverage the very thing that’s 
often scary to novices. How? Because 
they understand that when the VIX is 
higher, options premiums don’t just 
increase in lockstep. They do so expo-nentially. 
LEG BONE CONNECTED 
TO THE SHIN BONE 
Traders know the VIX is calculated 
using out-of-the-money (OTM) SPX 
options prices. Those prices move 
higher and the VIX goes up, when traders buy them 
as a hedge or speculation against a large SPX price 
change. When option prices move lower because 
traders are selling in expectation of smaller price 
changes, the VIX moves lower. The relationship is 
essentially mechanical. 
Traders may have an idea that short-option 
strategies like short straddles, for example, present 
opportunities when implied vol is higher, and wait for 
a higher VIX before they either open positions or 
increase position size. The higher the volatility, the 
higher the credit received for a short straddle—all 
other things like SPX price, strike price, and time to 
expiration being equal. That higher credit can mean 
higher potential profits and wider break-even points 
for a short strangle, which is why the strategy may be 
more attractive when volatility is higher. That said, 
short strategies in higher volatility environments pose 
great risk due to the wild swings that could drive a 
short option deep in the money very quickly. For that 
reason, you will always need to be aware of the 
increased risks as volatility increases, but as it does, 
how much higher is the credit? 
PUT TO THE TEST 
Let’s use some actual numbers for the dollar amount 
that a change in the VIX means to SPX prices. The dif-ference 
between the VIX at 14, and the VIX at 20, is due 
to SPX option prices. But how much higher are the SPX 
options when the VIX is at 20, than when it was at 14? A 
little bit higher, a lot higher, or somewhere in between? 
ARE 
FILLED 
WITH 
NEWS—
To answer that, I 
did a little study using 
the thinkBack tool on 
the Analyze tab of 
thinkorswim®. 
thinkBack lets you look 
at end-of-day stock-and- 
option prices for 
every trading day going 
back to 2003. Set the 
date in the upper-right-hand 
corner to open up 
the stock and option 
prices for that date. It’s 
very handy for this 
type of analysis. 
I looked for trading 
For illustrative purposes only. Not a recommendation. 
days where the SPX 
prices were very close—only a few points difference 
—and where the expirations were the same number of 
days in the future. The dates I found were July 9, 2013, 
and October 8, 2013. That removed much of the influ-ence 
of the SPX price, and days to expiration on the 
prices of SPX options. The main reason for any differ-ence 
in the option prices would be volatility. So, same 
SPX price, same days to expiration. Only the VIX is dif-ferent. 
Here’s what I found: 
The table above is divided into two sections show-ing 
SPX options with nine days to expiration, and 37 
days to expiration. The strike prices are down the mid-dle. 
On the left hand side are out-of-the-money SPX 
option prices, when the VIX was 14.50. On the right 
are out-of-the-money SPX option prices when the VIX 
was 20.34. The strike prices 1650 and lower, show SPX 
put prices, and the strike prices 1655 and higher, show 
SPX call prices. You want to look only at out-of-the-money 
options because their values are purely extrin-sic, 
and clearly illustrate the impact of higher and 
lower volatility on their prices. 
The VIX at 20.34 is 40% higher than the VIX at 
14.50. You might think that the SPX option prices are 
higher by a similar amount but they’re not. In the case 
of the 1500 puts with 9 days to expiration, with the VIX 
at 14.50 they were .20. But with the VIX at 20.34 they 
were 1.35, or rather 6.5x greater. The 1500 puts with 37 
days to expiration were 2.85 with the VIX at 14.50, but 
7.55 with the VIX at 20.34—more than 2.5x greater. 
The 1650 puts with 9 days to expiration, which 
were closer to the money, were 13.00 with the VIX at 
14.50, and 18.55 with the VIX at 20.34. That’s 1.4x 
higher, which is closer to the increase in the VIX. The 
1650 puts with 37 days 
to expiration were 
28.70 with the VIX at 
14.50 and 37.30 with 
the VIX at 20.34. 
That’s about 1.3x 
higher. 
FOLLOW 
THE RISK 
This analysis illus-trates 
the actual pre-mium 
change for the 
SPX options that 
pushed the VIX from 
14.50 to 20.34. And it’s 
important to under-stand 
that relation-ship. 
It’s not the VIX moving higher that makes the 
SPX option premiums go up. It’s the SPX option premi-ums 
that make the VIX go up. In fact, the SPX options 
moved up a larger percentage, depending on their dis-tance 
out of the money, than the VIX. The further out 
of the money the option was, the greater the percent-age 
price change. The closer to the money the option 
was, the smaller the percent price change. 
That means the VIX is really a shorthand for how 
much premium is available in SPX options. Because 
SPX options represent liquid and efficient markets, and 
they’re used to calculate the VIX, the VIX is a respon-sive 
indicator of potential market risk. This is one good 
reason traders ought to check the VIX daily, arguably 
giving it even more attention than underlying trends. 
Also, note the SPX was the same price, but the VIX 
was different, suggesting the SPX price itself isn’t nec-essarily 
an indication of fear or confidence. That infor-mation 
is packed into the prices of the SPX options, 
and makes the VIX a forward-looking indicator. 
DOES SELLING PREMIUM WHEN VOL IS HIGHER 
guarantee profits? Absolutely not. Is volatility the 
only thing to consider when trading? Nope. But this 
information is a kind of dollar validation for using 
volatility as a basis for a strategy. Arguably, you 
should be looking at the VIX even before looking at 
the price of S&P futures pre-market. For a well-capi-talized 
trader who is comfortable employing short-option 
strategies, the potential reward for keeping a 
sharp eye on the VIX can mean you potentially don’t 
make a little more. You can potentially make a lot 
more for the same level of risk. 
thinkMoney/24 
•21 • 
Volatility Secrets 
• 
tdameritrade.com 
SEE 
GLOSSARY 
PAGE 42 
JUL. 9/13 
SPX 1652 
VIX 14.50 
OCT. 8/13 
SPX 1655 
VIX 20.34 
JUL. 9/13 
SPX 1652 
VIX 14.50 
OCT. 8/13 
SPX 1655 
VIX 20.34 
9 DAYS 
TO EXPIRE 
37 DAYS 
TO EXPIRE 
2.85 
4.00 
5.65 
8.70 
12.90 
19.75 
28.70 
14.55 
6.35 
2.70 
.95 
.55 
.25 
7.55 
9.95 
12.90 
17.00 
22.15 
28.95 
37.30 
25.70 
14.75 
7.45 
3.30 
1.20 
.60 
1500 put 
1525 put 
1550 put 
1575 put 
1600 put 
1625 put 
1650 put 
1675 call 
1700 call 
1725 call 
1750 call 
1775 call 
1800 call 
.20 
.25 
.50 
.95 
2.15 
5.25 
13.00 
3.60 
.65 
.15 
.10 
.05 
.01 
1.35 
2.15 
2.90 
4.55 
6.95 
11.05 
18.55 
10.50 
3.35 
.95 
.35 
.10 
.05 
1500 put 
1525 put 
1550 put 
1575 put 
1600 put 
1625 put 
1650 put 
1675 call 
1700 call 
1725 call 
1750 call 
1775 call 
1800 call 
Important Information 
Naked option strategies involve the highest amount of risk and are only appropriate for traders with the highest 
risk tolerance. Backtesting is the evaluation of a particular trading strategy using historical data. Results presented 
in thinkBack are hypothetical, they did not actually occur and they may not take into consideration all transaction 
fees or taxes you would incur in an actual transaction. Past performance of a security or strategy does not 
guarantee future results or success. Results could vary significantly, and losses could result. Spreads and other 
multiple-leg option strategies can entail substantial transaction costs, including multiple commissions, which may 
impact any potential return. Supporting documentation for any claims, comparison, statistics, or other technical 
data will be supplied upon request.
thinkMoney/24 
•22 • 
The Centerfold 
• 
Illustration by 
Joe Morse 
1st LEVEL: 
Calliputibus 
Volarensis 
OPPOSABLE THUMB CREATES 
ADVANTAGE OVER OTHER 
APES BY ALLOWING 5 LOTS 
EXTRA-LARGE 
FOREHEAD PERFECT 
FOR BEATING AGAINST 
TREE WHEN CLOVIS POINT 
TRADE GOES BAD 
UPRIGHT STATURE APPLIED 
TO OPTION MARKETS AND 
CREATES VERTICALS 
mky. 
Evolution 
of the 
Trader 
• 
The recent 
discovery of the 
“T-DNA,” or trader’s 
genetic code, has 
led scientists to 
piece together the 
thinkMoney family 
tree. Who knew we 
all share a double 
helix started by 
our favorite little 
creature way 
back when?
NONAGENARIAN DOES 
PRECISE PORTFOLIO 
REBALANCES TO KEEP 
WHIPPERSNAPPERS 
AT BAY 
GALLIC KING OF 
TRADERS CORNERS 
MILK MARKET, SETS 
FRANCE UP 
AS CHEESE 
CAPITAL IN 
PERPETUITY 
EDICT FORCING 
ENGLISH SUBJECTS TO 
TAKE OTHER SIDE OF 
ROYALS’ LONG OPTION 
TRADES LEAVES STERN 
RULER PENNILESS BUT 
LOVED BY MILLIONS 
BUYS TOPS, 
SELLS BOTTOMS, 
REPEATS 
BEARISH DRUID 
TRADER PAINTS SELF 
BLUE IN ATTEMPT TO 
CONFUSE COLOR-BLIND 
BULLS 
DELIGHTS IN THE 
SIGHT OF A FLOCK 
OF ATM BUTTERFLIES 
EXPANDING AT 
EXPIRATION 
MUCH TO HIS MOTHER’S 
DISMAY, LIVES LIKE 
HE TRADES—AT THE 
THIRD STANDARD 
DEVIATION 
WORKS LIMIT ORDERS 
SO AGGRESSIVELY THAT 
US MINT IS CONSIDERING 
SUB-$.01 INCREMENTS 
SO EXCHANGES CAN 
KEEP UP 
CONSTANT PANIC 
AND DIRE WARNINGS 
LEAVE WANNA-BE 
BEAR WITH NO TIME 
TO ACTUALLY TRADE 
PENCHANT FOR 
17-LEGGED OPTION 
TRADES LEADS 
PUZZLED ROMAN 
TRADER TO 
RENAME 
HIS CITY 
“BYZANTIUM”
thinkMoney/24 
•25 • 
Market-Neutral 
Trading 
• 
tdameritrade.com 
HOW 
TO NEUTER YOUR 
TRADE 
AT SOME POINT YOU MAY HAVE HEARD AN OPTIONS TRADER BOAST 
ABOUT BEING A “DELTA NEUTRAL” OR “ MARKET NEUTRAL” 
TRADER. BUT WHAT DO THESE TERMS MEAN, AND ARE THEY 
REALLY USEFUL? LET’S PUT THE DEBATE TO REST. 
WORDS BY THOMAS PRESTON PHOTOGRAPH BY FREDRIK BRODÉN
NEUTRAL. The word conjures images 
of a discrete Switzerland 
and fifty shades of beige. 
But add the terms “market” or “delta” and the real fun 
begins. Why? Because “market neutral” and “delta 
neutral” are trading terms—often confused, confus-ing, 
and used interchangeably. Is a market-neutral 
strategy always delta neutral? Or can a delta-neutral 
strategy be market neutral? Rather than get into a 
semantic argument, let’s define them, then explore 
how you can apply them. 
DELTA WHAT? 
Delta neutral means that the delta of a portfolio or 
given position—how much money it will make or lose 
if a stock price changes $1.00, all other factors being 
equal—is zero, or close to zero. 
A simple position like a straddle, or a portfolio 
holding a lot of different options, can have cumulative 
delta close to zero, and be considered delta neutral at 
the onset of a trade, but not likely for long. Delta-neu-tral 
trading kicks in when the need arises to “neutral-ize” 
deltas, or rather, reset the position’s delta to zero. 
Market makers employ this technique when there’s 
too much directional risk—or in trader-speak, too 
many positive or negative deltas (see sidebar, right)— 
in a given position. Market makers continuously buy 
and sell options, and perhaps hedge 
each option trade with stock. For 
them, their profits arise from the 
bid/ask spread, and they don’t want 
to lose those profits if the stock or 
index moves in a given direction. 
For example, if an order comes 
into an exchange to buy out-of-the-money 
(OTM) calls, the market 
maker takes the other side of the 
trade by shorting those calls. The 
short calls have negative delta, and 
can lose money if the stock rallies. The market maker 
may immediately buy stock shares to generate positive 
deltas, to offset the call’s short deltas. If the stock ral-lies, 
he’s hedged. Or, he might see an order for some-one 
trying to buy puts. If he takes the other side of that 
trade by shorting puts, that too, could generate posi-tive 
deltas to hedge the short calls. It’s complicated, 
but being delta neutral keeps the market maker’s 
directional risk low. In that sense, delta neutral is a 
response to a question about an existing position. How 
many deltas does that existing position have, and how 
can they be reduced? More on that later. 
AS FOR MARKET NEUTRAL… 
Market-neutral trading, however, is much closer to 
what retail traders—you and me—do. We might create 
a specific strategy as a market-neutral trade, if we 
believe the stock price or index will stay in a range, or 
at least not move past certain price levels. The market 
bias is neither bullish nor bearish, and the expectation 
is the stock won’t move much at all. Hence, it’s market 
neutral. For example, think short strangles or iron con-dors. 
These market-neutral strategies typically start 
without a bias, and result in positions that we choose 
thinkMoney/24 
•26 • 
Market-Neutral 
Trading 
• 
tdameritrade.com 
SEE 
GLOSSARY 
PAGE 42 
FIGURE 1: Checking deltas. To view the deltas of each position or your entire portfolio in 
thinkorswim, 1) click the little “wrench”-looking thingy in the upper right of the Position 
Statement section of the Monitor page. Then 2) add “delta” in the menu of options to add to 
the columns. For illustrative purposes only. 
1/ 
Click little 
wrench 
2/ 
Add delta 
to the 
columns
based on price, probability, or potential return vs risk. 
Now, market-neutral strategies often have very low 
deltas, at least when trades are initiated. How so? A 
short strangle, for example, composed of a short out-of- 
the-money (OTM) call, and short OTM put in the 
same expiration, can have a very low delta, if the call’s 
and put’s strike prices are roughly the same number of 
points OTM. The short call has a negative delta, and 
the short put has a positive delta. 
Combining the negative delta of the short call and 
the positive delta of the short put, the delta of the 
short strangle is close to zero. But a near-zero delta 
doesn’t always mean market neutral. For example, 
consider a long at-the-money (ATM) call vertical in 
options with single points between strikes. The long 
ATM call option might have a delta of .50, and the 
short-call option at the first OTM strike might have a 
delta of .46. The net delta is .04, which is pretty small. 
But that long-call vertical has a decidedly bullish bias, 
and is not market neutral. It could lose money if the 
stock just sits where it is. So, small delta doesn’t mean 
market neutral. 
By the way, you can always see the delta of your 
current positions on the Monitor page of the thinkor-swim 
® platform (see Figure 1). It’s one of the columns 
in the “Position Statement” section of that page. To 
add delta, click on the little “wrench” icon in the 
upper-right-hand of the Position Statement section, 
and find “delta” from the list of available columns. 
RUBBER, MEET ROAD 
So, hopefully you now understand 
the difference between delta neutral 
and market neutral, but how can you 
use it? Is delta neutral solely for mar-ket 
makers? No. Retail traders, too, 
can employ delta-neutralizing strate-gies 
in an effort to protect profits and 
Important Information 
reduce losses. Unlike a market maker 
who neutralizes delta—i.e., gets the 
delta of a trade close to zero, on a 
trade-by-trade basis—retail traders 
may just want to reduce delta on a 
losing trade to help defend against 
further losses, or on a winning trade to potentially 
capture profits. Let’s see how. 
Consider a scenario with a stock price at $50 and a 
short 47 strike put for a 1.00 credit. This strategy loses 
if the stock price drops, and profits if the stock price 
rises. It has a positive .30 delta when you first put the 
trade on, and a breakeven point at $46. 
Defend against losses. If the stock drops to $48, the 
put will likely be losing money, and its delta rises to, 
say .45. Your strategy now has more delta (directional) 
risk to it, with the potential to lose a growing amount 
of money if the stock continues to drop. 
Now, you could just buy back the short put, but 
maybe you think the stock might stop dropping, or 
even rally a bit. A way to “defend” the short put would 
be to reduce the higher delta by selling a call against it. 
If the 50 call has a .35 delta, selling it for 1.20 would 
generate negative -.35 deltas, and leave you with a 
short 47/50 strangle with a current delta of positive 
.10. Selling the call also adds to the credit of the overall 
strategy, which increases the potential profit to 2.20 
(minus transaction costs), and lowers the downside 
breakeven point to $44.80. Yes, you are adding risk to 
the position if the stock rallies sharply. But if the stock 
continues to drop, you could roll the short call to a 
lower strike to realize even more credit, which would 
lower the downside breakeven point further. 
Capturing profits. On the other hand, let’s say the 
stock rallies from $50 to $53, and the short 47 put is 
now profitable with a delta of .15. Rather than adding 
upside risk by shorting a call to reduce the already-lower 
delta, you might buy the 48 put 
with a delta of .20, for example, if it’s 
trading for less than the credit you took 
in for selling the 47 put. If you can buy 
the 48 put for .75, you’d not only 
reduce your delta from +.15 down to - 
.05, you’d also have the long 47/48 put 
vertical on for a net .25 credit (minus 
transaction costs). 
THESE ARE TWO SIMPLE EXAMPLES 
of reducing a position’s delta. You can 
use verticals or other spreads, for 
example, to reduce delta in a defined 
risk way. But if you understand the 
logic of choosing a specific option or spread based not 
only on how much it neutralizes the delta of a posi-tion, 
but also on how it can potentially enhance or 
improve the resulting cumulative position, you’ll be 
able to think more strategically about individual posi-tions, 
and even your entire portfolio. 
NEUTRAL 
JARGON 
Multiple-leg option 
strategies can entail 
substantial transaction 
costs, including multi-ple 
commissions, which 
may impact any poten-tial 
return. These are 
advanced option strate-gies 
and often involve 
greater risk, and more 
complex risk, than 
basic options trades. 
DELTA 
One of the option 
“greeks” that is the 
measure of expected 
change in an option’s 
price per $1 move in the 
underlying. Long calls 
and short puts have 
negative (-) deltas, 
while long puts and 
short calls have posi-tive 
(+) deltas. The 
maximum deltas a sin-gle 
US option contract 
can have is 100. The 
total sum of all posi-tions 
in a portfolio is 
the portfolio delta. 
DELTA NEUTRAL 
A position or option 
portfolio in which the 
total net deltas of all 
the legs of every posi-tions 
combined equal 
zero. For example, an 
at-the-money straddle 
is a delta neutral posi-tion 
because the call, 
carrying a delta of 50 
offsets the put, with a 
delta of -50, for a net 
delta of 0. Since delta is 
always changing as the 
market moves, market 
makers and option 
traders will often 
reduce (“hedge”) their 
deltas with an offset-ting 
position, such as 
long puts against long 
calls or long stock; and 
short puts against short 
stock. 
MARKET NEUTRAL 
A style of trading in 
which a trader attempts 
to capture profits from 
a stock or index trading 
within a specific range. 
Though some market 
neutral strategies, like 
the straddle, start off 
as delta neutral, that’s 
not always the case.
Gear 
Head 1For your inner trading nerd, one part thinkScript, and one part gadget. Enjoy. COOL SCRIPT #1 
THE DOW-TO-GOLD RATIO 
• Words byDavid “Mr. Script” Kier 
When asked to describe a widespread problem and 
then offer a solution I thought they meant for some-thing 
like global warming. But alas, it was to solve a 
problem related to thinkorswim using thinkScript®, the 
do-almost-anything-we-didn’t-think-of tool. If you're 
new to thinkScript, see the left sidebar to learn more. 
For my first trick, I want to show you how to build a 
NEW TO SCRIPTING? 
chart that displays the ratio of the Dow Jones Industrial 
average to the price of gold. Despite the name, the 
“Dow-to-Gold Ratio” is used by many traders to tell 
how overpriced the S&P 500 (SPX) might be. (See 
Figure 1.) You can see historically as the SPX hit new 
highs, gold was also at highs, and the ratio remained 
relatively low. But at the time of writing, as SPX 
continues to rise, gold is going down. So SPX is 
becoming expensive valued in gold 
as well as U.S. dollars. 
BUILD-A-RATIO 
The Dow-to-gold ratio has been 
used to analyze everything from 
stock-market moves to predicting 
upcoming interest-rate decisions. 
We aren’t going to delve into Dow-to- 
gold theories, but rather describe 
how to see this ratio on thinkor-swim. 
The problem we face is you 
can’t enter ratios in the symbol 
entry box on thinkorswim. So we 
need to think outside the (symbol 
entry) box to solve this one. 
Starting on the thinkorswim 
Charts tab, bring up a one-year 
daily chart of the S&P 500 index by 
entering SPX in the symbol box. We’re going to build 
a study for a lower sub-graph of the chart in which 
the displayed data will be independent of the charted 
symbol—meaning, you can change the symbol with-out 
changing the new study. Once you see an SPX 
chart, fire up the thinkScript Editor by following the 
sidebar “Scripting from the Charts.” Then enter the 
following script: 
1. #hint: Ratio Chart 
2. declare lower; 
3. Input symbol_1 = “/YM”; 
4. Input symbol_2 = “/GC”; 
5. Plot ratio = close(symbol_1) / close(symbol_2); 
6. ratio.AssignValueColor(if ratio >= ratio[1] the 
Color.UPTICK else Color.DOWNTICK); 
After you’ve entered the above code, press Apply 
and OK and you’ll see a chart similar to Figure 2, with 
the Dow-to-gold indicator at the bottom. 
Now let’s break down the code line by line to help 
you figure out how you got there. 
thinkMoney/24 
•28 • 
Trader Tools 
• 
thinkorswim scripts 
and gadgets 
FIGURE 1: How overpriced is it? The Dow-to-Gold ratio (the lower indicator above) 
helps you see how overpriced the SPX (upper chart) might be relative to the ratio. 
For illustrative purposes only. 
You can find help to get 
started in two places: 
1/ The thinkorswim 
Learning Center at 
tlc.thinkorswim.com. 
Select the Charting tab, 
then thinkScript in the 
submenu. 
2/ Read our Scripting 
Special Focus in 
thinkMoney, Winter 
2014, by going to 
tdameritrade.com/ 
thinkmoney. 
3/ Listen to Mr. Script's 
weekly show in the 
thinkScript Lounge of 
the thinkorswim Chat 
Rooms. From thinkor-swim, 
click the Chat icon 
at the top (2nd icon from 
the right) >Chat 
>thinkScript Lounge. 
gear 
Dow-to-Gold 
Ratio script 
results in this 
indicator.
1. Line one is a note which doesn’t 
affect your script but is used to keep 
track of each section’s goal. In our 
example we created “fancy note” by 
using the key word hint. This tells the 
thinkScript Editor to place the little 
help bubble next to our custom script 
in the Edit Studies and Strategies. 
2. Line two tells the script this is a 
study by default that belongs on a 
lower subgraph. This is used with 
studies that don’t relate, or will not 
scale, to the chart’s price graph. 
3. Lines three and four allow you to 
change the raio symbols without edit-ing 
the script.You can customize 
these two inputs in the study parame-ters 
similar to how you customize 
FIGURE 1: Share Your Awesomeness. Set up a chart with all your favorite indicators and 
share it with friends and loved ones. For illustrative purposes only. 
pre-defined studies. Since we are 
building the Dow-to-gold ratio, I used 
the futures for each of these specific products. 
4. Line five is the math, the heart and soul of the 
script. We are simply taking the first input symbol and 
dividing it by the second, thus making it a ratio. 
5. Line six makes the study pretty. The AssignValue- 
Color function allows us to color the line as the ratio 
changes. If the ratio moves up, we color the line as our 
Uptick. And if it moves down, as our Downtick. 
Congrats, you have your own Dow-to-gold ratio 
chart. And since you solved this in a smart way, you 
now create any ratio chart you desire simply by editing 
the symbols in lines 3 and 4. If you’re new to scripting, 
be sure to read our primer on scripting in thinkMoney, 
Winter 2014 issue. We may not have solved global 
warming today, but we did make one small step for a 
legion of traders! 
THINKORSWIM 
SHARING 
ONE WORLD. 
LET’S SHARE IT 
• Words by Chesley Spencer 
With over a bajillion possible 
customizations available, 
thinkorswim can be a little intimidating. Users often 
ask “how do I set up my platform like [insert celebrity 
trader here]?” Trying to replicate another trader’s 
setup used to be quite the exercise, but now it’s as 
easy as a button click. 
The Sharing Center enables users to share and 
consume a dozen different flavors of platform cus-tomizations 
by way of a web link. Each one of these 
platform functions has its own “Share” option that, 
when clicked, will generate a link to a web address 
which can then be given to anyone. Users can share 
their workspaces, watchlists, order or alert templates, 
trade grids, charts, scan queries, thinkScripts (stud-ies, 
strategies, columns, and alerts), or flexible grids. 
As we mentioned, each sharable function has its 
own share button, generally located where that func-tion 
is set up. For example, the button for a single 
chart is at the top of the chart’s border. The grid shar-ing 
button is in the grid menu, etc. Figure 1 shows 
many, but not all, of the locations where these links 
can be created. 
Once you select a share function, a new window 
you’ll see with the option to share the content directly 
with myTrade®, or to create an HTML link which can 
then be posted anywhere you like on the Internet. 
Keep in mind: you’ll need a myTrade username to cre-ate 
a link (so others can see the source). This can be 
created under the Tools tab in myTrade. From 
myTrade, click on “Settings,” edit your Display Name, 
then click “Update Settings.” 
When shared content is loaded into the platform, 
it will either save a copy to load later (such as a Work-space), 
or pop-out in a discrete window (such as a 
chart). This way, you’ll always have the chance to 
save your setup. 
Important Information 
myTrade is a service of myTrade, Inc., a separate but 
affiliated firm. In order to use the service, you must cre-ate 
a myTrade profile, and conform to the myTrade terms 
of use. TD Ameritrade is not responsible for the services 
of myTrade, or content shared through the service. 
2 
Watch It! 
For a more detailed walk-through 
on the Sharing 
Center, watch the video 
in the Learning Center.
ATTACK THE MARKET 
FROM ALL SIDES. 
Turn education into action at the 2014 Investools Investor Education Conference. 
Strategy-building breakout sessions. Insight from industry pros. Networking with like-minded traders. 
FEATURED KEYNOTE SPEAKERS 
 Learn more 
e at 
investoolsconferences.thinkmoney 
TD Ameritrade, Inc. (member 
FINRA/SIPC/NFA) and Investools®, Inc. are separate but affiliated companies that are not responsible for each other’s services or policies. 
Investools, Inc. 
and TD Ameritrade, Inc. arewh 
sep 
parate res 
holly owned subsidiaries of TD Ameritrade Hold 
ing Corporation. 
are wholly Holding TD Ameritrade is a trademar 
rk jointly owned by TD Ameritrade IP Compan 
y, Inc. and The Toronto-Dominion Bank. © 201 
14 TD Ameritrade IP Company, Inc. All rights r 
trademark Company, 2014 with permission. 
Investools does not provide financial advice and is not in the business of transacting trades. 
reserved. Used 
IEG 1316 S 04/14 
AUGUST 18-20, 2014 | DALLAS HYATT REGENCY 
Ken Fisher 
Forbes Columnist 
Find out how a veteran 
money manager is 
handling today’s market. 
T. Boone Pickens 
Visionary Entrepreneur 
Get the latest on the 
energy market—and 
why you should care. 
investools 
conferences.com/th 
hinkmoney 
fi 
/ 
nancial trans 
y 
acting IE 
sponsible EG
•Hey kid, you wanna come work for me? 
That was thinkorswim® founder Tom 
Sosnoff, talking to Mike Barwacz thirty 
years ago on the trading floor of the 
Chicago Board Options Exchange (CBOE). 
Happily for us, Barwacz said yes, and first 
clerked for Sosnoff before moving into the 
OEX pit as a market maker in his own right. 
Back then, Barwacz took a lot of grief for 
his trading badge which read “SYZ” (pro-nounced 
“size”)—an ironic acronym since 
he started as a one- and two-lot trader. 
As fate would have it, the acronym 
spoke volumes about Barwacz’s ambition 
and drive. Still a passionate trader geek, 
he’s now Director of TD Ameritrade’s Trade 
Desk and oversees teams in Chicago, Fort 
Worth, and Canada. Not surprising, he 
draws heavily on 22 years of knowledge 
and wisdom from the trading floor to 
ensure trade-desk reps have the right stuff 
to talk to clients about even the most com-plex 
options strategies. 
Barwacz is called the unofficial mayor of 
Chicago for good reason, and walking the 
CBOE trading floor with him takes some 
time. He seems to know everyone and loves 
to talk trading strategies. We wondered how 
his years on the floor helped shape who he 
is today. 
Meet the Mayor 
Mike, tell us about those early days at the 
CBOE. 
It was the mid-1980s and options were get-ting 
hot. That was the buzz. At one point 
the OEX (SP 100) was the biggest pit in the 
world and had almost 600 guys. Tom Sos-noff, 
JJ Kinahan and I, we all stood very 
close to each other. We were like family. The 
best days were when you really couldn't 
leave, because there was so much paper 
(orders), and you were sweating through 
your coat. It was great. The energy, the com-petitiveness, 
having a broker yell something 
out, and you being the first on the ticket. 
You were at thinkorswim in the early 
days, right? 
I joined thinkorswim (when it was an 
independent brokerage) in 2007 and 
helped guide the Chicago office through 
TD Ameritrade transition after the merger. 
Hiring people from the floor is what made 
thinkorswim so special. Floor traders are a 
different breed. We 
have a different 
gene. As competi-tive 
as it was, there 
was also honor and 
etiquette, which we 
took off the floor as 
well. We knew how 
to talk to clients 
and explain things 
in a clear, simple 
manner. That’s the 
benefit of coming to 
TD Ameritrade. It's 
like a family here. 
What are your 
three trading rules 
to live by? 
Don’t panic, man-age 
your winners, 
learn from your 
mistakes. 
What's the bigger 
goal ahead for 
Trade Desk? 
At the time 
TD Ameritrade 
bought thinkor-swim, 
about 6% of 
their trades were 
options. Now, it’s 
40%. We wanted 
customer-service reps to be able to answer 
complex phone calls about option strate-gies. 
So, in the last year and a half, we've 
combined trade desks into the “One Trader 
Group,” and taken reps through a rigorous 
training. We make sure all our trade-desk 
reps trade, or paper trade. They've got to 
have skin in the game. We hire people who 
are passionate about trading. 
I heard a rumor you like to “initiate” 
unsuspecting guests? 
Well, I’ve been called the “Entertainment 
Committee.” So yeah, if you’re visiting 
TD Ameritrade’s Chicago office on busi-ness, 
I’d likely be the one showing you 
around. We might make it over to the 
Motel Bar for an introductory shot of 
Malört (an infamously terrible-tasting, 
Chicago-made liquor, by the way). That’s 
all I’m going to say. 
thinkMoney/24 
•31 • 
Associate Spotlight 
• 
A chat with a TD Ameritrade 
VIP making waves 
• 
Interview by 
Kira Brecht 
• 
Illustration by 
Joe Morse 
• 
TD Ameritrade’s Mike Barwacz runs the innovative 
Trading Desk with old-school principles. 
spot
thinkMoney/24 
•32 • 
Special Focus: 
thinkorswim 
Charts 
• 
tdameritrade.com 
CHARTS 
THAT 
NO DOUBT YOU CAN FIND LOTS 
OF CHARTING PROGRAMS 
OUT THERE. BUT SERIOUSLY, WHY 
LOOK FURTHER? OTHER THAN 
A BACK MASSAGE, THINKORSWIM® 
CHARTS CAN DO ALMOST 
ANYTHING YOU’D NEED A CHART 
TO DO—EVEN IF YOU’RE NOT A 
CHART READER. 
RULE 
THE 
WORLD 
WORDS BY 
THOMAS PRESTON 
PHOTOGRAPH BY 
FREDRIK BRODÉN 
SPCL 
FOCUS
thinkMoney/24 
•34 • 
Special Focus: 
thinkorswim 
Charts 
• 
tdameritrade.com 
WANT TO KNOW A 
LITTLE SECRET? When the thinkorswim® 
platform was first built, it didn’t have charts. It’s not 
that the development team couldn’t build chart func-tionality. 
It’s just that as ex-market makers, we didn’t 
think to add them because we hadn’t really used them. 
Then two things happened. One, customers started 
to ask for charts. And two, we figured out some cool 
chart functionality that would help traders who didn’t 
do technical analysis. 
I won’t bore you with how to interpret the hundreds 
of technical studies or chart drawings the platform sup-ports. 
You’ll find volumes of books on that subject. I 
want to focus on the stuff you may not have seen—the 
cooler stuff that’s easy to overlook. 
Let’s shine a light on some of the features that 
chartists and non-chartists alike can use in day-to-day 
trading. These instructions will be based on the Charts 
page unless otherwise noted. 
OVERLAYS 
An overlay is when you have two or more different 
stocks or indices displayed on the same chart. It’s a 
way to see relative performance—whether one is over-or 
under-performing another. It can be a measure of 
relative strength, and it’s also handy if you’re doing 
pairs trades. (See Figure 1.) 
Here’s how you do it: 
1— Look in the upper-right-hand corner for the Studies 
button. Click on it, then hold the cursor over “Add 
Study” to see the expanded menu. 
2—Hold the cursor over “Compare With” at the bottom 
of that menu. You’ll see for example a list of default 
index symbols like DJX and SPX, as well as “Custom 
Symbol” at the top. If you click on one of the index 
symbols, or enter another symbol when you click on 
“Custom Symbol,” a chart for that symbol is overlaid 
on the chart. 
For example, if you have a chart for DJX and you 
select SPX from the list of indices, an SPX line chart 
will be displayed along with the DJX chart. The vertical 
axis on the left-hand-side will be scaled for the overlay 
symbol so the high-and-low range fits on the same 
chart as the original symbol. That’s how the SPX, 
whose price is 10x the price of the DJX, can be dis-played 
on the same chart. You can also go back to the 
“Compare With” menu and add more indices or cus-tom 
symbols. 
To take overlays one step further, click on the 
“Style” button in the upper-right-hand corner, then 
click on “Settings.” Now in the “Chart Settings” win-dow, 
click on the “Price Axis” tab and check the “Show 
Price as Percentage” box. That switches the vertical 
axis on the left-hand side of the chart to show the per-centage 
change each symbol has had from the first date 
on the left-hand side of the chart, to the current day. 
This makes it easier to compare performance of two 
symbols with different prices. 
BACKTESTING* 
You can test trading strategies based on technical indi-cators, 
and see the profit-and-loss performance right on 
the charts. The charts have what we call “Strategies,” 
which are simulated long-and-short entry and closing 
points determined by a technical indicator. You can 
code your own strategy, which is beyond the scope of 
this article, but I’ll show you how to get started: 
1—Click on the “Edit Studies” icon in the upper-right-hand 
corner. 
FIGURE 2: Real test, fake money. 
Backtest a strategy first. Then view 
the entry and exit points on the chart, 
as well as a p/l before committing 
real dollars. 
Short 
Entry 
Long 
Entry 
FIGURE 1: Comparing Notes. Use 
the overlay function in thinkorswim, to 
compare two stocks, or in this case a 
stock to the SPX (pink line). 
For illustrative purposes only. For illustrative purposes only.
2—In the window that pops up, click the “Strategies” 
tab on the upper-left corner. 
3—On the left-hand-side you’ll see a list of the default 
strategies available. To make the strategies “work,” you 
need to add commands that will show both “long 
entry” (LE) and “short entry” (SE), at a minimum. 
4—For practice, look for the “BollingerBandsLE” and 
“BollingerBandsSE” strategies in the list. Those are the 
long-entry and short-entry commands based on 
Bollinger bands. Double click on each one and it will 
be added to the list of studies and strategies on the 
charts in the main body of the “Edit Studies and Strate-gies” 
window. 
5—Click the “Apply” button in the lower-right-hand 
corner of the window, then the “OK” button. 
You should see “BollingerBandsLE” and “Bollinger- 
BandsSE” labels on the chart, indicating simulated 
buying and selling 100 shares of stock based on the 
Bollinger Band test. To see the profit and loss of those 
simulated trades, place the cursor directly on one of the 
labels, and right click to open a new menu. Click on 
“Show Report” in that menu to open the “Strategy 
Report” window. There you’ll find the buy-and-sell sig-nals, 
and profit-and-loss data for the strategy. 
And by the way, if you want to buy or sell the 
chart’s stock shares for real, right click in the chart’s 
main body and select “Buy” or “Sell” from the drop-down 
menu. Plus, on the far-right-hand side of the 
chart window, you’ll see tabs for “Trade,” “Time and 
Sales,” “Level II,” etc. This lets you add windows with 
those features next to the chart window. That can basi-cally 
set up charts as your go-to page for stock and 
futures trading needs. 
LOOKING INTO THE FUTURE 
OK, not even thinkorswim has a crystal ball. But Charts 
let you see future dates to the right of the current date. 
This helps you locate upcoming earnings and dividend 
dates, for example, as well as helps you extend draw-ings 
like trend lines into the future so you can identify 
possible price targets. The process? 
1— Click on the “Style” button in the upper-right-hand 
corner and click on the “Settings” choice in the drop-down 
menu. 
2— Click on the “Time Axis” tab in the “Chart Set-tings” 
window. 
3— Now look for the “Expansion Area” control. You 
can enter a number in the field for “bars to the right”— 
say, 50—then click the “Apply” button on the win-dow’s 
bottom-right-hand corner. 
That will add empty space to the right of the current 
date on the chart (see Figure 3). Once you’ve done that, 
you can extend a trend line or other drawing into that 
space. Place the cursor directly on the trendline and 
right click. Select “Extend to Right” from the drop-down 
menu and you’ll see that line in those future dates. 
A study that’s built specifically for those future dates 
is the Probability of Expiring Cone (Figure 3 also). This 
draws the upper-and-lower bounds of a stock’s or 
index’s price range that theoretically encompasses a 
level of probability. 
One way to add the cone study is to click on the 
FIGURE 3: Peeking at the Future. By adjusting the 
chart to stop 50 bars from the right (shaded area), you 
can view future earnings and dividend dates. Add a prob-ability 
cone (pink curve line) to estimate the probability 
range in which a stock will trade prior to those dates. 
More on Charts, 
Please... 
If you're looking for even 
more awesomeness to 
squeeze out your thinkor-swim 
Charts, learn more at 
the thinkorswim Learning 
Center. Go to: 
tlc.thinkorswim.com 
then click Charts. 
Right-click 
here  choose 
“Show 
Report” 
Probability 
Cone 
Future 
Earnings  
Dividend 
Dates 
For illustrative purposes only.
thinkMoney/24 
•36 • 
Special Focus: 
thinkorswim 
Charts 
• 
tdameritrade.com 
“Edit Studies” icon in the upper-right-hand 
corner and find “ProbabilityofExpiringCone” 
from the list of studies on the window’s left-hand 
side. Double click to add it to the list of 
chart studies. You’ll also find two fields to 
edit for the study. The “period” is the num-ber 
of future dates for which the probability 
cone is calculated, and the “prob range,” is 
the probability the projected range covers. 
The default “prob range” is 68%, which cor-responds 
roughly to one standard deviation. 
Set it to 95% to see a cone that covers two 
standard deviations, or 99%, to see a cone 
that covers three standard deviations. 
THESE FEATURES REALLY JUST SCRATCH 
the surface of charting functionality. But 
hopefully you now have an idea of their 
scope and how to access them. Each of the 
described menus has other choices that 
lead you to other functions. Go ahead and 
continue to explore the charts to see just 
how hard you can make them work for you. 
Important Information 
*Backtesting is the evaluation of a particular 
trading strategy using historical data. Results 
presented are hypothetical, they did not actu-ally 
occur and they may not take into consid-eration 
all transaction fees or taxes you 
would incur in an actual transaction. And 
just as past performance of a security does not 
guarantee future results, past performance of 
a strategy does not guarantee the strategy will 
be successful in the future. Results could vary 
significantly, and losses could result. 
myTrade is a service of myTrade, Inc., a 
separate but affiliated firm. In order to use 
the service, you must create a myTrade pro-file, 
and conform to the myTrade terms of use. 
TD Ameritrade is not responsible for the 
services of myTrade, or content shared 
through the service. 
Supporting documentation for any 
claims, comparison, statistics, or other techni-cal 
data will be supplied upon request. 
1/ 
Determine 
Trend 
How to…Find and 
Chart Your Next Trade 
• 
It’s easier than you think. Just ask three questions. 
Often, too many indica-tors 
can lead to indeci-sion 
and antacids. But there’s a more 
logical approach to finding a potential 
trade and plotting a chart using just a few 
indicators to answer some important 
questions you might have about what a 
stock may do next. 
STEP 1: SCAN THE UNIVERSE 
Using Stock Hacker in the Scan tab of 
thinkorswim® trading platform, refer to 
Figure 1. There you can scan the world of 
stocks with your own criteria, containing 
the list of stocks to scan, your filters, and 
all the price data your heart desires. 
Then… 
FIGURE 1: 
Legal Hacking. 
Scanning for trades with 
Stock Hacker is as simple 
as choosing the list, then 
your parameters, and 
sorting how you want 
the results to show. For 
illustrative purpose only. 
1—Choose the subset of stocks you 
would like to scan from the drop-down 
next to the words “Scan in.” There, you 
can see predefined categories as well as all 
your personal watch lists, and GICS classi-fied 
industry lists. 
2—Choose All Optionable if you only 
want to see stocks with listed options. 
3—Select “Add Stock Filter” below the 
“Scan in” drop down to add a stock filter 
to the existing set of criteria. 
4—Choose Last and enter a minimum 
and maximum price of the stock. 
5—Now click the “Add Study Filter” but-ton. 
Use the drop down to select the “Price 
Performance” group and choose “Price 
Direction.” The default inputs for this fil-ter 
are “CLOSE” and “increased,” which 
we’ll keep. But you might want to increase 
the number of bars of data to more than 3. 
6—Sort for the most heavily traded by 
choosing the “sorted by” dropdown to the 
left of the scan button. Select “Basic Price 
 Quote” menu and choose “Volume.” 
WORDS BY 
DAVID KIER 
FIGURE 2: 
Chart the Trade. 
Once you find a stock in 
Stock Hacker, right click 
and choose “TOS Chart.” 
Then answer the ques-tions 
above. For illustra-tive 
purpose only. 
chrts 
A Choose 
stock list 
A Choose 
stock list 
A Choose 
stock list 
2/ 
Determine 
Strength 
of Trend 
3/ 
Is Trend 
Strengthening
7—In the next menu choose “Descending.” 
Then press “Scan.” 
The results will appear at the bottom of 
the screen like orderly soldiers. If you’re not 
happy with them, you can always edit the 
filters. 
STEP 2: MASTER THE UNIVERSE 
Okay, maybe not the actual universe, but 
you can attempt to determine where the 
stocks in your world are going by charting 
them in the thinkorswim Charts. Just right 
click on any symbol in the scan results and 
choose “TOS Charts.” 
If you’ve never charted, you should try 
to answer three basic questions: 
1—What’s the trend? 
2—How strong is the trend? 
3—Where do I get in? 
To help us with these questions, we’ll 
add three studies: simple moving average, 
volume, and Relative Strength Index, and 
make a couple of minor adjustments to the 
parameters. 
Referring to Figure 2, change your chart 
to a one-year daily chart. Then, from the 
studies menu in the upper right corner of 
your chart, add SimpleMovingAvg and RSI-Wilder. 
Click on the SimpleMovingAvg and 
edit the length of the study to 50. You don’t 
have to add volume since it is already 
turned on by default. However, if your vol-ume 
isn’t displayed you can add it within 
the Settings menu. 
Once you’ve got thinkorswim Charts set 
up, you can answer the three questions. 
One: Is the stock clearly trading above the 
simple moving average (blue line in chart) 
or has it recently crossed above the line? 
Two: does the indicator line in the RSI-Wilder 
cross from below the 30 line to above 
the 30 line recently? 
Three: is the volume increasing or higher 
than normal (bars are higher than prior 
bars, indicating more traders committing to 
the trade)? 
WHILE THERE’S NEVER A GUARANTEE 
that a trend will continue, if you’ve 
answered “yes” to all three of these, then 
there’s a good chance you may have filtered 
for a stock or two smack dab in the heart of 
a bullish run. Happy trading! 
Q: How can I synchronize 
drawings across multiple 
chart windows with the 
same symbol? 
A: If you have a drawing 
like a trend line or a price 
level on a chart, you can 
have that appear at the 
same price level on another 
chart, even if it has a differ-ent 
time scale. Click on the 
“Style” button, then click 
on “Settings.” In the “Gen-eral” 
tab of the “Chart Set-tings” 
window, you’ll see 
“Synchronize” with a 
checkbox for “Drawings” 
and “Crosshair Position” in 
the middle of the left-hand 
side. If those are checked, 
you can get a drawing dis-played 
on a daily chart and 
a minute chart, 
for example, that have dif-ferent 
price scales without 
your having to recreate the 
drawing. 
Q: I’ve set up my charts 
just how I like them. How 
do I save the settings and 
have them open as my 
default? 
A: Once you have the time 
frame, technical studies, 
colors, and other settings 
established for each new 
chart, click on the “Style” 
button, then click on “Set 
Chart Default” from the 
drop-down menu. Now you 
can close the thinkorswim 
platform and reopen it with 
your favorite chart settings 
loaded as a default. 
Q: How can I share my 
chart settings with some-one 
else? 
A: You can share your 
charts on the thinkorswim 
platform with anyone else 
who uses the platform. 
Click the “Share” button 
in the upper-right-hand 
corner. This opens a win-dow 
with a choice to share 
the chart you’re currently 
on via email, Facebook, 
Twitter, or myTrade®. If 
you choose email, Face-book, 
or Twitter, you can 
copy and paste a link. As 
long as the other person 
has the thinkorswim plat-form 
open, the link will 
open up a chart window 
with your symbol, studies, 
and settings. 
Q +A 
FAQs. 
PRECISION 
CHARTING 
HOW TO 
EDIT YOUR 
STUDIES 
In thinkorswim 
Charts, if you click 
on the “Studies” 
button in the 
upper-right-hand 
corner and hold the 
cursor over “Add 
Study,” you’ll see 
dozens and dozens 
of different techni-cal- 
analysis tools 
you can add to a 
chart. But if you 
know your studies, 
you’ll know that 
most of them have 
parameters that 
can be changed— 
things like the 
number of data 
bars used in the 
study, or like the K 
period and D period 
in Stochastics, for 
example. There’s a 
fast way to edit 
those inputs and 
parameters. 
1— In the upper-right- 
hand corner, 
look for the “Edit 
Studies” icon that 
looks like a test 
tube releasing a 
drop of liquid. It’s a 
couple inches to 
the left of the 
“Studies” button. 
2— Click on that 
icon to open the 
“Edit Studies and 
Strategies” window. 
3— In that win-dow’s 
main area, 
you’ll see any stud-ies 
you’ve loaded 
on the chart. Hold 
the cursor over the 
study you want to 
edit and click the 
“gear” icon on the 
right-hand side. 
That opens the 
controls to change 
the study’s inputs, 
as well as color for-mats.
• These days, trading terms may not be as 
complicated as “supercalifragilisticexpiali-docious.” 
But close. Like flying nannies, 
market words are weird and wonderful. 
Understanding references like “contango” 
and “backwardation” could hold the secret 
to your success when you try to make sense 
of price moves in ETF products whose val-ues 
are tied to futures contracts. 
Remember a futures contract is an 
agreement to buy or sell something—like 
oil, for instance—at some time in the, well, 
future. In general, futures prices differ from 
“spot prices,” which represent real-time 
cash prices. 
If a future price trades higher than the 
spot, this is called “contango.” If a future 
price trades lower than the spot, this is called 
“backwardation.” Note the following table. 
As an example, crude oil is said to be 
“in contango” when longer-dated con-tracts 
trade at increasingly higher premi-ums 
over cash. This premium exists to 
cover the costs, for instance, of paying the 
storage for the oil between now and a 
futures expiration. As the contract gets 
closer to expiration, this premium begins 
to “decay,” until the price of the expiring 
future matches the cash. 
For instance, assume a cash price of 
$100 per barrel, and $105 for a 30-day 
futures contract. If oil’s cash price remains 
unchanged, then 30 days later the expiring 
futures contract will also be worth $100. If 
you had bought the futures contract, you 
just lost $5. 
Just a Spoonful of Sugar... 
What does this have to do with your trad-ing 
life? Even though you’re trading an ETF, 
in reality you’re trading futures contracts 
(at least through the fund manager) 
because products such as oil ETFs—derive 
their prices from futures. The goal of an oil 
ETF isn’t simply to track the price of oil. It’s 
to track the price of oil using near-month 
oil futures. 
As a fund’s near-term futures contracts 
approach expiration, those contracts need to 
be rolled over into 
longer-term futures 
expirations so the 
fund avoids being 
forced into taking 
physical delivery of 
all that crude. 
And when the 
market is in con-tango, 
guess what? 
You end up paying 
more for the 
longer-term con-tract 
than what you 
receive from selling 
the shorter-term 
contract, and the 
net price of your 
investment goes 
down. This is 
called “roll decay,” 
and with oil futures 
expiring every 
month, this decay 
can really add up. 
REMEMBER THAT 
just because a 
market is in con-tango, 
and longer-term futures cost more 
than shorter-term contracts, that doesn’t 
necessarily ground your investment. It’s 
just a headwind to keep track of. Given 
that the value of oil, volatility, or whatever 
it is you're trading, could go up, this 
change in the cash price might be enough 
to offset ‘roll decay’. Or it might not. You 
may not have to clean chimneys, but 
watch the words that make the market. 
And above all, always work to under-stand 
the products you’re trading. 
thinkMoney/24 
•38 • 
Capiche 
• 
Pearls from a 
veteran floor trader 
• 
Words by 
Greg Loehr 
30-day future price—contango $105 
Cash (spot) price $100 
30-day future price—backwardation $95 
For illustrative purposes only. 
Burned by Oil Rolls 
• 
If you’re trading futures-based ETFs, 
beware of the “rolling risk” 
Important Information 
Carefully consider the investment objectives, risks, charges and expenses before investing. A 
prospectus, obtained by calling 800-669-3900, contains this and other important information 
about an investment company. Read carefully before investing. 
Commodity ETFs may be affected by changes in overall market movements, commodity 
index volatility, changes in interest rates or factors affecting a particular industry or commod-ity. 
Commodity ETFs may be subject to greater volatility than traditional ETFs and may not 
be suitable for all investors. Unique risk factors of a commodity fund may include, but are 
not limited to the fund's use of aggressive investment techniques such as derivatives, options, 
forward contracts, correlation or inverse correlation, market price variance risk and leverage. 
This information is for educational purposes only.This is not a recommendation to trade 
any specific security. 
cap.
Introducing CBOE Short-Term Volatility IndexSM (VXSTSM) 
options and futures, with weekly expirations. 
By tracking 9-day expected volatility, Short-Term VIX is particularly reactive to 
changes to the SP 500® Index. So now you have the opportunity to capture more 
risk premiums with weekly expirations. Capitalize on sudden market events. Better 
manage near-term risk. And help take advantage of volatility for the here and now. 
Download the Short-Term VIX quick reference guide at ShortTermVIX.com 
Tweet with dollar-sign tag $VXST 
Options involve risk and are not suitable for all investors. Prior to buying or selling an option, a person must receive a copy of Characteristics and Risks of Standardized Options. Copies are available 
from your broker, by calling 1-888-OPTIONS, or at www.theocc.com. Futures trading is not suitable for all investors, and involves risk of loss. Futures and options on CBOE’s volatility indexes have 
several unique features that distinguish them from most equity and index options, and investors are strongly encouraged to closely read and understand the ODD and the VIX options FAQ at http://ww-w. 
cboe.com/micro/vix/vixoptionfaq.aspx and other informational material before investing. No statement within this ad should be construed as a recommendation to buy or sell a security or futures 
contract or to provide investment advice. CBOE® and Chicago Board Options Exchange® are registered trademarks and Execute SuccessSM, CBOE Short-Term Volatility IndexSM and VXSTSM are service 
marks of Chicago Board Options Exchange, Incorporated (CBOE). SP and SP 500® are registered trademarks of Standard  Poor’s Financial Services, LLC and are licensed for use by CBOE and CBOE 
Futures Exchange, LLC. SP does not sponsor, endorse, sell, or promote any SP index-based investment product. © 2014 CBOE. All Rights Reserved.
Q: Hey, Trader! 
When I look at 
options, I usually 
see that out-of-the-money 
(OTM) puts 
have a higher price 
than OTM calls that 
are the same dis-tance 
out of the 
money. And some-times 
I see stocks 
whose OTM calls 
are higher than the 
OTM puts. What’s 
going on and why? 
T: That, my friend, 
is volatility skew in 
action. Vol skew, for 
short, is when the 
implied volatilities 
of the options in a 
particular expiration 
aren’t all the same. 
If you look at a 
graph of the implied 
vols, they usually 
slope up, and away, 
from the ATM 
strikes. And the 
slope is often 
steeper for the OTM 
puts than the OTM 
calls. This is 
because investors 
often buy OTM puts 
as a hedge against 
long stock, and sell 
OTM calls as either 
a covered call, or to 
finance buying the 
put. That buying-and- 
selling pressure 
drives the implied 
vols of the puts 
higher than the 
calls, which in turn 
makes the puts look 
more expensive 
than the calls. But 
when calls are more 
expensive than the 
puts, the slope of 
the call skew is 
steeper than the put 
skew, and that can 
happen when the 
stock has a lot of 
speculative activity. 
Investors who 
believe a stock 
might make a big 
move higher may 
buy calls, which can 
drive those particu-lar 
values, and 
implied vols, higher. 
Q: Why do my 
AAPL* options look 
so strange after the 
stock split 7-1? 
T: No matter how 
strange things look, 
remember that the 
split itself doesn’t 
change the value of 
your position. 
That said, let’s 
look at an AAPL 
option pre- and 
post-split. If the 
August 560 put is 
trading for $14.00 
and has .33 delta 
pre-split, it would 
be worth about 
$100 more if AAPL 
dropped $3.00 
(with all other 
things being equal) 
and the 560 put 
rose to $15.00. 
Post-split, the price 
of AAPL was 1/7th 
of the pre-split 
price, and all the 
option strike prices 
were adjusted 
down to 1/7th, too. 
So, the 560 put 
turned into the 80 
put and might be 
worth about $2.00. 
But the single 560 
put turned into 
seven 80 puts. A 
single 560 put at 
$14.00 has a $1400 
value, and 7 80 
puts at $2.00 also 
have a $1400 value. 
Now, the delta of 
the 80 put will still 
be about the same 
as the 560 put, .33. 
And if AAPL drops 
the same percent-age 
post-split as 
pre-split, a $3.00 
drop would be 
about $.43. That 
means the 80 put 
would increase by 
about .142. Since 
you have 7 of the 
80 puts, 7 x $14.20 
= $99.40, which is 
nearly the same as 
the pre-split change 
in value. That 
means the risk of 
your position does-n’t 
change from 
pre- to post-split. 
Q: Hey, Trader! 
Greetings! My 
name is Zyphro 
and I come from 
the year 2514. I 
wish to bestow 
upon you all the 
Fed announce-ments 
from your 
time until mine so 
your future self 
can be wealthy! 
T: Um, thanks 
Zyphro, but even if 
I knew what the 
Fed numbers were 
going to be, I’d still 
have no idea which 
way the market 
would move. Seri-ously, 
that stuff is a 
coin flip. Interpret-ing 
Janet Yellen’s 
statements is a job 
all by itself. I’m too 
busy actually trad-ing. 
But if you 
know the future, 
can you tell me if 
this burrito I’m 
about to eat will 
keep me up all 
night? 
thinkMoney/24 
•4 0 • 
Ask the 
Trader Guy 
• 
Rescuing traders, 
one question at a time. 
• 
Photograph by 
Fredrik Brodén 
trdr. 
Important Information 
*Security symbols 
displayed for infor-mational 
purposes 
only. This is not a 
recommendation to 
trade any specific 
security. 
Multiple-leg 
option strategies can 
entail substantial 
transaction costs, 
including multiple 
commissions, which 
may impact any 
potential return. 
These are advanced 
option strategies and 
often involve greater 
risk, and more com-plex 
risk, than basic 
options trades.
Bring out the option trading 
machine in you. 
Stay on top of the option market with thinkorswim® platform tools. 
You eat iron condors for breakfast. You straddle the market like it’s nobody’s business. When it comes to option trading, you think 
you know it all, right? Think again. There’s a world of option opportunity out there. And we keep bringing you the innovative tools 
to help take it on. Slice and dice data like never before with option statistics. Scan thousands of optionable stocks in seconds with 
dynamic scanning. It’s no wonder why Barron’s named us among the “Best for Options Traders” five years in a row.* 
Learn more at tdameritrade.com/options 
Market volatility, volume, and system availability may delay account access and trade executions. 
Options are not suitable for all investors as the special risks inherent to option trading may expose investors to potentially rapid and substantial losses. Option trading privileges subject to TD Ameritrade 
review and approval. Before trading options, carefully read the previously provided copy of the options disclosure document: Characteristics and Risks of Standardized Options. See our website or 
contact us at 800-669-3900 for additional copies. 
*TD Ameritrade was among the firms listed in the category of “Best for Options Traders” in Barron’s Online Broker Review for five years in a row (2009-2013). Barron’s is a trademark of Dow Jones, L.P. 
All rights reserved. Reprinted with permission. 
TD Ameritrade, Inc., member FINRA/SIPC/NFA. TD Ameritrade is a trademark jointly owned by TD Ameritrade IP Company, Inc. and The Toronto-Dominion Bank. © 2013 TD Ameritrade IP Company, Inc. 
All rights reserved. Used with permission.
thinkMoney/24 
•42 • 
The Token 
Glossary 
• 
Terms you might 
stumble across in 
this issue. 
• 
tdameritrade.com 
OUT OF 
THE MONEY 
(OTM) 
• An option whose 
premium is not only 
all “time” value, but 
the strike is away 
from the underlying 
equity. For calls, it’s 
any strike higher than 
the underlying. For 
puts, it’s any strike 
that’s lower. 
AT THE 
MONEY 
(ATM) 
• An option whose 
strike is “at” the price 
of the underlying 
equity. Like out-of-the- 
money options, 
the premium of an 
at-the-money option 
is all “time” value. 
IN THE 
MONEY 
(ITM) 
• An option whose 
premium contains 
“real” value, i.e. not 
just time value. For 
calls, it’s any strike 
lower than the price 
of the underlying 
equity. For puts, it’s 
any strike that’s 
higher. 
26 
found on page: 
Short Straddle 
/Strangle 
• A market-neutral strategy with 
unlimited risk, composed of an equal 
number of short calls and puts of the 
same strike price (straddle) or two dif-ferent 
strike prices (strangle), result-ing 
in a credit taken in at the onset of 
the trade. The strategy assumes the 
underlying will stay within a certain 
range, in which case, as time passes 
and/or volatility drops, the options 
can be bought back cheaper than the 
credit taken in, or expire worthless; 
resulting in a profit. Breakeven points 
of either strategy at expiration is cal-culated 
by adding the total credit 
received to the call strike and sub-tracting 
the total credit received from 
the put strike. 
SHORT 
• To short is to sell an asset, such as 
an option or stock that you don’t own 
in order to collect a premium. The 
idea being that if you believe the 
price of the asset will decline, you 
can buy back (or “cover”) your short 
at a lower price later. Your potential 
profit would be the difference 
between the higher price you 
shorted at and the lower price you 
covered. 
found on page: 
20 27 
Theta 
• A measure of an option’s sensitivity 
to time passing one calendar day. For 
example, if a long put has a theta of - 
.02, the option premium will decrease 
by $2. 
VEGA 
• A measure of an option’s sensitivity 
to a 1% change in implied volatility. For 
example, if a long option has a vega of 
.04, a 1% increase in implied volatility 
will increase the option premium by $4. 
Delta • A MEASURE OF AN OPTION’S SEN-SITIVITY 
TO A $1 CHANGE IN THE 
UNDERLYING ASSET. ALL ELSE BEING 
EQUAL, AN OPTION WITH A 50 DELTA 
(ALSO WRITTEN AS .50) FOR EXAM-PLE, 
WOULD GAIN 50 CENTS PER $1 
MOVE UP IN THE UNDERLYING. LONG 
CALLS AND SHORT PUTS HAVE POSI-TIVE 
(+) DELTAS, MEANING THEY 
GAIN AS THE UNDERLYING GAINS IN 
VALUE. LONG PUTS AND SHORT 
CALLS HAVE NEGATIVE (–) DELTAS, 
MEANING THEY GAIN AS THE 
UNDERLYING DROPS IN VALUE. 
Long Straddle 
• A market neutral, defined risk position, composed of an 
equal number of long calls and puts of the same strike 
price. The strategy assumes the market will break out one 
way or another, in which case, a profit occurs when one 
side of the trade gains more than the other side loses. 
Breakeven points are calculated by adding and subtracting 
the total debit to and from the strike price of the options. 
13  27 
found on page: 
found on page: 
found on page: 
found on page: 
12, 21, 
26 38 
gls 
found on page: 
13 
13 
12, 20, 26 38
Thinkmoney 2014 summer

Weitere ähnliche Inhalte

Was ist angesagt?

The 25 smartest things warren buffett ever said
The 25 smartest things warren buffett ever saidThe 25 smartest things warren buffett ever said
The 25 smartest things warren buffett ever said
Chessy Cherian
 
101 money secrets
 101 money secrets 101 money secrets
101 money secrets
laburun
 

Was ist angesagt? (20)

Penny stocks site
Penny stocks sitePenny stocks site
Penny stocks site
 
The 25 smartest things warren buffett ever said
The 25 smartest things warren buffett ever saidThe 25 smartest things warren buffett ever said
The 25 smartest things warren buffett ever said
 
Making Money Trading Financial Markets - Update Vince Stanzione
Making Money Trading Financial Markets - Update Vince StanzioneMaking Money Trading Financial Markets - Update Vince Stanzione
Making Money Trading Financial Markets - Update Vince Stanzione
 
Get Out Of That Trade
Get Out Of That TradeGet Out Of That Trade
Get Out Of That Trade
 
Investing the tastytrade Way Overview
Investing the tastytrade Way OverviewInvesting the tastytrade Way Overview
Investing the tastytrade Way Overview
 
How To Build A Strong Forex Foundation
How To Build A Strong Forex FoundationHow To Build A Strong Forex Foundation
How To Build A Strong Forex Foundation
 
Janis urste become a more profitable forex trader with these tips
Janis urste  become a more profitable forex trader with these tipsJanis urste  become a more profitable forex trader with these tips
Janis urste become a more profitable forex trader with these tips
 
Conventional Investing vs. Investing the tastytrade Way
Conventional Investing vs. Investing the tastytrade WayConventional Investing vs. Investing the tastytrade Way
Conventional Investing vs. Investing the tastytrade Way
 
Chooing a Broker
Chooing a BrokerChooing a Broker
Chooing a Broker
 
101 money secrets
 101 money secrets 101 money secrets
101 money secrets
 
Share Buybacks - What You Need To Know
Share Buybacks - What You Need To KnowShare Buybacks - What You Need To Know
Share Buybacks - What You Need To Know
 
Investors guide to trading
Investors guide to tradingInvestors guide to trading
Investors guide to trading
 
Should You Invest in Shorted Stocks?
Should You Invest in Shorted Stocks?Should You Invest in Shorted Stocks?
Should You Invest in Shorted Stocks?
 
Millionaire Trader 2018 Vince Stanzione
Millionaire Trader 2018 Vince StanzioneMillionaire Trader 2018 Vince Stanzione
Millionaire Trader 2018 Vince Stanzione
 
Trading the Forext Market by Vince Stanzione for Deriv.com
Trading the Forext Market by Vince Stanzione for Deriv.comTrading the Forext Market by Vince Stanzione for Deriv.com
Trading the Forext Market by Vince Stanzione for Deriv.com
 
The Value Firm
The Value FirmThe Value Firm
The Value Firm
 
How to pick your first winning Forex trade
How to pick your first winning Forex tradeHow to pick your first winning Forex trade
How to pick your first winning Forex trade
 
Penny stock alerts
Penny stock alertsPenny stock alerts
Penny stock alerts
 
Top 8 share trading tips for successful traders
Top 8 share trading tips for successful tradersTop 8 share trading tips for successful traders
Top 8 share trading tips for successful traders
 
Discover the secret to currency profits today!
Discover the secret to currency profits today!Discover the secret to currency profits today!
Discover the secret to currency profits today!
 

Ähnlich wie Thinkmoney 2014 summer

Introduction to financial spread betting
Introduction to financial spread bettingIntroduction to financial spread betting
Introduction to financial spread betting
Made To Trade
 
What is the otc market how to trade to make good profits
What is the otc market   how to trade to make good profitsWhat is the otc market   how to trade to make good profits
What is the otc market how to trade to make good profits
HuangLG88
 

Ähnlich wie Thinkmoney 2014 summer (20)

Everything you need to know about Synthetic Indices Vince Stanzione for Deriv...
Everything you need to know about Synthetic Indices Vince Stanzione for Deriv...Everything you need to know about Synthetic Indices Vince Stanzione for Deriv...
Everything you need to know about Synthetic Indices Vince Stanzione for Deriv...
 
How To Trade Stocks with Deriv.com
How To Trade Stocks with Deriv.comHow To Trade Stocks with Deriv.com
How To Trade Stocks with Deriv.com
 
Jse introduction to copy trade
Jse introduction to copy tradeJse introduction to copy trade
Jse introduction to copy trade
 
Jse introduction to copy trade
Jse introduction to copy tradeJse introduction to copy trade
Jse introduction to copy trade
 
Introduction to financial spread betting
Introduction to financial spread bettingIntroduction to financial spread betting
Introduction to financial spread betting
 
10 Chart Patterns every pro trader should know Deriv.com Vince Stanzione
10 Chart Patterns every pro trader should know Deriv.com Vince Stanzione10 Chart Patterns every pro trader should know Deriv.com Vince Stanzione
10 Chart Patterns every pro trader should know Deriv.com Vince Stanzione
 
What is the otc market how to trade to make good profits
What is the otc market   how to trade to make good profitsWhat is the otc market   how to trade to make good profits
What is the otc market how to trade to make good profits
 
Ez trader ebook
Ez trader ebookEz trader ebook
Ez trader ebook
 
Binary Trading Australia
Binary Trading AustraliaBinary Trading Australia
Binary Trading Australia
 
Introduction to stockbroking
Introduction to stockbrokingIntroduction to stockbroking
Introduction to stockbroking
 
Forex Fortunes Guide.
Forex Fortunes Guide.Forex Fortunes Guide.
Forex Fortunes Guide.
 
Forex secrets
Forex secrets Forex secrets
Forex secrets
 
Binary Options Tools
Binary Options ToolsBinary Options Tools
Binary Options Tools
 
Quantum Securities eBook 2015
Quantum Securities eBook 2015Quantum Securities eBook 2015
Quantum Securities eBook 2015
 
Things to avoid when trading crypto
Things to avoid when trading cryptoThings to avoid when trading crypto
Things to avoid when trading crypto
 
Winning Strategies to Trade Synthetic Indices By Vince Stanzione author of Ho...
Winning Strategies to Trade Synthetic Indices By Vince Stanzione author of Ho...Winning Strategies to Trade Synthetic Indices By Vince Stanzione author of Ho...
Winning Strategies to Trade Synthetic Indices By Vince Stanzione author of Ho...
 
Hybrid Pitch TH
Hybrid Pitch THHybrid Pitch TH
Hybrid Pitch TH
 
Hybrid System
Hybrid SystemHybrid System
Hybrid System
 
trading
tradingtrading
trading
 
Highly Converting Forex Product
Highly Converting Forex ProductHighly Converting Forex Product
Highly Converting Forex Product
 

Kürzlich hochgeladen

FOREX FUNDAMENTALS: A BEGINNER'S GUIDE.pdf
FOREX FUNDAMENTALS: A BEGINNER'S GUIDE.pdfFOREX FUNDAMENTALS: A BEGINNER'S GUIDE.pdf
FOREX FUNDAMENTALS: A BEGINNER'S GUIDE.pdf
Cocity Enterprises
 
Law of Demand.pptxnnnnnnnnnnnnnnnnnnnnnnnnnnnnnnnnnnnnnnnnnnn
Law of Demand.pptxnnnnnnnnnnnnnnnnnnnnnnnnnnnnnnnnnnnnnnnnnnnLaw of Demand.pptxnnnnnnnnnnnnnnnnnnnnnnnnnnnnnnnnnnnnnnnnnnn
Law of Demand.pptxnnnnnnnnnnnnnnnnnnnnnnnnnnnnnnnnnnnnnnnnnnn
TintoTom3
 
Abortion pills in Saudi Arabia (+919707899604)cytotec pills in dammam
Abortion pills in Saudi Arabia (+919707899604)cytotec pills in dammamAbortion pills in Saudi Arabia (+919707899604)cytotec pills in dammam
Abortion pills in Saudi Arabia (+919707899604)cytotec pills in dammam
samsungultra782445
 
+97470301568>>buy weed in qatar,buy thc oil in qatar doha>>buy cannabis oil i...
+97470301568>>buy weed in qatar,buy thc oil in qatar doha>>buy cannabis oil i...+97470301568>>buy weed in qatar,buy thc oil in qatar doha>>buy cannabis oil i...
+97470301568>>buy weed in qatar,buy thc oil in qatar doha>>buy cannabis oil i...
Health
 
abortion pills in Jeddah Saudi Arabia (+919707899604)cytotec pills in Riyadh
abortion pills in Jeddah Saudi Arabia (+919707899604)cytotec pills in Riyadhabortion pills in Jeddah Saudi Arabia (+919707899604)cytotec pills in Riyadh
abortion pills in Jeddah Saudi Arabia (+919707899604)cytotec pills in Riyadh
samsungultra782445
 

Kürzlich hochgeladen (20)

Avoidable Errors in Payroll Compliance for Payroll Services Providers - Globu...
Avoidable Errors in Payroll Compliance for Payroll Services Providers - Globu...Avoidable Errors in Payroll Compliance for Payroll Services Providers - Globu...
Avoidable Errors in Payroll Compliance for Payroll Services Providers - Globu...
 
劳伦森大学毕业证
劳伦森大学毕业证劳伦森大学毕业证
劳伦森大学毕业证
 
Mahendragarh Escorts 🥰 8617370543 Call Girls Offer VIP Hot Girls
Mahendragarh Escorts 🥰 8617370543 Call Girls Offer VIP Hot GirlsMahendragarh Escorts 🥰 8617370543 Call Girls Offer VIP Hot Girls
Mahendragarh Escorts 🥰 8617370543 Call Girls Offer VIP Hot Girls
 
FOREX FUNDAMENTALS: A BEGINNER'S GUIDE.pdf
FOREX FUNDAMENTALS: A BEGINNER'S GUIDE.pdfFOREX FUNDAMENTALS: A BEGINNER'S GUIDE.pdf
FOREX FUNDAMENTALS: A BEGINNER'S GUIDE.pdf
 
Seeman_Fiintouch_LLP_Newsletter_May-2024.pdf
Seeman_Fiintouch_LLP_Newsletter_May-2024.pdfSeeman_Fiintouch_LLP_Newsletter_May-2024.pdf
Seeman_Fiintouch_LLP_Newsletter_May-2024.pdf
 
Stock Market Brief Deck (Under Pressure).pdf
Stock Market Brief Deck (Under Pressure).pdfStock Market Brief Deck (Under Pressure).pdf
Stock Market Brief Deck (Under Pressure).pdf
 
Law of Demand.pptxnnnnnnnnnnnnnnnnnnnnnnnnnnnnnnnnnnnnnnnnnnn
Law of Demand.pptxnnnnnnnnnnnnnnnnnnnnnnnnnnnnnnnnnnnnnnnnnnnLaw of Demand.pptxnnnnnnnnnnnnnnnnnnnnnnnnnnnnnnnnnnnnnnnnnnn
Law of Demand.pptxnnnnnnnnnnnnnnnnnnnnnnnnnnnnnnnnnnnnnnnnnnn
 
Abortion pills in Saudi Arabia (+919707899604)cytotec pills in dammam
Abortion pills in Saudi Arabia (+919707899604)cytotec pills in dammamAbortion pills in Saudi Arabia (+919707899604)cytotec pills in dammam
Abortion pills in Saudi Arabia (+919707899604)cytotec pills in dammam
 
Technology industry / Finnish economic outlook
Technology industry / Finnish economic outlookTechnology industry / Finnish economic outlook
Technology industry / Finnish economic outlook
 
fundamentals of corporate finance 11th canadian edition test bank.docx
fundamentals of corporate finance 11th canadian edition test bank.docxfundamentals of corporate finance 11th canadian edition test bank.docx
fundamentals of corporate finance 11th canadian edition test bank.docx
 
+97470301568>>buy weed in qatar,buy thc oil in qatar doha>>buy cannabis oil i...
+97470301568>>buy weed in qatar,buy thc oil in qatar doha>>buy cannabis oil i...+97470301568>>buy weed in qatar,buy thc oil in qatar doha>>buy cannabis oil i...
+97470301568>>buy weed in qatar,buy thc oil in qatar doha>>buy cannabis oil i...
 
Test bank for advanced assessment interpreting findings and formulating diffe...
Test bank for advanced assessment interpreting findings and formulating diffe...Test bank for advanced assessment interpreting findings and formulating diffe...
Test bank for advanced assessment interpreting findings and formulating diffe...
 
cost-volume-profit analysis.ppt(managerial accounting).pptx
cost-volume-profit analysis.ppt(managerial accounting).pptxcost-volume-profit analysis.ppt(managerial accounting).pptx
cost-volume-profit analysis.ppt(managerial accounting).pptx
 
abortion pills in Jeddah Saudi Arabia (+919707899604)cytotec pills in Riyadh
abortion pills in Jeddah Saudi Arabia (+919707899604)cytotec pills in Riyadhabortion pills in Jeddah Saudi Arabia (+919707899604)cytotec pills in Riyadh
abortion pills in Jeddah Saudi Arabia (+919707899604)cytotec pills in Riyadh
 
Collecting banker, Capacity of collecting Banker, conditions under section 13...
Collecting banker, Capacity of collecting Banker, conditions under section 13...Collecting banker, Capacity of collecting Banker, conditions under section 13...
Collecting banker, Capacity of collecting Banker, conditions under section 13...
 
20240419-SMC-submission-Annual-Superannuation-Performance-Test-–-design-optio...
20240419-SMC-submission-Annual-Superannuation-Performance-Test-–-design-optio...20240419-SMC-submission-Annual-Superannuation-Performance-Test-–-design-optio...
20240419-SMC-submission-Annual-Superannuation-Performance-Test-–-design-optio...
 
NO1 Verified Online Love Vashikaran Specialist Kala Jadu Expert Specialist In...
NO1 Verified Online Love Vashikaran Specialist Kala Jadu Expert Specialist In...NO1 Verified Online Love Vashikaran Specialist Kala Jadu Expert Specialist In...
NO1 Verified Online Love Vashikaran Specialist Kala Jadu Expert Specialist In...
 
Significant AI Trends for the Financial Industry in 2024 and How to Utilize Them
Significant AI Trends for the Financial Industry in 2024 and How to Utilize ThemSignificant AI Trends for the Financial Industry in 2024 and How to Utilize Them
Significant AI Trends for the Financial Industry in 2024 and How to Utilize Them
 
falcon-invoice-discounting-unlocking-prime-investment-opportunities
falcon-invoice-discounting-unlocking-prime-investment-opportunitiesfalcon-invoice-discounting-unlocking-prime-investment-opportunities
falcon-invoice-discounting-unlocking-prime-investment-opportunities
 
logistics industry development power point ppt.pdf
logistics industry development power point ppt.pdflogistics industry development power point ppt.pdf
logistics industry development power point ppt.pdf
 

Thinkmoney 2014 summer

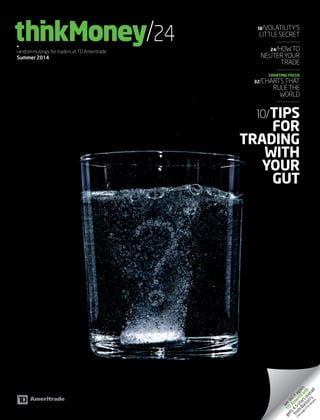
  • 1. thinkMoney/24 • random musings for traders at TD Ameritrade Summer 2014 18/VOLATILITY’S LITTLE SECRET 24/HOW TO NEUTER YOUR TRADE CHARTING FOCUS 32/CHARTS THAT RULE THE WORLD 10/TIPS FOR TRADING WITH YOUR GUT Ameritrade again. it overall did We stars Barron's. TD 4.5 gets from (See page 9 for details)
  • 2. WHERE DIVERSIFICATION LEAPS ACROSS BORDERS Welcome to FX Options From NASDAQ OMX Now individual investors can diversify their portfolios with FX Options from NASDAQ OMX. Trade on global economic and political events via spot FX Options in your existing options account and receive U.S. dollar settlement. © 2014, NASDAQ OMX GROUP, INC. ALL RIGHTS RESERVED. LEARN MORE AT NASDAQTRADER.COM/FXOPTIONS OR CALL +1 215 496 5550
  • 3.
  • 4. thinkMoney/24 •04 • Contents • Photograph by Fredrik Brodén • tdameritrade.com
  • 5. p. 10 Trading With A Sour Stomach In bull markets, sometimes logic goes out the window. So the next time your gut is telling you to get into a trade despite your rules, pick a strategy that tempers your enthusiasm.
  • 6. iShares Silver Trust ETF. For traders with mettle. For many traders, liquidity is an important part of an overall investment strategy. iShares Silver Trust ETF was created with that in mind. Unlike physical silver, it’s easier to buy and sell — making it an option for investors who seek to maximize returns over the short term. Plus, it’s low-cost, so like other iShares ETFs, it can help you keep more of what you earn. For details, visit iShares.com/silver ADVERTISEMENT SLV iShares Silver Trust Investing involves risk, including possible loss of principal. The iShares Silver Trust (SLV or the “Trust”) is not an investment company registered under the Investment Company Act of 1940 or a commodity pool for purposes of the Commodity Exchange Act. Shares of SLV are not subject to the same regulatory requirements as mutual funds. Because shares of SLV are intended to reflect the price of the silver held by the Trust, the market price of the shares is subject to fluctuations similar to those affecting silver prices. SLV has filed a registration statement (including a prospectus) with the SEC for the offering to which this communication relates. Before you invest, you should read the prospectus and other documents the Trust has filed with the SEC for more complete information about the issuer and this offering. You may get these documents for free by visiting www.iShares.com or EDGAR on the SEC website at www.sec.gov. Alternatively, the Trust will arrange to send you the prospectus if you request it by calling toll-free 1-800-474-2737. There can be no assurance that an active trading market for shares of SLV will develop or be maintained. Buying and selling shares of ETFs will result in brokerage commissions. BlackRock Asset Management International Inc. (“BAMII”) is the sponsor of the Silver Trust. BlackRock Investments, LLC (“BRIL”), assists in the promotion of the Silver Trust. BAMII and BRIL are affiliates of BlackRock, Inc. (together with its affiliates, “BlackRock”). ©2014 BlackRock. All rights reserved. iSHARES and BLACKROCK are registered trademarks of BlackRock. All other marks are the property of their respective owners. iS-11612-0214
  • 7. thinkMoney/24 •07 • Contents • Cover photograph by Fredrik Brodén • tdameritrade.com Miscellaneous Features 10/ Trading With A Sour Stomach No matter how many rules you strictly follow, there’s going to come a time when you just have to trust your gut on a bullish trade. But depend-ing on how confident you are, you can tweak the downside risk to help you sleep better. 18/ News For Show, Vol For Dough Headlines may come and go. But the volatility resulting from headlines is what can matter most to traders. And before you write off higher-volatility markets, here’s a little secret you ought to know. 24/How To Neuter Your Trade At some point you may have heard an option trader boast about being a “delta neutral” or “market-neutral” trader. But what do these terms mean and are they really useful? Let’s put the debate to rest. 08/A Quick Howdy 15/Love Notes Columns 16/News + Views Retail options trading is caught in the crossfire of Congress-man Camp’s tax pro-posal. Should you be worried? +Ask the Suit 28/Gear Head Today’s cool tool two-fer: A Dow-to-gold script from TD Ameritrade’s “Mr. Script” and how to share a chart with your loved ones. 42/The Token Glossary 32/ Special Focus: Charting for Everyone CHARTS THAT RULE THE WORLD No doubt you can find lots of charting programs out there. But seriously, why look further? Other than a back massage, thinkorswim® Charts can give you almost anything you need—even if you’re not a chart reader. PLUS: THINKORSWIM CHARTS Q+A 38/Capiche? If you’re buying ETFs that track futures like oil and volatility, beware of the “rolling penalty” that could be stealing your profits. TD Ameritrade Contact Info You Could Use Client Services Representative: 800-669-3900 New Accounts: 800-454-9272 • thinkorswim Support: 800-672-2098 thinkorswim@tdameritrade.com Platform Feedback: thinkorswimfeedback@tdameritrade.com Tech Support: thinkorswimtechsupport@tdameritrade.com paperMoney Support: thinkorswimpapermoney@tdameritrade.com For all other inquiries: tdameritrade.com/contact-us • General Mailing Address 200 S. 108th Ave Omaha, NE 68154 • Follow TD Ameritrade 31 /The Spotlight Fun guy Mike Barwacz is making sure your Trading Desk confidant at TD Ameritrade has what it takes to answer your tough questions. And he can show you a good time doing it. And follow thinkorswim on Twitter, too: @thinkorswim BACK ISSUES OF THINKMONEY! To view past issues of thinkMoney, hop on over to tdameritrade.com/thinkmoney. You'll be glad you did. 22/Evolution of the Trader If you thought trading started under a but-tonwood tree, you’d be wrong. Think mon-keys, Darwin, and opposable thumbs. 40/Ask the Trader Guy Our resident guru responds to why all options aren’t created equal, how to size up your vertical spread, and false promises from a dumb clairvoyant. cont.
  • 8. make a huge difference in your probability of success, depending on how confident you are. And this is where gut meets science. In this month’s cover feature, “Trading on a Sour Stomach” (page 10), we’ll show you whether the difference between feeling a “sure thing” or just “meh” could dictate which strat-egy you may want to consider for a given trade. But suppose you don’t already have a system, and you’re just discovering the thinkorswim® trading platform for the first time. Continuing our Special Focus on the finer tools of the platform, we’ll dive into thinkorswim Charts (starting on page 32). Serving up nothing less than the kitchen sink, the Charts page has tools from which even the “I don’t use charts” trader could benefit. And of course, after you’ve pulled the trigger and entered a trade, at some point, you’ll find yourself in one of two situa-tions— facing a loss or staring at a profit—and not sure what to do next. “How to Neuter Your Trade” on page 24 is a must-read for you nail-biters that could pro-vide some relief. It’s been said that trading can be traced back to our simian ancestors. As Trader Erectus once wrote on his cave wall while contemplating his next Paleo snack, “mmfph”—which was later translated to “Buy spar-ingly and sell often.” We agree. Happy trading! Kevin Lund, Editor-in-Chief, thinkMoney thinkMoney/24 •08 • A Quick Howdy • tdameritrade.com thinkMoney® EDITOR-IN-CHIEF Kevin Lund EDITOR Thomas Preston ASSISTANT EDITOR Eileen Sutton ART DIRECTOR Tom Brown DESIGNER Jennifer Roberts • CONTRIBUTING WRITERS Nicole Sherrod John Brodemus Chesley Spencer Kira Brecht Greg Loehr David Kier CHIEF PHOTOGRAPHER Fredrik Brodén CONTRIBUTING ILLUSTRATOR Joe Morse • PUBLISHER T3 Custom Email: info@t3publishing.com www.t3publishing.com PHOTOGRAPH: FREDRIK BRODÉN Me Go Trade Let’s face it. No matter how impressively automated your trading system is—custom scans, charts, half-eaten Twinkies—at the end of the day, it’s really an educated guess where the stock you’re coveting is going next. Though your indicators all point to up or down, you don’t really know for sure—which means your level of confidence in the trade sits on a spectrum. Of sorts. In other words, it’s more of a data-driven gut feeling that ulti-mately drives your decisions. You may know which stock you want to trade. But choosing the right option strategy could edit GOT FEEDBACK? Talk to us about thinkMoney! Take our survey and you’ll qualify for infinite brownie points. tdameritrade.com/ tmsurveyor write to us atthinkmoney@ tdameritrade.com
  • 9. important info • The information presented in this publication does not consider your personal investment objectives or financial situation; therefore, this publication does not make personalized recommendations. This information should not be construed as an offer to sell or a solicita-tion to buy any security. The investment strategies or the securities may not be suitable for you. Any and all opinions expressed in this publication are subject to change without notice. • Options transactions involve complex tax considera-tions that should be carefully reviewed prior to entering into any transaction. • The risk of loss in trading securities, options, futures and forex can be substantial. Clients must consider all relevant risk factors, including their own personal finan-cial situations, before trading. Options involve risk and are not suitable for all investors. See the Options Disclo-sure Document: Characteristics and Risks of Standard-ized Options. A copy accompanies this magazine if you have not previously received one. Additional copies can be obtained at tdameritrade.com or by contacting us. • Trading foreign exchange on margin carries a high level of risk, as well as its own unique risk factors. Before con-sidering trading this product, please read the Forex Risk Disclosure, available at http://www.nfa.futures.org /NFA-investor-information/publication-library/forex.pdf. • A forex dealer can be compensated via commission and/or spread on forex trades. TD Ameritrade is subse-quently compensated by the forex dealer. • Futures and forex accounts are not protected by the Securities Investor Protection Corporation (SIPC). TD Ameritrade, Inc. Member SIPC FINRA NFA TD Ameritrade is a trademark jointly owned by TD Ameritrade IP Company, Inc. and The Toronto-Dominion Bank. ©2014 TD Ameritrade IP Company, Inc. All rights reserved. Used with permis-sion. Product and company names mentioned herein may be trademarks and/or registered trademarks of their respective companies. thinkMoney/24 •09 • Disclaimers • tdameritrade.com • Neither Investools® nor its educational sub-sidiaries nor any of their respective officers, per-sonnel, representatives, agents or independent contractors are, in such capacities, licensed financial advisors, regis-tered investment advisors or registered broker/deal-ers. Neither Investools nor such educational subsidiaries provide investment or financial advice or make invest-ment recommendations, nor are they in the busi-ness of transacting trades, nor do they direct client futures accounts nor give futures trading advice tailored to any particula r client’s situa-tion. Nothing contained in this communication constitutes a solicitation, recommendation, promotion, endorsement or offer by Investools or others described herein, of any particular security, transaction, or invest-ment. Investools Inc. and TD Ameritrade, Inc. are separate but affili-ated companies that are not responsible for each other’s services or policies. 3 Transaction costs (com-missions and other fees) are important factors and should be considered when evaluating any options trade. For simplic-ity, the examples in these articles do not include transaction costs. At TD Ameritrade, the standard commission for online equity orders is $9.99, online option orders are $9.99 + $0.75 per con-tract. Orders placed by other means will have higher transaction costs. Options exercises and assignments will incur a $19.99 commission. TD Ameritrade was evaluated against 19 others in the 2014 Barron's Online Broker Review, March 15, 2014, and was awarded 4.5 stars overall (along with 3 others). The firm was ranked 1st in the categories “Best for Long-Term Investing” and “Best for Novices.” TD Ameritrade was also among those listed in the categories Best for Frequent Traders (ranked 4th), Best for Options Traders (ranked 2nd) and Best for In-Person Service (ranked 5th). Star ratings are out of a possible 5. Barron’s is a trademark of Dow Jones. L.P. All rights reserved.
  • 10. thinkMoney/24 • 10 • Gut-Trading Strategies • tdameritrade.com I N T H E W O R L D of numbers and analy-sis, a gut feeling can seem squishy and out of place. But with trading and investing, there’s no denying that our gut instinct can often help. It can make us confident or wary, no matter the analy-sis we used to determine a bullish or bearish direc-tional bias. And for the record, it’s not that our analysis is wrong. It’s just that our gut remembers past winners and losers and a different part of the brain engages. It’s right brain vs. left brain. In a word, our gut can provide a reality check. • Now, some traders might use their gut as a “go, no-go” indicator. The “go” is all in with long stock, for example. The “no-go” is sit on your hands and do nothing. But there’s a smarter approach that may help fine-tune your trad-ing instincts. Figure out whether your gut is mak-ing you slightly confident, semi-confident, or very confident in your bias. Let’s look at a few bullish strategies that may match what your gut might NO MATTER HOW MANY TRADING SYSTEMS YOU TRY, THERE’S GOING TO COME A TIME WHEN YOU JUST HAVE TO TRUST YOUR GUT ON A BULLISH TRADE. BUT DEPENDING ON HOW CONFIDENT YOU ARE, YOU CAN TWEAK THE DOWNSIDE RISK TO HELP YOU SLEEP A LITTLE BETTER AT NIGHT. suggest. TRADING WITH A SOUR STOMACH WORDS BY THOMAS PRESTON
  • 11.
  • 12. thinkMoney/24 • 12 • Gut-Trading Strategies • Photograph by Fredrik Brodén • tdameritrade.com THE SORT-OF-CONFIDENT BULLISH TRADE SHORT, OUT-OF-THE-MONEY PUT VERTICAL When looking at a stock, you might believe it will go up—at least that’s what your analysis is telling you. But your gut isn’t quite as psy-ched about it. It’s telling you that the stock might not go up, and might drop. Since the out-of-the-money (OTM) put vertical has a defined max loss and defined max profit, it might be an appropriate strategy when you’re sort of confident in the direction you think the underly-ing will go. A bullish short OTM put vertical is made up of a short OTM put, and a long OTM put that’s further OTM than the short put. This trade is designed to pro-duce a credit, which is the max profit the trade can make(less transaction costs). The max loss is the dif-ference Short Put Vertical STOCK PRICE Short Strike Profit Loss Long Strike between the strikes minus that credit (plus + BREAKEVEN _ transaction costs). What the short OTM put vertical does is potentially profit not only if the stock rallies, but also if it sits at its current price, or even drops a bit. More than a bit would mean the stock drops below the short strike plus the credit received, in order to incur a loss. As long as the price of the stock is higher than the strike price of the short put at the expiration of the options, this position can be profitable. A long stock position, for example, can’t do that. If the price of the stock doesn’t go up, or drops, the long stock position isn’t profitable (not counting possible dividends). The short put vertical can also have a lower margin requirement than long stock. That means you don’t need to tie up a lot of your trading capital in a sort-of-confident trade. THE SEMI-CONFIDENT BULLISH TRADE NAKED, SHORT OUT-OF-THE-MONEY PUT Huh? a naked short option if you’re only semi-confident? That may sound risky, but hey, at thinkMoney, we don’t flinch. A short OTM put takes in a credit (the premium received for selling the put), which is its max potential profit (less transaction costs). The max potential loss is the strike price of the + BREAKEVEN _ Short Put put minus the credit you realize for selling it. That’s the loss that would occur if the price of the stock goes to zero. And it’s that large potential loss that might be raising eyebrows for the semi-confident trader. The strategy also includes a high risk of purchasing the underlying stock at the strike price when the market price of the stock will likely be lower. But think about it. The short put has no more risk than long stock. The losses for both are large if the price of the stock drops sharply, let alone goes to zero. But here’s an advantage for the short OTM put—the price of the stock can sit where it is, or even drop a bit by expira-tion, and the short OTM put can still be profitable. Long stock can’t do that (save, for possible dividends). A short OTM put also has no greater margin requirement than long stock. In a margin account, the margin on a short put can be lower than on long stock, and in an IRA, the margin on a cash-secured short-put position and a long stock position can be roughly the same. The short OTM put and the short OTM put vertical share some characteristics. So, what makes the short OTM put the choice for the semi-confident trade? The short OTM put can have a higher credit than a short-put vertical, and thus larger potential profit. If the short put of the short-put vertical and the short put are at the same OTM strike price and same expiration, the credit for the short OTM put vertical will be lower than the credit for the short-put. The difference is the cost of the long-put component of the short-put vertical. The short put gives you potentially more profit than a short-put vertical in exchange for a higher margin requirement and higher potential risk. That’s why it may be a choice if you’re a bit more confident in your bullish bias. FIGURE 1: Short OTM put vertical. A smaller potential reward with higher probability of success than long verticals, when you’re feeling so-so about the direction of the underlying. For illustrative purposes only. FIGURE 2: Short OTM put. Wee bit bigger potential reward, lots more risk. Still a higher probability of success than a long vertical posi-tion, since you could potentially make money even if the stock stands still. For illustrative purposes only. STOCK PRICE Profit Loss Short Strike
  • 13. THE CONFIDENT BULLISH TRADE LONG, AT-THE-MONEY CALL VERTICAL A long at-the-money (ATM) call vertical could be the choice as a “very confident” trade. A bullish long ATM call vertical is made up of a long slightly, in-the-money (ITM) call and a short OTM call in the same expiration. You pay a debit when you do this trade, and the debit of the long ATM vertical is its max possible loss. The max potential profit is the difference between the strike prices, minus the debit paid, including transaction costs, and occurs when the stock price is higher than the strike price of the short OTM call at expiration. That means the price of the stock has to go higher for the ATM vertical to profit. It can’t just stay at the same price or drop, like it can for the short OTM put, or short OTM put vertical. If the stock drops, the long ATM vertical will likely lose some money, and the max loss happens when the price of the stock drops below the strike price of the long call at expiration. The long ATM call vertical may be a confident choice because it can have a higher delta than an OTM short put vertical, or even a short put—meaning, it can be more responsive to a rise in the stock price. But if you’re so confident, why not just buy stock, or a long call for that matter? Neither caps your upside poten-tial, so why choose it? Compared to long stock, the long ATM call vertical can have less potential risk, for one. Nothing is guar-anteed to go higher. If the stock does drop sharply, the loss on the long stock can be much greater than on the long vertical. Also, the long ATM call vertical can have a lower margin requirement than long stock. That means that you tie up less of your trading capital with verticals. Compared to a long call, the long ATM vertical can be less sensitive to changes in volatil-ity (vega) and time (theta), because the vertical has both a long and short option in it. The negative vega in the short option offsets the positive vega in the long option, resulting in a net-lower vega than a single long option. Likewise, the neg-ative theta of the long option is offset by the positive theta of the short option, resulting in a net-lower time decay than a single long option. Important Information THE KEY IS UNDERSTANDING THAT YOUR GUT drives strategy, not trade size. The smart way to imple-ment confident analysis is with a strategy that not only reflects that confidence, but also can have lower risk, lower margin requirements, and opportunity to profit if you’re directional bias proves wrong. Remember, your gut gets you in the game. Your brain hopefully gets you paid. SEE GLOSSARY PAGE 42 + BREAKEVEN _ Long ATM Call Vertical STOCK PRICE Loss Long Strike Short Strike Profit FIGURE 3: Long ATM call vertical. The lowest probability of success among the three strategies discussed here, but the greatest possible reward when you’re feeling warm and fuzzy about the direction of the trend. For illustrative purposes only. Naked option strate-gies involve the high-est amount of risk and are only appro-priate for traders with the highest risk tolerance. Spreads and other multiple-leg option strategies can entail substan-tial transaction costs, including mul-tiple commissions, which may impact any potential return. Supporting docu-mentation for any claims, comparison, statistics, or other technical data will be supplied upon request. BEFORE YOU GUT Find trades your gut feels good about. Fire up thinkorswim's "MOST ACTIVES" lists to get some ideas. From the MarketWatch tab, go to the Quotes sub-tab. Click the little gear icon to the far right to see a menu of pre-defined lists, such as "Lovers and Losers" and "Top 10," featuring the day's hits and misses.
  • 14. Kyle S. thinkorswim® user Nicole “The Suit” Sherrod @TDANSherrod Managing Director, Trading Access granted. Get an exclusive look into how “The Suit” uses thinkorswim. With the new sharing feature in thinkorswim, you’ll discover how our experts use the platform and which tools they rely on most. You can also generate new ideas and share your platform setup with friends, followers, and the myTrade® community. Explore thinkorswim sharing: tdameritrade.com/shareyourtos myTrade is a service of myTrade, Inc., a separate but af iated rm. TD Ameritrade is not responsible for the services of myTrade, or content shared through the service. TD Ameritrade, Inc., member FINRA/SIPC/NFA. TD Ameritrade is a trademark jointly owned by TD Ameritrade IP Company, Inc. and The Toronto-Dominion Bank. © 2014 TD Ameritrade IP Company, Inc. All rights reserved. Used with permission.
  • 15. THE TWEETS • @TDANSherrod: Today I’m working on our 2015 Strategic Plan. And I’m putting the things that my Twitter follow-ers ask for FIRST. • @NewShoesHere: Does the Strategic Plan include how to play pocket Aces under the gun? ☺ • @TDANSherrod: No but it does include a new tab called “High Probability Racehorse Hand-icapping.” • @MichaelComeau: Please add Pac-Man to the thinkorswim platform. I will trade more, I swear. • @TDANSherrod: We already have Tetris. And Mine Sweeper. • @MichaelComeau: Yes—but Pac-Man is a must. Come on, I’m not asking for Ms. Pac-Man here. • @panthersfan1234: @JaviFusco Since you made it into a magazine, now you’re never gonna shut up. Thanks a lot, @TDANSherrod… :D DA QUIPS • On trading vanity It is quite possible that I just might be the best looking day-trader in all of Alabama, if not the world. Joe • On take-backs There are no Mulligans in trading. Pat • On disruptive technology I want a driverless car...so I can text while driving. Brendan • On domestic finances If your husband defaults on you, you can always execute a swap. Francine • On electric-car drawbacks Tesla. Where gas stations don’t know your name. Sam • On inter-market analysis I think Justin Bieber got arrested again. Not yet sure what impact it will have on crude. Jack • On pragmatism The Millionaire Next Door is not trading the VIX, but he is wearing four sets of clothing on the plane. Stacey • On predictive analysis Forecasting is the art of saying what will happen and then explaining why it didn't. Skip • One from a famous dude: If past history was all there was to the game, the richest people would be librarians. Warren Buffet thinkMoney/24 •15 • Love Notes • Sweet tweets and quick quips from all of us • Photograph by Fredrik Brodén Follow the “experts” on Twitter for all things markets, trading, and thinkorswim: @TDANSherrod @TDAJJKinahan @thinkorswim Important Information These comments are excerpts from chat rooms, emails, and tweets submitted by TD Ameritrade clients, and their views may not reflect those of TD Ameritrade. Testimonials may not be representative of the experience of other clients and are no guarantee of future performance or success. lttrs.
  • 16. thinkMoney/24 •16 • News+Views • A hodgepodge of stuff we thought you should know. • Photograph by Fredrik Brodén • tdameritrade.com Q: What’s new in the world of education at TD Ameritrade? Any new events coming up? A: Yes! Here’s a short list of some of the latest and greatest: Market Drive events. My work BFF, JJ Kinahan, hooked us up with some amazing sponsor part-ners this year so we can bring our TD Ameritrade Market Drive events to even more cities and to larger venues. (Thanks CME, BlackRock, Barclay’s, and CBOE!*) If you’re not familiar with these events, in a word, get off your der-rière and go. “In a city near you” you’ll get a day of royal treatment learning all kinds of thinkorswim® tips, as well as mingle with other trading fanatics. And, of course, you’ll be inducted into our trading “inner circle.” Find out more here:www.tdameritrade.com/ registerformarketdrive. thinkorswim Chat Rooms. Don’t forget about the great education going on daily in thinkorswim Chat Rooms. If you’re looking for some-thing topical it’s there, it’s color-ful, it’s unedited. And our “on air” talent keeps stepping up their col-lective games to drive even more impact from these events. Just fire up thinkorswim, and select Sup-port/ Chat in the upper right of the screen. Then select the Chat Rooms tab. And for the Ladies. Finally, there’s one other thing that we’re working on. You might not know this, but the readership of this esteemed publication skews to the male side. Yup, it’s a fact that women are not as invested as men. But we’re going to change all that. That’s right—developed by ladies for ladies, we’re launching new educational content designed to empower women to focus on building even greater wealth and investing savvy investing in the markets (tdameritrade.com/up). Why say it here? Because I want you to share a link with the women you care about—your sis-ters, daughters, friends, mothers, and yes, even wives. nws. FOLLOW THE SUIT Read more of Nicole’s musings on her own blog at tickertape-monthly. com/blog. Follow Nicole on Twitter: @TDANSherrod Ask The Suit • A little Q&A with Nicole Sherrod, Managing Director, Trader Group at TD Ameritrade *CME, BlackRock, Barclays, CBOE, and TD Ameritrade are separate and unaffiliated companies and are not responsible for each other's services or policies.
  • 17. toys Toys for Traders A few of our latest trading faves thinkorswim® TRADE FLASH This toy displays trade-related events as they happen— such as analyst up/downgrades, block trades, trade imbalances, events on the trading floor, and more. To trade on a “Flash,” just click on the symbol in the Trade Flash feed and you’ll be sent to the Trade tab. MY TOOLS Instead of scroung-ing around all the submenus for your favorite indicators or chart functions, this toy gives you easy access and one click for each of your faves. Apply it to one or all the charts, or just those detached. To turn on My Tools, bring up Chart Set-tings and look under the General tab, bot-tom right. ISE SPREAD BOOK This old tool has been turned back on to let you see all the working spread orders on the ISE that your peers are trading. Similar to the regular spread book, you can search for all types of spreads (verticals, butterflies, etc.) for any symbol traded there to analyze for your own purposes. Can I interest you in a little light reading? House Ways and Means Committee Chairman Dave Camp, a Michigan Republican, has issued a 979-page door stop called the “Tax Reform Act of 2014.” In his defense, an overly complex U.S. tax code requires noth-ing short of a beefy rewrite. And there among the fine print is the proposal he first pushed in Janu-ary 2012, a “mark-to- market” treatment of certain derivatives that will snag listed options that retail investors favor in the sweep-ing list of changes. Essentially, the pro-posal calls for mark-ing all derivatives to industry spotlight market in order to put a price on that investment, then tax it as income. This means investors would be required to pay taxes on gains, even if it’s an open posi-tion. The Act calls for treating the option, including buying a put, as if it were sold on the last business day of the year. Toss in straddles with a derivative, and non-derivative, offset-ting position — including stock that is not part of a qual-ified covered call — both sides would be marked to market. The aim is to clean up and clarify taxation and regula-tion of the increas-ingly complex suite of derivatives prod-ucts launched in the last decade. Guilty by association is the decades-old listed - options market. Options’ tax treat-ment has been “well-settled” for 30 years, argues the Options Industry Council. Other potential problems, according to tax-law firm Chapman and Cutler: Valuation of lightly traded deriv-atives; attempting to price as individ-ual products embedded deriva-tives whose “value” may depend on what happens with the entire trade; and perhaps most importantly, expect-ing investors to pony up taxes on money they don’t actually have in hand. Stay tuned. Camp has some bipartisan support, but the proposal faces a long road, especially in a mid-term election year that may give Con-gress a facelift. Pick-ing on retail derivatives is just the tip of the iceberg for a proposal that takes on individual and corporate tax rates, and many more complexities. For now, a red pen awaits its call. If it Ain’t Broke, Don’t Tax It Will a tax proposal that picks on retail option traders survive? • Words by Rachel Koning Beals Illustration by Joe Morse AND THERE AMONG THE FINE PRINT OF THE "TAX REFORM ACT OF 2014," MARK-TO-MARKET TREATMENT WILL SNAG LISTED OPTIONS THAT RETAIL INVESTORS FAVOR IN THE SWEEPING LIST OF CHANGES.
  • 18. thinkMoney/24 •18 • Volatility Secrets • tdameritrade.com VOL FOR DOUGH HEADLINES MAY COME AND GO. BUT VOLATILITY IN REACTION TO THOSE HEADLINES IS WHAT CAN MATTER MOST TO TRADERS. AND BEFORE YOU WRITE OFF HIGHER-VOLATILITY MARKETS, HERE’S A LITTLE SECRET YOU OUGHT TO KNOW. WORDS BY THOMAS PRESTON NEWS FOR SHOW,
  • 20. OUR TRADING DAYS good news, bad news, news you consider important, news you ignore. Of course, how you interpret news is up to you. But there’s no mistaking the one signal— implied volatility—that can tell us how the market itself feels about news. Simply put, implied vol meas-ures the magnitude of an index or stock’s potential price change. It goes up when the market is uncertain or fearful about what a headline might mean for future price changes, and down when news makes the market confident. Sometimes, though, market volatil-ity itself becomes news. And talking heads sound the alarm when the VIX— the Chicago Board Options Exchange (CBOE) volatility index—spikes higher. The VIX might not be reacting to news at all. But scary headlines about volatil-ity can make novice investors skittish and afraid to act. Sure, it’s a free country. And you can choose to trade or not, depending on your nervous system. But savvy traders understand that higher volatility may actually signal potential opportunities. In fact, veteran traders may use strate-gies that leverage the very thing that’s often scary to novices. How? Because they understand that when the VIX is higher, options premiums don’t just increase in lockstep. They do so expo-nentially. LEG BONE CONNECTED TO THE SHIN BONE Traders know the VIX is calculated using out-of-the-money (OTM) SPX options prices. Those prices move higher and the VIX goes up, when traders buy them as a hedge or speculation against a large SPX price change. When option prices move lower because traders are selling in expectation of smaller price changes, the VIX moves lower. The relationship is essentially mechanical. Traders may have an idea that short-option strategies like short straddles, for example, present opportunities when implied vol is higher, and wait for a higher VIX before they either open positions or increase position size. The higher the volatility, the higher the credit received for a short straddle—all other things like SPX price, strike price, and time to expiration being equal. That higher credit can mean higher potential profits and wider break-even points for a short strangle, which is why the strategy may be more attractive when volatility is higher. That said, short strategies in higher volatility environments pose great risk due to the wild swings that could drive a short option deep in the money very quickly. For that reason, you will always need to be aware of the increased risks as volatility increases, but as it does, how much higher is the credit? PUT TO THE TEST Let’s use some actual numbers for the dollar amount that a change in the VIX means to SPX prices. The dif-ference between the VIX at 14, and the VIX at 20, is due to SPX option prices. But how much higher are the SPX options when the VIX is at 20, than when it was at 14? A little bit higher, a lot higher, or somewhere in between? ARE FILLED WITH NEWS—
  • 21. To answer that, I did a little study using the thinkBack tool on the Analyze tab of thinkorswim®. thinkBack lets you look at end-of-day stock-and- option prices for every trading day going back to 2003. Set the date in the upper-right-hand corner to open up the stock and option prices for that date. It’s very handy for this type of analysis. I looked for trading For illustrative purposes only. Not a recommendation. days where the SPX prices were very close—only a few points difference —and where the expirations were the same number of days in the future. The dates I found were July 9, 2013, and October 8, 2013. That removed much of the influ-ence of the SPX price, and days to expiration on the prices of SPX options. The main reason for any differ-ence in the option prices would be volatility. So, same SPX price, same days to expiration. Only the VIX is dif-ferent. Here’s what I found: The table above is divided into two sections show-ing SPX options with nine days to expiration, and 37 days to expiration. The strike prices are down the mid-dle. On the left hand side are out-of-the-money SPX option prices, when the VIX was 14.50. On the right are out-of-the-money SPX option prices when the VIX was 20.34. The strike prices 1650 and lower, show SPX put prices, and the strike prices 1655 and higher, show SPX call prices. You want to look only at out-of-the-money options because their values are purely extrin-sic, and clearly illustrate the impact of higher and lower volatility on their prices. The VIX at 20.34 is 40% higher than the VIX at 14.50. You might think that the SPX option prices are higher by a similar amount but they’re not. In the case of the 1500 puts with 9 days to expiration, with the VIX at 14.50 they were .20. But with the VIX at 20.34 they were 1.35, or rather 6.5x greater. The 1500 puts with 37 days to expiration were 2.85 with the VIX at 14.50, but 7.55 with the VIX at 20.34—more than 2.5x greater. The 1650 puts with 9 days to expiration, which were closer to the money, were 13.00 with the VIX at 14.50, and 18.55 with the VIX at 20.34. That’s 1.4x higher, which is closer to the increase in the VIX. The 1650 puts with 37 days to expiration were 28.70 with the VIX at 14.50 and 37.30 with the VIX at 20.34. That’s about 1.3x higher. FOLLOW THE RISK This analysis illus-trates the actual pre-mium change for the SPX options that pushed the VIX from 14.50 to 20.34. And it’s important to under-stand that relation-ship. It’s not the VIX moving higher that makes the SPX option premiums go up. It’s the SPX option premi-ums that make the VIX go up. In fact, the SPX options moved up a larger percentage, depending on their dis-tance out of the money, than the VIX. The further out of the money the option was, the greater the percent-age price change. The closer to the money the option was, the smaller the percent price change. That means the VIX is really a shorthand for how much premium is available in SPX options. Because SPX options represent liquid and efficient markets, and they’re used to calculate the VIX, the VIX is a respon-sive indicator of potential market risk. This is one good reason traders ought to check the VIX daily, arguably giving it even more attention than underlying trends. Also, note the SPX was the same price, but the VIX was different, suggesting the SPX price itself isn’t nec-essarily an indication of fear or confidence. That infor-mation is packed into the prices of the SPX options, and makes the VIX a forward-looking indicator. DOES SELLING PREMIUM WHEN VOL IS HIGHER guarantee profits? Absolutely not. Is volatility the only thing to consider when trading? Nope. But this information is a kind of dollar validation for using volatility as a basis for a strategy. Arguably, you should be looking at the VIX even before looking at the price of S&P futures pre-market. For a well-capi-talized trader who is comfortable employing short-option strategies, the potential reward for keeping a sharp eye on the VIX can mean you potentially don’t make a little more. You can potentially make a lot more for the same level of risk. thinkMoney/24 •21 • Volatility Secrets • tdameritrade.com SEE GLOSSARY PAGE 42 JUL. 9/13 SPX 1652 VIX 14.50 OCT. 8/13 SPX 1655 VIX 20.34 JUL. 9/13 SPX 1652 VIX 14.50 OCT. 8/13 SPX 1655 VIX 20.34 9 DAYS TO EXPIRE 37 DAYS TO EXPIRE 2.85 4.00 5.65 8.70 12.90 19.75 28.70 14.55 6.35 2.70 .95 .55 .25 7.55 9.95 12.90 17.00 22.15 28.95 37.30 25.70 14.75 7.45 3.30 1.20 .60 1500 put 1525 put 1550 put 1575 put 1600 put 1625 put 1650 put 1675 call 1700 call 1725 call 1750 call 1775 call 1800 call .20 .25 .50 .95 2.15 5.25 13.00 3.60 .65 .15 .10 .05 .01 1.35 2.15 2.90 4.55 6.95 11.05 18.55 10.50 3.35 .95 .35 .10 .05 1500 put 1525 put 1550 put 1575 put 1600 put 1625 put 1650 put 1675 call 1700 call 1725 call 1750 call 1775 call 1800 call Important Information Naked option strategies involve the highest amount of risk and are only appropriate for traders with the highest risk tolerance. Backtesting is the evaluation of a particular trading strategy using historical data. Results presented in thinkBack are hypothetical, they did not actually occur and they may not take into consideration all transaction fees or taxes you would incur in an actual transaction. Past performance of a security or strategy does not guarantee future results or success. Results could vary significantly, and losses could result. Spreads and other multiple-leg option strategies can entail substantial transaction costs, including multiple commissions, which may impact any potential return. Supporting documentation for any claims, comparison, statistics, or other technical data will be supplied upon request.
  • 22. thinkMoney/24 •22 • The Centerfold • Illustration by Joe Morse 1st LEVEL: Calliputibus Volarensis OPPOSABLE THUMB CREATES ADVANTAGE OVER OTHER APES BY ALLOWING 5 LOTS EXTRA-LARGE FOREHEAD PERFECT FOR BEATING AGAINST TREE WHEN CLOVIS POINT TRADE GOES BAD UPRIGHT STATURE APPLIED TO OPTION MARKETS AND CREATES VERTICALS mky. Evolution of the Trader • The recent discovery of the “T-DNA,” or trader’s genetic code, has led scientists to piece together the thinkMoney family tree. Who knew we all share a double helix started by our favorite little creature way back when?
  • 23. NONAGENARIAN DOES PRECISE PORTFOLIO REBALANCES TO KEEP WHIPPERSNAPPERS AT BAY GALLIC KING OF TRADERS CORNERS MILK MARKET, SETS FRANCE UP AS CHEESE CAPITAL IN PERPETUITY EDICT FORCING ENGLISH SUBJECTS TO TAKE OTHER SIDE OF ROYALS’ LONG OPTION TRADES LEAVES STERN RULER PENNILESS BUT LOVED BY MILLIONS BUYS TOPS, SELLS BOTTOMS, REPEATS BEARISH DRUID TRADER PAINTS SELF BLUE IN ATTEMPT TO CONFUSE COLOR-BLIND BULLS DELIGHTS IN THE SIGHT OF A FLOCK OF ATM BUTTERFLIES EXPANDING AT EXPIRATION MUCH TO HIS MOTHER’S DISMAY, LIVES LIKE HE TRADES—AT THE THIRD STANDARD DEVIATION WORKS LIMIT ORDERS SO AGGRESSIVELY THAT US MINT IS CONSIDERING SUB-$.01 INCREMENTS SO EXCHANGES CAN KEEP UP CONSTANT PANIC AND DIRE WARNINGS LEAVE WANNA-BE BEAR WITH NO TIME TO ACTUALLY TRADE PENCHANT FOR 17-LEGGED OPTION TRADES LEADS PUZZLED ROMAN TRADER TO RENAME HIS CITY “BYZANTIUM”
  • 24.
  • 25. thinkMoney/24 •25 • Market-Neutral Trading • tdameritrade.com HOW TO NEUTER YOUR TRADE AT SOME POINT YOU MAY HAVE HEARD AN OPTIONS TRADER BOAST ABOUT BEING A “DELTA NEUTRAL” OR “ MARKET NEUTRAL” TRADER. BUT WHAT DO THESE TERMS MEAN, AND ARE THEY REALLY USEFUL? LET’S PUT THE DEBATE TO REST. WORDS BY THOMAS PRESTON PHOTOGRAPH BY FREDRIK BRODÉN
  • 26. NEUTRAL. The word conjures images of a discrete Switzerland and fifty shades of beige. But add the terms “market” or “delta” and the real fun begins. Why? Because “market neutral” and “delta neutral” are trading terms—often confused, confus-ing, and used interchangeably. Is a market-neutral strategy always delta neutral? Or can a delta-neutral strategy be market neutral? Rather than get into a semantic argument, let’s define them, then explore how you can apply them. DELTA WHAT? Delta neutral means that the delta of a portfolio or given position—how much money it will make or lose if a stock price changes $1.00, all other factors being equal—is zero, or close to zero. A simple position like a straddle, or a portfolio holding a lot of different options, can have cumulative delta close to zero, and be considered delta neutral at the onset of a trade, but not likely for long. Delta-neu-tral trading kicks in when the need arises to “neutral-ize” deltas, or rather, reset the position’s delta to zero. Market makers employ this technique when there’s too much directional risk—or in trader-speak, too many positive or negative deltas (see sidebar, right)— in a given position. Market makers continuously buy and sell options, and perhaps hedge each option trade with stock. For them, their profits arise from the bid/ask spread, and they don’t want to lose those profits if the stock or index moves in a given direction. For example, if an order comes into an exchange to buy out-of-the-money (OTM) calls, the market maker takes the other side of the trade by shorting those calls. The short calls have negative delta, and can lose money if the stock rallies. The market maker may immediately buy stock shares to generate positive deltas, to offset the call’s short deltas. If the stock ral-lies, he’s hedged. Or, he might see an order for some-one trying to buy puts. If he takes the other side of that trade by shorting puts, that too, could generate posi-tive deltas to hedge the short calls. It’s complicated, but being delta neutral keeps the market maker’s directional risk low. In that sense, delta neutral is a response to a question about an existing position. How many deltas does that existing position have, and how can they be reduced? More on that later. AS FOR MARKET NEUTRAL… Market-neutral trading, however, is much closer to what retail traders—you and me—do. We might create a specific strategy as a market-neutral trade, if we believe the stock price or index will stay in a range, or at least not move past certain price levels. The market bias is neither bullish nor bearish, and the expectation is the stock won’t move much at all. Hence, it’s market neutral. For example, think short strangles or iron con-dors. These market-neutral strategies typically start without a bias, and result in positions that we choose thinkMoney/24 •26 • Market-Neutral Trading • tdameritrade.com SEE GLOSSARY PAGE 42 FIGURE 1: Checking deltas. To view the deltas of each position or your entire portfolio in thinkorswim, 1) click the little “wrench”-looking thingy in the upper right of the Position Statement section of the Monitor page. Then 2) add “delta” in the menu of options to add to the columns. For illustrative purposes only. 1/ Click little wrench 2/ Add delta to the columns
  • 27. based on price, probability, or potential return vs risk. Now, market-neutral strategies often have very low deltas, at least when trades are initiated. How so? A short strangle, for example, composed of a short out-of- the-money (OTM) call, and short OTM put in the same expiration, can have a very low delta, if the call’s and put’s strike prices are roughly the same number of points OTM. The short call has a negative delta, and the short put has a positive delta. Combining the negative delta of the short call and the positive delta of the short put, the delta of the short strangle is close to zero. But a near-zero delta doesn’t always mean market neutral. For example, consider a long at-the-money (ATM) call vertical in options with single points between strikes. The long ATM call option might have a delta of .50, and the short-call option at the first OTM strike might have a delta of .46. The net delta is .04, which is pretty small. But that long-call vertical has a decidedly bullish bias, and is not market neutral. It could lose money if the stock just sits where it is. So, small delta doesn’t mean market neutral. By the way, you can always see the delta of your current positions on the Monitor page of the thinkor-swim ® platform (see Figure 1). It’s one of the columns in the “Position Statement” section of that page. To add delta, click on the little “wrench” icon in the upper-right-hand of the Position Statement section, and find “delta” from the list of available columns. RUBBER, MEET ROAD So, hopefully you now understand the difference between delta neutral and market neutral, but how can you use it? Is delta neutral solely for mar-ket makers? No. Retail traders, too, can employ delta-neutralizing strate-gies in an effort to protect profits and Important Information reduce losses. Unlike a market maker who neutralizes delta—i.e., gets the delta of a trade close to zero, on a trade-by-trade basis—retail traders may just want to reduce delta on a losing trade to help defend against further losses, or on a winning trade to potentially capture profits. Let’s see how. Consider a scenario with a stock price at $50 and a short 47 strike put for a 1.00 credit. This strategy loses if the stock price drops, and profits if the stock price rises. It has a positive .30 delta when you first put the trade on, and a breakeven point at $46. Defend against losses. If the stock drops to $48, the put will likely be losing money, and its delta rises to, say .45. Your strategy now has more delta (directional) risk to it, with the potential to lose a growing amount of money if the stock continues to drop. Now, you could just buy back the short put, but maybe you think the stock might stop dropping, or even rally a bit. A way to “defend” the short put would be to reduce the higher delta by selling a call against it. If the 50 call has a .35 delta, selling it for 1.20 would generate negative -.35 deltas, and leave you with a short 47/50 strangle with a current delta of positive .10. Selling the call also adds to the credit of the overall strategy, which increases the potential profit to 2.20 (minus transaction costs), and lowers the downside breakeven point to $44.80. Yes, you are adding risk to the position if the stock rallies sharply. But if the stock continues to drop, you could roll the short call to a lower strike to realize even more credit, which would lower the downside breakeven point further. Capturing profits. On the other hand, let’s say the stock rallies from $50 to $53, and the short 47 put is now profitable with a delta of .15. Rather than adding upside risk by shorting a call to reduce the already-lower delta, you might buy the 48 put with a delta of .20, for example, if it’s trading for less than the credit you took in for selling the 47 put. If you can buy the 48 put for .75, you’d not only reduce your delta from +.15 down to - .05, you’d also have the long 47/48 put vertical on for a net .25 credit (minus transaction costs). THESE ARE TWO SIMPLE EXAMPLES of reducing a position’s delta. You can use verticals or other spreads, for example, to reduce delta in a defined risk way. But if you understand the logic of choosing a specific option or spread based not only on how much it neutralizes the delta of a posi-tion, but also on how it can potentially enhance or improve the resulting cumulative position, you’ll be able to think more strategically about individual posi-tions, and even your entire portfolio. NEUTRAL JARGON Multiple-leg option strategies can entail substantial transaction costs, including multi-ple commissions, which may impact any poten-tial return. These are advanced option strate-gies and often involve greater risk, and more complex risk, than basic options trades. DELTA One of the option “greeks” that is the measure of expected change in an option’s price per $1 move in the underlying. Long calls and short puts have negative (-) deltas, while long puts and short calls have posi-tive (+) deltas. The maximum deltas a sin-gle US option contract can have is 100. The total sum of all posi-tions in a portfolio is the portfolio delta. DELTA NEUTRAL A position or option portfolio in which the total net deltas of all the legs of every posi-tions combined equal zero. For example, an at-the-money straddle is a delta neutral posi-tion because the call, carrying a delta of 50 offsets the put, with a delta of -50, for a net delta of 0. Since delta is always changing as the market moves, market makers and option traders will often reduce (“hedge”) their deltas with an offset-ting position, such as long puts against long calls or long stock; and short puts against short stock. MARKET NEUTRAL A style of trading in which a trader attempts to capture profits from a stock or index trading within a specific range. Though some market neutral strategies, like the straddle, start off as delta neutral, that’s not always the case.
  • 28. Gear Head 1For your inner trading nerd, one part thinkScript, and one part gadget. Enjoy. COOL SCRIPT #1 THE DOW-TO-GOLD RATIO • Words byDavid “Mr. Script” Kier When asked to describe a widespread problem and then offer a solution I thought they meant for some-thing like global warming. But alas, it was to solve a problem related to thinkorswim using thinkScript®, the do-almost-anything-we-didn’t-think-of tool. If you're new to thinkScript, see the left sidebar to learn more. For my first trick, I want to show you how to build a NEW TO SCRIPTING? chart that displays the ratio of the Dow Jones Industrial average to the price of gold. Despite the name, the “Dow-to-Gold Ratio” is used by many traders to tell how overpriced the S&P 500 (SPX) might be. (See Figure 1.) You can see historically as the SPX hit new highs, gold was also at highs, and the ratio remained relatively low. But at the time of writing, as SPX continues to rise, gold is going down. So SPX is becoming expensive valued in gold as well as U.S. dollars. BUILD-A-RATIO The Dow-to-gold ratio has been used to analyze everything from stock-market moves to predicting upcoming interest-rate decisions. We aren’t going to delve into Dow-to- gold theories, but rather describe how to see this ratio on thinkor-swim. The problem we face is you can’t enter ratios in the symbol entry box on thinkorswim. So we need to think outside the (symbol entry) box to solve this one. Starting on the thinkorswim Charts tab, bring up a one-year daily chart of the S&P 500 index by entering SPX in the symbol box. We’re going to build a study for a lower sub-graph of the chart in which the displayed data will be independent of the charted symbol—meaning, you can change the symbol with-out changing the new study. Once you see an SPX chart, fire up the thinkScript Editor by following the sidebar “Scripting from the Charts.” Then enter the following script: 1. #hint: Ratio Chart 2. declare lower; 3. Input symbol_1 = “/YM”; 4. Input symbol_2 = “/GC”; 5. Plot ratio = close(symbol_1) / close(symbol_2); 6. ratio.AssignValueColor(if ratio >= ratio[1] the Color.UPTICK else Color.DOWNTICK); After you’ve entered the above code, press Apply and OK and you’ll see a chart similar to Figure 2, with the Dow-to-gold indicator at the bottom. Now let’s break down the code line by line to help you figure out how you got there. thinkMoney/24 •28 • Trader Tools • thinkorswim scripts and gadgets FIGURE 1: How overpriced is it? The Dow-to-Gold ratio (the lower indicator above) helps you see how overpriced the SPX (upper chart) might be relative to the ratio. For illustrative purposes only. You can find help to get started in two places: 1/ The thinkorswim Learning Center at tlc.thinkorswim.com. Select the Charting tab, then thinkScript in the submenu. 2/ Read our Scripting Special Focus in thinkMoney, Winter 2014, by going to tdameritrade.com/ thinkmoney. 3/ Listen to Mr. Script's weekly show in the thinkScript Lounge of the thinkorswim Chat Rooms. From thinkor-swim, click the Chat icon at the top (2nd icon from the right) >Chat >thinkScript Lounge. gear Dow-to-Gold Ratio script results in this indicator.
  • 29. 1. Line one is a note which doesn’t affect your script but is used to keep track of each section’s goal. In our example we created “fancy note” by using the key word hint. This tells the thinkScript Editor to place the little help bubble next to our custom script in the Edit Studies and Strategies. 2. Line two tells the script this is a study by default that belongs on a lower subgraph. This is used with studies that don’t relate, or will not scale, to the chart’s price graph. 3. Lines three and four allow you to change the raio symbols without edit-ing the script.You can customize these two inputs in the study parame-ters similar to how you customize FIGURE 1: Share Your Awesomeness. Set up a chart with all your favorite indicators and share it with friends and loved ones. For illustrative purposes only. pre-defined studies. Since we are building the Dow-to-gold ratio, I used the futures for each of these specific products. 4. Line five is the math, the heart and soul of the script. We are simply taking the first input symbol and dividing it by the second, thus making it a ratio. 5. Line six makes the study pretty. The AssignValue- Color function allows us to color the line as the ratio changes. If the ratio moves up, we color the line as our Uptick. And if it moves down, as our Downtick. Congrats, you have your own Dow-to-gold ratio chart. And since you solved this in a smart way, you now create any ratio chart you desire simply by editing the symbols in lines 3 and 4. If you’re new to scripting, be sure to read our primer on scripting in thinkMoney, Winter 2014 issue. We may not have solved global warming today, but we did make one small step for a legion of traders! THINKORSWIM SHARING ONE WORLD. LET’S SHARE IT • Words by Chesley Spencer With over a bajillion possible customizations available, thinkorswim can be a little intimidating. Users often ask “how do I set up my platform like [insert celebrity trader here]?” Trying to replicate another trader’s setup used to be quite the exercise, but now it’s as easy as a button click. The Sharing Center enables users to share and consume a dozen different flavors of platform cus-tomizations by way of a web link. Each one of these platform functions has its own “Share” option that, when clicked, will generate a link to a web address which can then be given to anyone. Users can share their workspaces, watchlists, order or alert templates, trade grids, charts, scan queries, thinkScripts (stud-ies, strategies, columns, and alerts), or flexible grids. As we mentioned, each sharable function has its own share button, generally located where that func-tion is set up. For example, the button for a single chart is at the top of the chart’s border. The grid shar-ing button is in the grid menu, etc. Figure 1 shows many, but not all, of the locations where these links can be created. Once you select a share function, a new window you’ll see with the option to share the content directly with myTrade®, or to create an HTML link which can then be posted anywhere you like on the Internet. Keep in mind: you’ll need a myTrade username to cre-ate a link (so others can see the source). This can be created under the Tools tab in myTrade. From myTrade, click on “Settings,” edit your Display Name, then click “Update Settings.” When shared content is loaded into the platform, it will either save a copy to load later (such as a Work-space), or pop-out in a discrete window (such as a chart). This way, you’ll always have the chance to save your setup. Important Information myTrade is a service of myTrade, Inc., a separate but affiliated firm. In order to use the service, you must cre-ate a myTrade profile, and conform to the myTrade terms of use. TD Ameritrade is not responsible for the services of myTrade, or content shared through the service. 2 Watch It! For a more detailed walk-through on the Sharing Center, watch the video in the Learning Center.
  • 30. ATTACK THE MARKET FROM ALL SIDES. Turn education into action at the 2014 Investools Investor Education Conference. Strategy-building breakout sessions. Insight from industry pros. Networking with like-minded traders. FEATURED KEYNOTE SPEAKERS Learn more e at investoolsconferences.thinkmoney TD Ameritrade, Inc. (member FINRA/SIPC/NFA) and Investools®, Inc. are separate but affiliated companies that are not responsible for each other’s services or policies. Investools, Inc. and TD Ameritrade, Inc. arewh sep parate res holly owned subsidiaries of TD Ameritrade Hold ing Corporation. are wholly Holding TD Ameritrade is a trademar rk jointly owned by TD Ameritrade IP Compan y, Inc. and The Toronto-Dominion Bank. © 201 14 TD Ameritrade IP Company, Inc. All rights r trademark Company, 2014 with permission. Investools does not provide financial advice and is not in the business of transacting trades. reserved. Used IEG 1316 S 04/14 AUGUST 18-20, 2014 | DALLAS HYATT REGENCY Ken Fisher Forbes Columnist Find out how a veteran money manager is handling today’s market. T. Boone Pickens Visionary Entrepreneur Get the latest on the energy market—and why you should care. investools conferences.com/th hinkmoney fi / nancial trans y acting IE sponsible EG
  • 31. •Hey kid, you wanna come work for me? That was thinkorswim® founder Tom Sosnoff, talking to Mike Barwacz thirty years ago on the trading floor of the Chicago Board Options Exchange (CBOE). Happily for us, Barwacz said yes, and first clerked for Sosnoff before moving into the OEX pit as a market maker in his own right. Back then, Barwacz took a lot of grief for his trading badge which read “SYZ” (pro-nounced “size”)—an ironic acronym since he started as a one- and two-lot trader. As fate would have it, the acronym spoke volumes about Barwacz’s ambition and drive. Still a passionate trader geek, he’s now Director of TD Ameritrade’s Trade Desk and oversees teams in Chicago, Fort Worth, and Canada. Not surprising, he draws heavily on 22 years of knowledge and wisdom from the trading floor to ensure trade-desk reps have the right stuff to talk to clients about even the most com-plex options strategies. Barwacz is called the unofficial mayor of Chicago for good reason, and walking the CBOE trading floor with him takes some time. He seems to know everyone and loves to talk trading strategies. We wondered how his years on the floor helped shape who he is today. Meet the Mayor Mike, tell us about those early days at the CBOE. It was the mid-1980s and options were get-ting hot. That was the buzz. At one point the OEX (SP 100) was the biggest pit in the world and had almost 600 guys. Tom Sos-noff, JJ Kinahan and I, we all stood very close to each other. We were like family. The best days were when you really couldn't leave, because there was so much paper (orders), and you were sweating through your coat. It was great. The energy, the com-petitiveness, having a broker yell something out, and you being the first on the ticket. You were at thinkorswim in the early days, right? I joined thinkorswim (when it was an independent brokerage) in 2007 and helped guide the Chicago office through TD Ameritrade transition after the merger. Hiring people from the floor is what made thinkorswim so special. Floor traders are a different breed. We have a different gene. As competi-tive as it was, there was also honor and etiquette, which we took off the floor as well. We knew how to talk to clients and explain things in a clear, simple manner. That’s the benefit of coming to TD Ameritrade. It's like a family here. What are your three trading rules to live by? Don’t panic, man-age your winners, learn from your mistakes. What's the bigger goal ahead for Trade Desk? At the time TD Ameritrade bought thinkor-swim, about 6% of their trades were options. Now, it’s 40%. We wanted customer-service reps to be able to answer complex phone calls about option strate-gies. So, in the last year and a half, we've combined trade desks into the “One Trader Group,” and taken reps through a rigorous training. We make sure all our trade-desk reps trade, or paper trade. They've got to have skin in the game. We hire people who are passionate about trading. I heard a rumor you like to “initiate” unsuspecting guests? Well, I’ve been called the “Entertainment Committee.” So yeah, if you’re visiting TD Ameritrade’s Chicago office on busi-ness, I’d likely be the one showing you around. We might make it over to the Motel Bar for an introductory shot of Malört (an infamously terrible-tasting, Chicago-made liquor, by the way). That’s all I’m going to say. thinkMoney/24 •31 • Associate Spotlight • A chat with a TD Ameritrade VIP making waves • Interview by Kira Brecht • Illustration by Joe Morse • TD Ameritrade’s Mike Barwacz runs the innovative Trading Desk with old-school principles. spot
  • 32. thinkMoney/24 •32 • Special Focus: thinkorswim Charts • tdameritrade.com CHARTS THAT NO DOUBT YOU CAN FIND LOTS OF CHARTING PROGRAMS OUT THERE. BUT SERIOUSLY, WHY LOOK FURTHER? OTHER THAN A BACK MASSAGE, THINKORSWIM® CHARTS CAN DO ALMOST ANYTHING YOU’D NEED A CHART TO DO—EVEN IF YOU’RE NOT A CHART READER. RULE THE WORLD WORDS BY THOMAS PRESTON PHOTOGRAPH BY FREDRIK BRODÉN SPCL FOCUS
  • 33.
  • 34. thinkMoney/24 •34 • Special Focus: thinkorswim Charts • tdameritrade.com WANT TO KNOW A LITTLE SECRET? When the thinkorswim® platform was first built, it didn’t have charts. It’s not that the development team couldn’t build chart func-tionality. It’s just that as ex-market makers, we didn’t think to add them because we hadn’t really used them. Then two things happened. One, customers started to ask for charts. And two, we figured out some cool chart functionality that would help traders who didn’t do technical analysis. I won’t bore you with how to interpret the hundreds of technical studies or chart drawings the platform sup-ports. You’ll find volumes of books on that subject. I want to focus on the stuff you may not have seen—the cooler stuff that’s easy to overlook. Let’s shine a light on some of the features that chartists and non-chartists alike can use in day-to-day trading. These instructions will be based on the Charts page unless otherwise noted. OVERLAYS An overlay is when you have two or more different stocks or indices displayed on the same chart. It’s a way to see relative performance—whether one is over-or under-performing another. It can be a measure of relative strength, and it’s also handy if you’re doing pairs trades. (See Figure 1.) Here’s how you do it: 1— Look in the upper-right-hand corner for the Studies button. Click on it, then hold the cursor over “Add Study” to see the expanded menu. 2—Hold the cursor over “Compare With” at the bottom of that menu. You’ll see for example a list of default index symbols like DJX and SPX, as well as “Custom Symbol” at the top. If you click on one of the index symbols, or enter another symbol when you click on “Custom Symbol,” a chart for that symbol is overlaid on the chart. For example, if you have a chart for DJX and you select SPX from the list of indices, an SPX line chart will be displayed along with the DJX chart. The vertical axis on the left-hand-side will be scaled for the overlay symbol so the high-and-low range fits on the same chart as the original symbol. That’s how the SPX, whose price is 10x the price of the DJX, can be dis-played on the same chart. You can also go back to the “Compare With” menu and add more indices or cus-tom symbols. To take overlays one step further, click on the “Style” button in the upper-right-hand corner, then click on “Settings.” Now in the “Chart Settings” win-dow, click on the “Price Axis” tab and check the “Show Price as Percentage” box. That switches the vertical axis on the left-hand side of the chart to show the per-centage change each symbol has had from the first date on the left-hand side of the chart, to the current day. This makes it easier to compare performance of two symbols with different prices. BACKTESTING* You can test trading strategies based on technical indi-cators, and see the profit-and-loss performance right on the charts. The charts have what we call “Strategies,” which are simulated long-and-short entry and closing points determined by a technical indicator. You can code your own strategy, which is beyond the scope of this article, but I’ll show you how to get started: 1—Click on the “Edit Studies” icon in the upper-right-hand corner. FIGURE 2: Real test, fake money. Backtest a strategy first. Then view the entry and exit points on the chart, as well as a p/l before committing real dollars. Short Entry Long Entry FIGURE 1: Comparing Notes. Use the overlay function in thinkorswim, to compare two stocks, or in this case a stock to the SPX (pink line). For illustrative purposes only. For illustrative purposes only.
  • 35. 2—In the window that pops up, click the “Strategies” tab on the upper-left corner. 3—On the left-hand-side you’ll see a list of the default strategies available. To make the strategies “work,” you need to add commands that will show both “long entry” (LE) and “short entry” (SE), at a minimum. 4—For practice, look for the “BollingerBandsLE” and “BollingerBandsSE” strategies in the list. Those are the long-entry and short-entry commands based on Bollinger bands. Double click on each one and it will be added to the list of studies and strategies on the charts in the main body of the “Edit Studies and Strate-gies” window. 5—Click the “Apply” button in the lower-right-hand corner of the window, then the “OK” button. You should see “BollingerBandsLE” and “Bollinger- BandsSE” labels on the chart, indicating simulated buying and selling 100 shares of stock based on the Bollinger Band test. To see the profit and loss of those simulated trades, place the cursor directly on one of the labels, and right click to open a new menu. Click on “Show Report” in that menu to open the “Strategy Report” window. There you’ll find the buy-and-sell sig-nals, and profit-and-loss data for the strategy. And by the way, if you want to buy or sell the chart’s stock shares for real, right click in the chart’s main body and select “Buy” or “Sell” from the drop-down menu. Plus, on the far-right-hand side of the chart window, you’ll see tabs for “Trade,” “Time and Sales,” “Level II,” etc. This lets you add windows with those features next to the chart window. That can basi-cally set up charts as your go-to page for stock and futures trading needs. LOOKING INTO THE FUTURE OK, not even thinkorswim has a crystal ball. But Charts let you see future dates to the right of the current date. This helps you locate upcoming earnings and dividend dates, for example, as well as helps you extend draw-ings like trend lines into the future so you can identify possible price targets. The process? 1— Click on the “Style” button in the upper-right-hand corner and click on the “Settings” choice in the drop-down menu. 2— Click on the “Time Axis” tab in the “Chart Set-tings” window. 3— Now look for the “Expansion Area” control. You can enter a number in the field for “bars to the right”— say, 50—then click the “Apply” button on the win-dow’s bottom-right-hand corner. That will add empty space to the right of the current date on the chart (see Figure 3). Once you’ve done that, you can extend a trend line or other drawing into that space. Place the cursor directly on the trendline and right click. Select “Extend to Right” from the drop-down menu and you’ll see that line in those future dates. A study that’s built specifically for those future dates is the Probability of Expiring Cone (Figure 3 also). This draws the upper-and-lower bounds of a stock’s or index’s price range that theoretically encompasses a level of probability. One way to add the cone study is to click on the FIGURE 3: Peeking at the Future. By adjusting the chart to stop 50 bars from the right (shaded area), you can view future earnings and dividend dates. Add a prob-ability cone (pink curve line) to estimate the probability range in which a stock will trade prior to those dates. More on Charts, Please... If you're looking for even more awesomeness to squeeze out your thinkor-swim Charts, learn more at the thinkorswim Learning Center. Go to: tlc.thinkorswim.com then click Charts. Right-click here choose “Show Report” Probability Cone Future Earnings Dividend Dates For illustrative purposes only.
  • 36. thinkMoney/24 •36 • Special Focus: thinkorswim Charts • tdameritrade.com “Edit Studies” icon in the upper-right-hand corner and find “ProbabilityofExpiringCone” from the list of studies on the window’s left-hand side. Double click to add it to the list of chart studies. You’ll also find two fields to edit for the study. The “period” is the num-ber of future dates for which the probability cone is calculated, and the “prob range,” is the probability the projected range covers. The default “prob range” is 68%, which cor-responds roughly to one standard deviation. Set it to 95% to see a cone that covers two standard deviations, or 99%, to see a cone that covers three standard deviations. THESE FEATURES REALLY JUST SCRATCH the surface of charting functionality. But hopefully you now have an idea of their scope and how to access them. Each of the described menus has other choices that lead you to other functions. Go ahead and continue to explore the charts to see just how hard you can make them work for you. Important Information *Backtesting is the evaluation of a particular trading strategy using historical data. Results presented are hypothetical, they did not actu-ally occur and they may not take into consid-eration all transaction fees or taxes you would incur in an actual transaction. And just as past performance of a security does not guarantee future results, past performance of a strategy does not guarantee the strategy will be successful in the future. Results could vary significantly, and losses could result. myTrade is a service of myTrade, Inc., a separate but affiliated firm. In order to use the service, you must create a myTrade pro-file, and conform to the myTrade terms of use. TD Ameritrade is not responsible for the services of myTrade, or content shared through the service. Supporting documentation for any claims, comparison, statistics, or other techni-cal data will be supplied upon request. 1/ Determine Trend How to…Find and Chart Your Next Trade • It’s easier than you think. Just ask three questions. Often, too many indica-tors can lead to indeci-sion and antacids. But there’s a more logical approach to finding a potential trade and plotting a chart using just a few indicators to answer some important questions you might have about what a stock may do next. STEP 1: SCAN THE UNIVERSE Using Stock Hacker in the Scan tab of thinkorswim® trading platform, refer to Figure 1. There you can scan the world of stocks with your own criteria, containing the list of stocks to scan, your filters, and all the price data your heart desires. Then… FIGURE 1: Legal Hacking. Scanning for trades with Stock Hacker is as simple as choosing the list, then your parameters, and sorting how you want the results to show. For illustrative purpose only. 1—Choose the subset of stocks you would like to scan from the drop-down next to the words “Scan in.” There, you can see predefined categories as well as all your personal watch lists, and GICS classi-fied industry lists. 2—Choose All Optionable if you only want to see stocks with listed options. 3—Select “Add Stock Filter” below the “Scan in” drop down to add a stock filter to the existing set of criteria. 4—Choose Last and enter a minimum and maximum price of the stock. 5—Now click the “Add Study Filter” but-ton. Use the drop down to select the “Price Performance” group and choose “Price Direction.” The default inputs for this fil-ter are “CLOSE” and “increased,” which we’ll keep. But you might want to increase the number of bars of data to more than 3. 6—Sort for the most heavily traded by choosing the “sorted by” dropdown to the left of the scan button. Select “Basic Price Quote” menu and choose “Volume.” WORDS BY DAVID KIER FIGURE 2: Chart the Trade. Once you find a stock in Stock Hacker, right click and choose “TOS Chart.” Then answer the ques-tions above. For illustra-tive purpose only. chrts A Choose stock list A Choose stock list A Choose stock list 2/ Determine Strength of Trend 3/ Is Trend Strengthening
  • 37. 7—In the next menu choose “Descending.” Then press “Scan.” The results will appear at the bottom of the screen like orderly soldiers. If you’re not happy with them, you can always edit the filters. STEP 2: MASTER THE UNIVERSE Okay, maybe not the actual universe, but you can attempt to determine where the stocks in your world are going by charting them in the thinkorswim Charts. Just right click on any symbol in the scan results and choose “TOS Charts.” If you’ve never charted, you should try to answer three basic questions: 1—What’s the trend? 2—How strong is the trend? 3—Where do I get in? To help us with these questions, we’ll add three studies: simple moving average, volume, and Relative Strength Index, and make a couple of minor adjustments to the parameters. Referring to Figure 2, change your chart to a one-year daily chart. Then, from the studies menu in the upper right corner of your chart, add SimpleMovingAvg and RSI-Wilder. Click on the SimpleMovingAvg and edit the length of the study to 50. You don’t have to add volume since it is already turned on by default. However, if your vol-ume isn’t displayed you can add it within the Settings menu. Once you’ve got thinkorswim Charts set up, you can answer the three questions. One: Is the stock clearly trading above the simple moving average (blue line in chart) or has it recently crossed above the line? Two: does the indicator line in the RSI-Wilder cross from below the 30 line to above the 30 line recently? Three: is the volume increasing or higher than normal (bars are higher than prior bars, indicating more traders committing to the trade)? WHILE THERE’S NEVER A GUARANTEE that a trend will continue, if you’ve answered “yes” to all three of these, then there’s a good chance you may have filtered for a stock or two smack dab in the heart of a bullish run. Happy trading! Q: How can I synchronize drawings across multiple chart windows with the same symbol? A: If you have a drawing like a trend line or a price level on a chart, you can have that appear at the same price level on another chart, even if it has a differ-ent time scale. Click on the “Style” button, then click on “Settings.” In the “Gen-eral” tab of the “Chart Set-tings” window, you’ll see “Synchronize” with a checkbox for “Drawings” and “Crosshair Position” in the middle of the left-hand side. If those are checked, you can get a drawing dis-played on a daily chart and a minute chart, for example, that have dif-ferent price scales without your having to recreate the drawing. Q: I’ve set up my charts just how I like them. How do I save the settings and have them open as my default? A: Once you have the time frame, technical studies, colors, and other settings established for each new chart, click on the “Style” button, then click on “Set Chart Default” from the drop-down menu. Now you can close the thinkorswim platform and reopen it with your favorite chart settings loaded as a default. Q: How can I share my chart settings with some-one else? A: You can share your charts on the thinkorswim platform with anyone else who uses the platform. Click the “Share” button in the upper-right-hand corner. This opens a win-dow with a choice to share the chart you’re currently on via email, Facebook, Twitter, or myTrade®. If you choose email, Face-book, or Twitter, you can copy and paste a link. As long as the other person has the thinkorswim plat-form open, the link will open up a chart window with your symbol, studies, and settings. Q +A FAQs. PRECISION CHARTING HOW TO EDIT YOUR STUDIES In thinkorswim Charts, if you click on the “Studies” button in the upper-right-hand corner and hold the cursor over “Add Study,” you’ll see dozens and dozens of different techni-cal- analysis tools you can add to a chart. But if you know your studies, you’ll know that most of them have parameters that can be changed— things like the number of data bars used in the study, or like the K period and D period in Stochastics, for example. There’s a fast way to edit those inputs and parameters. 1— In the upper-right- hand corner, look for the “Edit Studies” icon that looks like a test tube releasing a drop of liquid. It’s a couple inches to the left of the “Studies” button. 2— Click on that icon to open the “Edit Studies and Strategies” window. 3— In that win-dow’s main area, you’ll see any stud-ies you’ve loaded on the chart. Hold the cursor over the study you want to edit and click the “gear” icon on the right-hand side. That opens the controls to change the study’s inputs, as well as color for-mats.
  • 38. • These days, trading terms may not be as complicated as “supercalifragilisticexpiali-docious.” But close. Like flying nannies, market words are weird and wonderful. Understanding references like “contango” and “backwardation” could hold the secret to your success when you try to make sense of price moves in ETF products whose val-ues are tied to futures contracts. Remember a futures contract is an agreement to buy or sell something—like oil, for instance—at some time in the, well, future. In general, futures prices differ from “spot prices,” which represent real-time cash prices. If a future price trades higher than the spot, this is called “contango.” If a future price trades lower than the spot, this is called “backwardation.” Note the following table. As an example, crude oil is said to be “in contango” when longer-dated con-tracts trade at increasingly higher premi-ums over cash. This premium exists to cover the costs, for instance, of paying the storage for the oil between now and a futures expiration. As the contract gets closer to expiration, this premium begins to “decay,” until the price of the expiring future matches the cash. For instance, assume a cash price of $100 per barrel, and $105 for a 30-day futures contract. If oil’s cash price remains unchanged, then 30 days later the expiring futures contract will also be worth $100. If you had bought the futures contract, you just lost $5. Just a Spoonful of Sugar... What does this have to do with your trad-ing life? Even though you’re trading an ETF, in reality you’re trading futures contracts (at least through the fund manager) because products such as oil ETFs—derive their prices from futures. The goal of an oil ETF isn’t simply to track the price of oil. It’s to track the price of oil using near-month oil futures. As a fund’s near-term futures contracts approach expiration, those contracts need to be rolled over into longer-term futures expirations so the fund avoids being forced into taking physical delivery of all that crude. And when the market is in con-tango, guess what? You end up paying more for the longer-term con-tract than what you receive from selling the shorter-term contract, and the net price of your investment goes down. This is called “roll decay,” and with oil futures expiring every month, this decay can really add up. REMEMBER THAT just because a market is in con-tango, and longer-term futures cost more than shorter-term contracts, that doesn’t necessarily ground your investment. It’s just a headwind to keep track of. Given that the value of oil, volatility, or whatever it is you're trading, could go up, this change in the cash price might be enough to offset ‘roll decay’. Or it might not. You may not have to clean chimneys, but watch the words that make the market. And above all, always work to under-stand the products you’re trading. thinkMoney/24 •38 • Capiche • Pearls from a veteran floor trader • Words by Greg Loehr 30-day future price—contango $105 Cash (spot) price $100 30-day future price—backwardation $95 For illustrative purposes only. Burned by Oil Rolls • If you’re trading futures-based ETFs, beware of the “rolling risk” Important Information Carefully consider the investment objectives, risks, charges and expenses before investing. A prospectus, obtained by calling 800-669-3900, contains this and other important information about an investment company. Read carefully before investing. Commodity ETFs may be affected by changes in overall market movements, commodity index volatility, changes in interest rates or factors affecting a particular industry or commod-ity. Commodity ETFs may be subject to greater volatility than traditional ETFs and may not be suitable for all investors. Unique risk factors of a commodity fund may include, but are not limited to the fund's use of aggressive investment techniques such as derivatives, options, forward contracts, correlation or inverse correlation, market price variance risk and leverage. This information is for educational purposes only.This is not a recommendation to trade any specific security. cap.
  • 39. Introducing CBOE Short-Term Volatility IndexSM (VXSTSM) options and futures, with weekly expirations. By tracking 9-day expected volatility, Short-Term VIX is particularly reactive to changes to the SP 500® Index. So now you have the opportunity to capture more risk premiums with weekly expirations. Capitalize on sudden market events. Better manage near-term risk. And help take advantage of volatility for the here and now. Download the Short-Term VIX quick reference guide at ShortTermVIX.com Tweet with dollar-sign tag $VXST Options involve risk and are not suitable for all investors. Prior to buying or selling an option, a person must receive a copy of Characteristics and Risks of Standardized Options. Copies are available from your broker, by calling 1-888-OPTIONS, or at www.theocc.com. Futures trading is not suitable for all investors, and involves risk of loss. Futures and options on CBOE’s volatility indexes have several unique features that distinguish them from most equity and index options, and investors are strongly encouraged to closely read and understand the ODD and the VIX options FAQ at http://ww-w. cboe.com/micro/vix/vixoptionfaq.aspx and other informational material before investing. No statement within this ad should be construed as a recommendation to buy or sell a security or futures contract or to provide investment advice. CBOE® and Chicago Board Options Exchange® are registered trademarks and Execute SuccessSM, CBOE Short-Term Volatility IndexSM and VXSTSM are service marks of Chicago Board Options Exchange, Incorporated (CBOE). SP and SP 500® are registered trademarks of Standard Poor’s Financial Services, LLC and are licensed for use by CBOE and CBOE Futures Exchange, LLC. SP does not sponsor, endorse, sell, or promote any SP index-based investment product. © 2014 CBOE. All Rights Reserved.
  • 40. Q: Hey, Trader! When I look at options, I usually see that out-of-the-money (OTM) puts have a higher price than OTM calls that are the same dis-tance out of the money. And some-times I see stocks whose OTM calls are higher than the OTM puts. What’s going on and why? T: That, my friend, is volatility skew in action. Vol skew, for short, is when the implied volatilities of the options in a particular expiration aren’t all the same. If you look at a graph of the implied vols, they usually slope up, and away, from the ATM strikes. And the slope is often steeper for the OTM puts than the OTM calls. This is because investors often buy OTM puts as a hedge against long stock, and sell OTM calls as either a covered call, or to finance buying the put. That buying-and- selling pressure drives the implied vols of the puts higher than the calls, which in turn makes the puts look more expensive than the calls. But when calls are more expensive than the puts, the slope of the call skew is steeper than the put skew, and that can happen when the stock has a lot of speculative activity. Investors who believe a stock might make a big move higher may buy calls, which can drive those particu-lar values, and implied vols, higher. Q: Why do my AAPL* options look so strange after the stock split 7-1? T: No matter how strange things look, remember that the split itself doesn’t change the value of your position. That said, let’s look at an AAPL option pre- and post-split. If the August 560 put is trading for $14.00 and has .33 delta pre-split, it would be worth about $100 more if AAPL dropped $3.00 (with all other things being equal) and the 560 put rose to $15.00. Post-split, the price of AAPL was 1/7th of the pre-split price, and all the option strike prices were adjusted down to 1/7th, too. So, the 560 put turned into the 80 put and might be worth about $2.00. But the single 560 put turned into seven 80 puts. A single 560 put at $14.00 has a $1400 value, and 7 80 puts at $2.00 also have a $1400 value. Now, the delta of the 80 put will still be about the same as the 560 put, .33. And if AAPL drops the same percent-age post-split as pre-split, a $3.00 drop would be about $.43. That means the 80 put would increase by about .142. Since you have 7 of the 80 puts, 7 x $14.20 = $99.40, which is nearly the same as the pre-split change in value. That means the risk of your position does-n’t change from pre- to post-split. Q: Hey, Trader! Greetings! My name is Zyphro and I come from the year 2514. I wish to bestow upon you all the Fed announce-ments from your time until mine so your future self can be wealthy! T: Um, thanks Zyphro, but even if I knew what the Fed numbers were going to be, I’d still have no idea which way the market would move. Seri-ously, that stuff is a coin flip. Interpret-ing Janet Yellen’s statements is a job all by itself. I’m too busy actually trad-ing. But if you know the future, can you tell me if this burrito I’m about to eat will keep me up all night? thinkMoney/24 •4 0 • Ask the Trader Guy • Rescuing traders, one question at a time. • Photograph by Fredrik Brodén trdr. Important Information *Security symbols displayed for infor-mational purposes only. This is not a recommendation to trade any specific security. Multiple-leg option strategies can entail substantial transaction costs, including multiple commissions, which may impact any potential return. These are advanced option strategies and often involve greater risk, and more com-plex risk, than basic options trades.
  • 41. Bring out the option trading machine in you. Stay on top of the option market with thinkorswim® platform tools. You eat iron condors for breakfast. You straddle the market like it’s nobody’s business. When it comes to option trading, you think you know it all, right? Think again. There’s a world of option opportunity out there. And we keep bringing you the innovative tools to help take it on. Slice and dice data like never before with option statistics. Scan thousands of optionable stocks in seconds with dynamic scanning. It’s no wonder why Barron’s named us among the “Best for Options Traders” five years in a row.* Learn more at tdameritrade.com/options Market volatility, volume, and system availability may delay account access and trade executions. Options are not suitable for all investors as the special risks inherent to option trading may expose investors to potentially rapid and substantial losses. Option trading privileges subject to TD Ameritrade review and approval. Before trading options, carefully read the previously provided copy of the options disclosure document: Characteristics and Risks of Standardized Options. See our website or contact us at 800-669-3900 for additional copies. *TD Ameritrade was among the firms listed in the category of “Best for Options Traders” in Barron’s Online Broker Review for five years in a row (2009-2013). Barron’s is a trademark of Dow Jones, L.P. All rights reserved. Reprinted with permission. TD Ameritrade, Inc., member FINRA/SIPC/NFA. TD Ameritrade is a trademark jointly owned by TD Ameritrade IP Company, Inc. and The Toronto-Dominion Bank. © 2013 TD Ameritrade IP Company, Inc. All rights reserved. Used with permission.
  • 42. thinkMoney/24 •42 • The Token Glossary • Terms you might stumble across in this issue. • tdameritrade.com OUT OF THE MONEY (OTM) • An option whose premium is not only all “time” value, but the strike is away from the underlying equity. For calls, it’s any strike higher than the underlying. For puts, it’s any strike that’s lower. AT THE MONEY (ATM) • An option whose strike is “at” the price of the underlying equity. Like out-of-the- money options, the premium of an at-the-money option is all “time” value. IN THE MONEY (ITM) • An option whose premium contains “real” value, i.e. not just time value. For calls, it’s any strike lower than the price of the underlying equity. For puts, it’s any strike that’s higher. 26 found on page: Short Straddle /Strangle • A market-neutral strategy with unlimited risk, composed of an equal number of short calls and puts of the same strike price (straddle) or two dif-ferent strike prices (strangle), result-ing in a credit taken in at the onset of the trade. The strategy assumes the underlying will stay within a certain range, in which case, as time passes and/or volatility drops, the options can be bought back cheaper than the credit taken in, or expire worthless; resulting in a profit. Breakeven points of either strategy at expiration is cal-culated by adding the total credit received to the call strike and sub-tracting the total credit received from the put strike. SHORT • To short is to sell an asset, such as an option or stock that you don’t own in order to collect a premium. The idea being that if you believe the price of the asset will decline, you can buy back (or “cover”) your short at a lower price later. Your potential profit would be the difference between the higher price you shorted at and the lower price you covered. found on page: 20 27 Theta • A measure of an option’s sensitivity to time passing one calendar day. For example, if a long put has a theta of - .02, the option premium will decrease by $2. VEGA • A measure of an option’s sensitivity to a 1% change in implied volatility. For example, if a long option has a vega of .04, a 1% increase in implied volatility will increase the option premium by $4. Delta • A MEASURE OF AN OPTION’S SEN-SITIVITY TO A $1 CHANGE IN THE UNDERLYING ASSET. ALL ELSE BEING EQUAL, AN OPTION WITH A 50 DELTA (ALSO WRITTEN AS .50) FOR EXAM-PLE, WOULD GAIN 50 CENTS PER $1 MOVE UP IN THE UNDERLYING. LONG CALLS AND SHORT PUTS HAVE POSI-TIVE (+) DELTAS, MEANING THEY GAIN AS THE UNDERLYING GAINS IN VALUE. LONG PUTS AND SHORT CALLS HAVE NEGATIVE (–) DELTAS, MEANING THEY GAIN AS THE UNDERLYING DROPS IN VALUE. Long Straddle • A market neutral, defined risk position, composed of an equal number of long calls and puts of the same strike price. The strategy assumes the market will break out one way or another, in which case, a profit occurs when one side of the trade gains more than the other side loses. Breakeven points are calculated by adding and subtracting the total debit to and from the strike price of the options. 13 27 found on page: found on page: found on page: found on page: 12, 21, 26 38 gls found on page: 13 13 12, 20, 26 38