Beginners Guide to TikTok for Search - Rachel Pearson - We are Tilt __ Bright...
08 12-11-long wave-slides-triggers_update
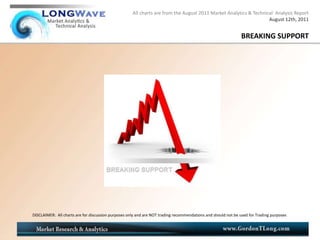
1. All charts are from the August 2011 Market Analytics & Technical Analysis ReportAugust 12th, 2011 BREAKING SUPPORT DISCLAIMER: All charts are for discussion purposes only and are NOT trading recommendations and should not be used for Trading purposes
2. All charts are from the August 2011 Market Analytics & Technical Analysis ReportAugust 12th, 2011 BREAKING SUPPORT MARKET PANIC & SELL OFF Its more than a US Debt Downgrade 6th Biggest DOW Drop in History Critical Support Broken & Major Technical Damage DISCLAIMER: All charts are for discussion purposes only and are NOT trading recommendations and should not be used for Trading purposes
3. This chart is from the August 2011 Market Analytics & Technical Analysis ReportAugust 12h, 2011 DRIVERS: PERFECT STORM EU CRISIS: Italian and Spanish Funding Seizes Up, France & French Banking Worry US DOWNGRADE: Historic action to the Global Reserve Currency Concern of Global & US Economic Slowdown JAPANESE YEN: Forced YEN Carry Trade Unwinding DISCLAIMER: All charts are for discussion purposes only and are NOT trading recommendations and should not be used for Trading purposes
4. This chart is from the August 2011 Market Analytics & Technical Analysis ReportAugust 12h, 2011 DEATH CROSS and HEAD & SHOULDERS DISCLAIMER: All charts are for discussion purposes only and are NOT trading recommendations and should not be used for Trading purposes
5. This chart is from the August 2011 Market Analytics & Technical Analysis ReportAugust 12h, 2011 DEATH CROSS and HEAD & SHOULDERS DISCLAIMER: All charts are for discussion purposes only and are NOT trading recommendations and should not be used for Trading purposes
6. This chart is from the August 2011 Market Analytics & Technical Analysis ReportAugust 12h, 2011 ROUNDED TOP DISCLAIMER: All charts are for discussion purposes only and are NOT trading recommendations and should not be used for Trading purposes
7. This chart is from the August 2011 Market Analytics & Technical Analysis ReportAugust 12h, 2011 WARNINGS DISCLAIMER: All charts are for discussion purposes only and are NOT trading recommendations and should not be used for Trading purposes
8. This chart is from the August 2011 Market Analytics & Technical Analysis ReportAugust 12h, 2011 HEAD & SHOULDERS DISCLAIMER: All charts are for discussion purposes only and are NOT trading recommendations and should not be used for Trading purposes
9. This chart is from the August 2011 Market Analytics & Technical Analysis ReportAugust 12h, 2011 DEATH CROSSES DISCLAIMER: All charts are for discussion purposes only and are NOT trading recommendations and should not be used for Trading purposes
10. This chart is from the August 2011 Market Analytics & Technical Analysis ReportAugust 12h, 2011 LIBOR-OIS SPREAD DISCLAIMER: All charts are for discussion purposes only and are NOT trading recommendations and should not be used for Trading purposes
11. This chart is from the August 2011 Market Analytics & Technical Analysis ReportAugust 12h, 2011 STANDARD DEVIATIONS DISCLAIMER: All charts are for discussion purposes only and are NOT trading recommendations and should not be used for Trading purposes
12. This chart is from the August 2011 Market Analytics & Technical Analysis ReportAugust 12h, 2011 STANDARD DEVIATIONS DISCLAIMER: All charts are for discussion purposes only and are NOT trading recommendations and should not be used for Trading purposes
13. This chart is from the August 2011 Market Analytics & Technical Analysis ReportAugust 12h, 2011 LIQUIDITY SQUEEZE DISCLAIMER: All charts are for discussion purposes only and are NOT trading recommendations and should not be used for Trading purposes
14. This chart is from the August 2011 Market Analytics & Technical Analysis ReportAugust 12h, 2011 ECB INTERVENTION DISCLAIMER: All charts are for discussion purposes only and are NOT trading recommendations and should not be used for Trading purposes
15. This chart is from the August 2011 Market Analytics & Technical Analysis ReportAugust 12h, 2011 YEN CARRY TRADE: Intervention “Like Spitting into a Hurricane!” DISCLAIMER: All charts are for discussion purposes only and are NOT trading recommendations and should not be used for Trading purposes
16. This chart is from the August 2011 Market Analytics & Technical Analysis ReportAugust 12h, 2011 REGRESSION & FIBONACCI DISCLAIMER: All charts are for discussion purposes only and are NOT trading recommendations and should not be used for Trading purposes
17. This chart is from the August 2011 Market Analytics & Technical Analysis ReportAugust 12h, 2011 REGRESSION & FIBONACCI DISCLAIMER: All charts are for discussion purposes only and are NOT trading recommendations and should not be used for Trading purposes
Hinweis der Redaktion
IT IS ONE THING FOR THE MARKETS TO START EXHIBTING AN INITIAL NEW PATTERN OF LOWER LOWS AND LOWER HIGHS THAT SUGGESTS A DOWNWARD TREND CHANNELIT IS ANOTHER FOR THE 50 DAY MOVING AVERAGE TO CROSS THROUGH AND BELOW THE 200 DAY MOING AVERAGE.WHEN THIS OCCURS IT IS REFERRED TO AS A “DEATH CROSS” AND IS A FAIRLY RELIABLE CONFIRMATION THAT AN INTERMEDIATE DOWNWARD TRENDD IS IN PLACE.MARKETS AND TRADERS REACT BADLY TO SUCH A TECHNICAL SIGNAL.LET’S EXAMINE THE MARKET TO SEE WHAT WE FIND.
IT IS ONE THING FOR THE MARKETS TO START EXHIBTING AN INITIAL NEW PATTERN OF LOWER LOWS AND LOWER HIGHS THAT SUGGESTS A DOWNWARD TREND CHANNELIT IS ANOTHER FOR THE 50 DAY MOVING AVERAGE TO CROSS THROUGH AND BELOW THE 200 DAY MOING AVERAGE.WHEN THIS OCCURS IT IS REFERRED TO AS A “DEATH CROSS” AND IS A FAIRLY RELIABLE CONFIRMATION THAT AN INTERMEDIATE DOWNWARD TRENDD IS IN PLACE.MARKETS AND TRADERS REACT BADLY TO SUCH A TECHNICAL SIGNAL.LET’S EXAMINE THE MARKET TO SEE WHAT WE FIND.
IT IS ONE THING FOR THE MARKETS TO START EXHIBTING AN INITIAL NEW PATTERN OF LOWER LOWS AND LOWER HIGHS THAT SUGGESTS A DOWNWARD TREND CHANNELIT IS ANOTHER FOR THE 50 DAY MOVING AVERAGE TO CROSS THROUGH AND BELOW THE 200 DAY MOING AVERAGE.WHEN THIS OCCURS IT IS REFERRED TO AS A “DEATH CROSS” AND IS A FAIRLY RELIABLE CONFIRMATION THAT AN INTERMEDIATE DOWNWARD TRENDD IS IN PLACE.MARKETS AND TRADERS REACT BADLY TO SUCH A TECHNICAL SIGNAL.LET’S EXAMINE THE MARKET TO SEE WHAT WE FIND.
IT IS ONE THING FOR THE MARKETS TO START EXHIBTING AN INITIAL NEW PATTERN OF LOWER LOWS AND LOWER HIGHS THAT SUGGESTS A DOWNWARD TREND CHANNELIT IS ANOTHER FOR THE 50 DAY MOVING AVERAGE TO CROSS THROUGH AND BELOW THE 200 DAY MOING AVERAGE.WHEN THIS OCCURS IT IS REFERRED TO AS A “DEATH CROSS” AND IS A FAIRLY RELIABLE CONFIRMATION THAT AN INTERMEDIATE DOWNWARD TRENDD IS IN PLACE.MARKETS AND TRADERS REACT BADLY TO SUCH A TECHNICAL SIGNAL.LET’S EXAMINE THE MARKET TO SEE WHAT WE FIND.