
Empfohlen
Empfohlen
Weitere ähnliche Inhalte
Empfohlen
Empfohlen (20)
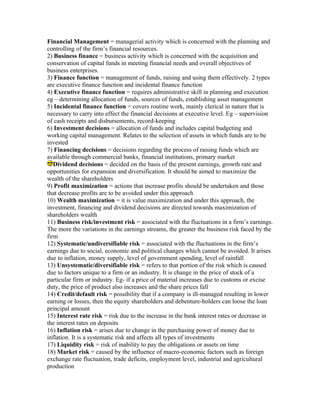
Fm concept testing
- 1. Financial Management = managerial activity which is concerned with the planning and controlling of the firm’s financial resources. 2) Business finance = business activity which is concerned with the acquisition and conservation of capital funds in meeting financial needs and overall objectives of business enterprises. 3) Finance function = management of funds, raising and using them effectively. 2 types are executive finance function and incidental finance function 4) Executive finance function = requires administrative skill in planning and execution eg – determining allocation of funds, sources of funds, establishing asset management 5) Incidental finance function = covers routine work, mainly clerical in nature that is necessary to carry into effect the financial decisions at executive level. Eg – supervision of cash receipts and disbursements, record-keeping 6) Investment decisions = allocation of funds and includes capital budgeting and working capital management. Relates to the selection of assets in which funds are to be invested 7) Financing decisions = decisions regarding the process of raising funds which are available through commercial banks, financial institutions, primary market Dividend decisions = decided on the basis of the present earnings, growth rate and opportunities for expansion and diversification. It should be aimed to maximize the wealth of the shareholders 9) Profit maximization = actions that increase profits should be undertaken and those that decrease profits are to be avoided under this approach 10) Wealth maximization = it is value maximization and under this approach, the investment, financing and dividend decisions are directed towards maximization of shareholders wealth 11) Business risk/investment risk = associated with the fluctuations in a firm’s earnings. The more the variations in the earnings streams, the greater the business risk faced by the firm 12) Systematic/undiversifiable risk = associated with the fluctuations in the firm’s earnings due to social, economic and political changes which cannot be avoided. It arises due to inflation, money supply, level of government spending, level of rainfall 13) Unsystematic/diversifiable risk = refers to that portion of the risk which is caused due to factors unique to a firm or an industry. It is change in the price of stock of a particular firm or industry. Eg- if a price of material increases due to customs or excise duty, the price of product also increases and the share prices fall 14) Credit/default risk = possibility that if a company is ill-managed resulting in lower earning or losses, then the equity shareholders and debenture-holders can loose the loan principal amount 15) Interest rate risk = risk due to the increase in the bank interest rates or decrease in the interest rates on deposits 16) Inflation risk = arises due to change in the purchasing power of money due to inflation. It is a systematic risk and affects all types of investments 17) Liquidity risk = risk of inability to pay the obligations or assets on time 18) Market risk = caused by the influence of macro-economic factors such as foreign exchange rate fluctuation, trade deficits, employment level, industrial and agricultural production
- 2. 19) Political risk = any change in political stability or fiscal policies like taxation laws, custom and excise duties affect the market value of securities 20) Financial risk = connected to the capital structure decision of the firm and depends on the leverage of the firm’s capital structure 21) Marketability risk = arises as certain companies may fail to get their stocks listed in good stock exchanges 22) Management risk = arises due to bad management decisions and involves wrong calculations of the intrinsic value of investment 23) Industry risk = arises due to risk factors like change in taxation policies, licensing policies of the government, RIM support, technology levels 24) Ratio analysis = process of comparison of one figure against another which makes a ratio and it helps in finding the strengths and weaknesses of the operations of the organization 25) Current ratio = measures the short term solvency of the business by comparing the current assets with the current liabilities 26) Quick ratio = immediate solvency of the business position of the company and indicates very short term financial strength, soundness and solvency of a concern 27) Stock working capital ratio = expresses the relationship between closing stock and working capital 28) Proprietary ratio or equity ratio or net worth ratio = measures the relationship between funds invested in the business by the owners with the total funds invested in the business 29) Capital gearing ratio = explains the relationship between fixed term capital and loans carrying fixed rate of dividend/interest 30) Debt-equity ratio = measures the debt and owned funds of a company 31) Gross profit ratio = reflects the operating efficiency and pricing policies of the business 32) Operating profit ratio = indicates the relationship between operating net profits to sales and also indicates the profitability of the business after meeting all operating costs 33) Net profit ratio = indicates the efficiency of financing operations and tax management and shows the overall efficiency of the business 34) Inventory turnover ratio = indicates the number of times the replacements of inventory during the given period usually one year. Higher the ratio, the more efficient is the management of inventory 35) Return on investment ratio = measures the overall performance of the company with regards to the utilization by management of total resources or funds available with the company. It is also known as the ‘return on capital employed’ 36) Return on net worth = measures the productivity of the proprietor’s funds. It is also known as ‘return on proprietors’ funds’ 37) Earning per share = indicates the changes in wealth per shareholder over a period of time. Higher the ratio, higher the possibility of higher dividends and increase in the market price of the share 38) Receivables turnover ratio = indicates the average credit period enjoyed by debtors and efficiency of debtor’s management 39) Interest coverage ratio = reflects the capacity of a business to pay its interest burden 40) Fixed assets turnover ratio = indicates the extent of the utilization of fixed assets
- 3. like plant and machinery by the management 41) Total assets turnover ratio = indicates how the assets are employed overall 42) Price earning ratio = indicates the relationship between market price of a share and the current earnings per share 43) Window dressing = refers to the art of showing the position of an organization at a better level than the existing one i.e. the true value of assets and liabilities is not shown on the balance sheet 44) Financial statements = summarized accounts of the transactions of the organization for and at the end of a particular period. It includes Profit and loss a/c, Balance sheet 45) Financial statement analysis = systematic and specialized treatment of the information found in financial statements so as to derive useful conclusions on the profitability and solvency of the business entity concerned 46) Profitability analysis = users of financial statements may analyse financial statements to decide past and present profitability of the business 47) Liquidity analysis = done by suppliers and money lenders to find out the ability of the company to meet its obligations 48) Solvency analysis = test the ability of the company to repay debts 49) Intra-firm analysis = analysis of performance of the organization over number of years 50) Inter-firm analysis = comparison of 2 or more organizations in terms of various financial variables 51) Standard analysis = one set of financial statements of an organization is analyzed on the basis of standard set for the firm 52) Horizontal analysis = comparison of figures reported in financial statements of 2 or more consecutive years 53) Vertical analysis = comparing figures in the financial statements of a single period 54) Comparative financial statements = facilitate comparison of different accounting variables for drawing useful inferences 55) Common size statements = bring out the ratio of each asset or liability to the total of the balance sheet and the ratio of each item of expense or revenue to net sales 56) Trend percentages = to analyze the trend of data shown in a series of financial statements of several successive years Formulae:- A) Solvency Ratio- 1) Current ratio = Current Assets / Current Liabilities 2) Liquid/Quick/Acid-test ratio = Quick Assets/Quick Liabilities 3) Proprietary Ratio = Proprietor’s funds / total assets * 100 B) Capital Structure Ratio – 1) Debt Equity Ratio = Debt/Equity or Debt / Debt+ Equity 2) Capital gearing ratio = Capital with fixed rate of return / capital not with fixed rate of return C) Turnover (Efficiency) Ratios- 1) Inventory turnover ratio = cost of goods sold/ average stock
- 4. 2) Inventory velocity = average stock / average daily cost of goods sold 3) Debtor’s turnover ratio = credit sales / average (debtors + bills receivables) 4) Debtors’ Velocity (DSO) = Debtors + Bills receivables / average daily credit sales 5) Working turnover ratio = total sales / average working capital D) Profitability ratios – i) In relation to sales: 1) Gross profit ratio = Gross profit/net sales * 100 2) Operating net profit ratio = operating net profit / net sales * 100 3) Material consumption ratio = material consumption / net sales * 100 4) Conversion cost ratio = labor cost + manufacturing cost / net sales * 100 5) Expenses ratio = Each type or item of expenses / net sales * 100 ii) In relation to capital employed – 1) Return of investments (ROI/ROCE) = Net profit before tax or EBIT / capital employed * 100 2) Return on shareholders’ funds = net profit after tax / shareholders’ funds * 100 3) Return on equity = net profit after tax and preference dividend / equity share capital or equity + free reserves E) Other ratios- 1) Interest coverage ratio = EBIT / interest expense 2) Debt – service coverage ratio = EBIT / interest + loan installment 3) Earning per share (EPS) = net profit after tax and preference dividend / number of equity shares 4) Dividend per share(DPS) = Equity dividend / number of equity shares 5) Dividend payout = DPS / EPS 6) Dividend yield = DPS / market price (MPS) 7) Price earning ratio = EPS / MPS Interest coverage ratio = EBIT / Interest 9) Fixed assets turnover ratio = sales / fixed assets Posted in Exam Fundas0 Comme