Net Lease Medical Research Report 2018
•
1 gefällt mir•131 views

Our new net lease medical real estate report has been published by The Boulder Group

Empfohlen
Empfohlen
Weitere ähnliche Inhalte
Was ist angesagt?
Was ist angesagt? (9)
Ähnlich wie Net Lease Medical Research Report 2018
Ähnlich wie Net Lease Medical Research Report 2018 (20)
Mehr von The Boulder Group
Mehr von The Boulder Group (20)
Kürzlich hochgeladen
Kürzlich hochgeladen (20)
Net Lease Medical Research Report 2018
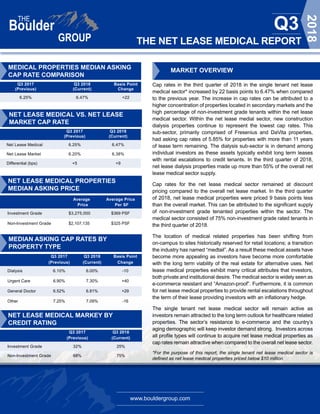
- 1. www.bouldergroup.com THE NET LEASE MEDICAL REPORT Q3 2018 Q3 2017 Q3 2018 Basis Point (Previous) (Current) Change 6.25% 6.47% +22 Q3 2017 Q3 2018 (Previous) (Current) Net Lease Medical 6.25% 6.47% Net Lease Market 6.20% 6.38% Differential (bps) +5 +9 NET LEASE MEDICAL PROPERTIES MEDIAN ASKING PRICE NET LEASE MEDICAL MARKEY BY CREDIT RATING Average Average Price Price Per SF Investment Grade $3,275,000 $369 PSF Non-Investment Grade $2,107,135 $325 PSF Q3 2017 Q3 2018 (Previous) (Current) Investment Grade 32% 25% Non-Investment Grade 68% 75% MEDIAN ASKING CAP RATES BY PROPERTY TYPE MARKET OVERVIEW Cap rates in the third quarter of 2018 in the single tenant net lease medical sector* increased by 22 basis points to 6.47% when compared to the previous year. The increase in cap rates can be attributed to a higher concentration of properties located in secondary markets and the high percentage of non-investment grade tenants within the net lease medical sector. Within the net lease medial sector, new construction dialysis properties continue to represent the lowest cap rates. This sub-sector, primarily comprised of Fresenius and DaVita properties, had asking cap rates of 5.85% for properties with more than 11 years of lease term remaining. The dialysis sub-sector is in demand among individual investors as these assets typically exhibit long term leases with rental escalations to credit tenants. In the third quarter of 2018, net lease dialysis properties made up more than 55% of the overall net lease medical sector supply. Cap rates for the net lease medical sector remained at discount pricing compared to the overall net lease market. In the third quarter of 2018, net lease medical properties were priced 9 basis points less than the overall market. This can be attributed to the significant supply of non-investment grade tenanted properties within the sector. The medical sector consisted of 75% non-investment grade rated tenants in the third quarter of 2018. The location of medical related properties has been shifting from on-campus to sites historically reserved for retail locations; a transition the industry has named “medtail”. As a result these medical assets have become more appealing as investors have become more comfortable with the long term viability of the real estate for alternative uses. Net lease medical properties exhibit many critical attributes that investors, both private and institutional desire. The medical sector is widely seen as e-commerce resistant and “Amazon-proof”. Furthermore, it is common for net lease medical properties to provide rental escalations throughout the term of their lease providing investors with an inflationary hedge. The single tenant net lease medical sector will remain active as investors remain attracted to the long term outlook for healthcare related properties. The sector’s resistance to e-commerce and the country’s aging demographic will keep investor demand strong. Investors across all profile types will continue to acquire net lease medical properties as cap rates remain attractive when compared to the overall net lease sector. *For the purpose of this report, the single tenant net lease medical sector is defined as net lease medical properties priced below $10 million. Q3 2017 Q3 2018 Basis Point (Previous) (Current) Change Dialysis 6.10% 6.00% -10 Urgent Care 6.90% 7.30% +40 General Doctor 6.52% 6.81% +29 Other 7.25% 7.09% -16 MEDICAL PROPERTIES MEDIAN ASKING CAP RATE COMPARISON NET LEASE MEDICAL VS. NET LEASE MARKET CAP RATE
- 2. www.bouldergroup.com THE NET LEASE MEDICAL REPORT Q3 2018 Years Urgent General Remaining Dialysis Care Medical1 Other2 16-20 Years -- 7.13% 6.75% N/A 11-15 Years 5.85% 7.25% 6.85% 6.00% 6-10 Years 6.45% 7.75% 7.15% 7.00% 5 Years & Under 7.25% 8.15% N/A 7.75% NET LEASE MEDICAL PROPERTIES MEDIAN ASKING CAP RATE BY REGION MEDIAN ASKING CAP RATE BY LEASE TERM REMAINING 1) The General Medical category consists of physicians and specialty offices. 2) The Other category consists of dental and physical therapy offices and homecare facilities. WEST MOUNTAIN MIDWEST SOUTH NO RTHEAST 6.38% WEST MOUNTAIN MIDWEST SOUTH NO RTHEAST 5.50% 6.50% 6.60% 6.00%
- 3. www.bouldergroup.com THE NET LEASE MEDICAL REPORT Q3 2018 SELECTED NET LEASE MEDICAL SALES COMPARABLES © 2018. The Boulder Group. Information herein has been obtained from databases owned and maintained by The Boulder Group as well as third party sources. We have not verified the information and we make no guarantee, warranty or representation about it. This information is provided for general illustrative purposes and not for any specific recommendation or purpose nor under any circumstances shall any of the above information be deemed legal advice or counsel. Reliance on this information is at the risk of the reader and The Boulder Group expressly disclaims any liability arising from the use of such information. This information is designed exclusively for use by The Boulder Group clients and cannot be reproduced, retransmitted or distributed without the express written consent of The Boulder Group. FOR MORE INFORMATION John Feeney | Senior Vice President john@bouldergroup.com Scott Harris | Senior Analyst scott@bouldergroup.com Jeff Weil | Analyst jeff@bouldergroup.com CONTRIBUTORS Randy Blankstein | President randy@bouldergroup.com Jimmy Goodman | Partner jimmy@bouldergroup.com AUTHOR Sale Date Tenant City State Price Price/SF Cap Rate Lease Term Remaining Jul-18 VA Central Iowa Healthcare Knoxville IA $7,309,946 $437 PSF 6.66% 15 Jun-18 HealthEast Medical St. Paul MN $5,590,000 $358 PSF 7.25% 7 Jul-18 DaVita Glendale CA $5,145,455 $674 PSF 5.21% 15 Aug-18 DaVita Corpus Christi TX $4,900,000 $618 PSF 5.73% 10 Aug-18 Fresenius Corpus Christi TX $4,200,000 $428 PSF 5.85% 14 Aug-18 Satelite Healthcare Stockton CA $4,166,500 $403 PSF 6.25% 12 Aug-18 Carolina's Hospital System Florence SC $4,100,000 $186 PSF 6.93% 9 Oct-18 DaVita Decatur GA $4,004,787 $375 PSF 6.12% 15 Oct-18 DaVita South Holland IL $3,707,000 $382 PSF 6.03% 15 Oct-18 Fresenius Brownsville TX $2,900,000 $282 PSF 6.19% 9 Aug-18 Fresenius Akron OH $2,123,642 $245 PSF 5.50% 20 Aug-18 Fresenius Houston TX $2,102,523 $256 PSF 5.35% 20 Sep-18 Ivy Rehab Physical Therapy Center Norton Shores MI $1,540,000 $111 PSF 9.02% 7