Net Lease Auto Parts Report 2019
•
1 gefällt mir•138 views

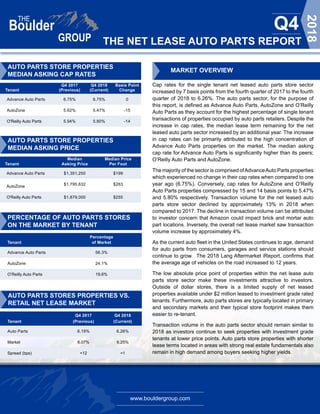
Cap rates for auto parts stores increased slightly in Q4 2018 compared to Q4 2017. Advance Auto Parts properties made up over half of auto parts properties on the market and had significantly higher asking cap rates than AutoZone and O'Reilly Auto Parts properties. Transaction volume declined in 2018 for the auto parts sector while remaining flat for the overall net lease market. Auto parts stores remain attractive investments due to their relatively low price points and investment grade tenants.

Empfohlen
Empfohlen
Weitere ähnliche Inhalte
Was ist angesagt?
Was ist angesagt? (14)
Ähnlich wie Net Lease Auto Parts Report 2019
Ähnlich wie Net Lease Auto Parts Report 2019 (20)
Mehr von The Boulder Group
Mehr von The Boulder Group (20)
Kürzlich hochgeladen
Kürzlich hochgeladen (20)
Net Lease Auto Parts Report 2019
- 1. www.bouldergroup.com THE NET LEASE AUTO PARTS REPORT Q4 2018 Q4 2017 Q4 2018 Basis Point Tenant (Previous) (Current) Change Advance Auto Parts 6.75% 6.75% 0 AutoZone 5.62% 5.47% -15 O'Reilly Auto Parts 5.94% 5.80% -14 Median Median Price Tenant Asking Price Per Foot Advance Auto Parts $1,351,250 $199 AutoZone $1,795,632 $263 O'Reilly Auto Parts $1,879,000 $255 PERCENTAGE OF AUTO PARTS STORES ON THE MARKET BY TENANT Percentage Tenant of Market Advance Auto Parts 56.3% AutoZone 24.1% O’Reilly Auto Parts 19.6% AUTO PARTS STORES PROPERTIES VS. RETAIL NET LEASE MARKET MARKET OVERVIEW Cap rates for the single tenant net leased auto parts store sector increased by 7 basis points from the fourth quarter of 2017 to the fourth quarter of 2018 to 6.26%. The auto parts sector, for the purpose of this report, is defined as Advance Auto Parts, AutoZone and O’Reilly Auto Parts as they account for the highest percentage of single tenant transactions of properties occupied by auto parts retailers. Despite the increase in cap rates, the median lease term remaining for the net leased auto parts sector increased by an additional year. The increase in cap rates can be primarily attributed to the high concentration of Advance Auto Parts properties on the market. The median asking cap rate for Advance Auto Parts is significantly higher than its peers; O’Reilly Auto Parts and AutoZone. The majority of the sector is comprised ofAdvanceAuto Parts properties which experienced no change in their cap rates when compared to one year ago (6.75%). Conversely, cap rates for AutoZone and O’Reilly Auto Parts properties compressed by 15 and 14 basis points to 5.47% and 5.80% respectively. Transaction volume for the net leased auto parts store sector declined by approximately 13% in 2018 when compared to 2017. The decline in transaction volume can be attributed to investor concern that Amazon could impact brick and mortar auto part locations. Inversely, the overall net lease market saw transaction volume increase by approximately 4%. As the current auto fleet in the United States continues to age, demand for auto parts from consumers, garages and service stations should continue to grow. The 2018 Lang Aftermarket iReport, confirms that the average age of vehicles on the road increased to 12 years. The low absolute price point of properties within the net lease auto parts store sector make these investments attractive to investors. Outside of dollar stores, there is a limited supply of net leased properties available under $2 million leased to investment grade rated tenants. Furthermore, auto parts stores are typically located in primary and secondary markets and their typical store footprint makes them easier to re-tenant. Transaction volume in the auto parts sector should remain similar to 2018 as investors continue to seek properties with investment grade tenants at lower price points. Auto parts store properties with shorter lease terms located in areas with strong real estate fundamentals also remain in high demand among buyers seeking higher yields. Q4 2017 Q4 2018 Tenant (Previous) (Current) Auto Parts 6.19% 6.26% Market 6.07% 6.25% Spread (bps) +12 +1 AUTO PARTS STORE PROPERTIES MEDIAN ASKING PRICE AUTO PARTS STORE PROPERTIES MEDIAN ASKING CAP RATES
- 2. www.bouldergroup.com THE NET LEASE AUTO PARTS REPORT Q4 2018 AUTO PARTS STORES MEDIAN ASKING CAP RATES WEST MOUNTAIN MIDWEST SOUTH NO RTHEAST 6.22% 6.00% 6.41% 6.45% 5.30% WEST MOUNTAIN MIDWEST SOUTH NO RTHEAST
- 3. www.bouldergroup.com THE NET LEASE AUTO PARTS REPORT Q4 2018 SELECT SINGLE TENANT AUTO PARTS STORES SALES COMPARABLES MEDIAN ASKING CAP RATES BY LEASE TERM REMAINING Years Remaning Advance Auto Parts AutoZone O’Reilly Auto Parts Under 5 7.75% 7.00% 7.05% 6-9 7.00% 6.28% 6.60% 10-14 6.22% 5.60% 6.08% 15-17 5.85% 5.35% 5.70% 18-20 N/A 5.25% 5.30% Lease Term Sale Date Tenant City State Price Price S.F. Cap Rate Remaining Nov-18 O'Reilly Auto Parts Tamarac FL $2,825,000 $379 5.47% 20 Aug-18 Advance Auto Parts Okatie SC $2,645,000 $379 5.75% 10 Dec-18 Advance Auto Parts Cary NC $2,200,000 $317 6.75% 5 Nov-18 O'Reilly Auto Parts Spanish Fort AL $2,155,500 $299 5.70% 20 Oct-18 AutoZone Chesterfield MI $1,819,000 $238 6.35% 10 Sep-18 Advance Auto Parts Austin TX $1,750,000 $250 7.68% 5 Sep-18 AutoZone Lakewood WA $1,600,000 $296 5.23% 10 Sep-18 Advanace Auto Parts Pueblo CO $1,480,000 $218 6.75% 11 Sep-18 Advanace Auto Parts Palmview TX $1,300,000 $186 10.80% 3 Oct-18 O'Reilly Auto Parts Defuniak Springs FL $1,125,000 $212 6.15% 13 Nov-18 O'Reilly Auto Parts Monahans TX $1,050,000 $164 6.28% 10
- 4. www.bouldergroup.com THE NET LEASE AUTO PARTS REPORT Q4 2018 © 2019. The Boulder Group. Information herein has been obtained from databases owned and maintained by The Boulder Group as well as third party sources. We have not verified the information and we make no guarantee, warranty or representation about it. This information is provided for general illustrative purposes and not for any specific recommendation or purpose nor under any circumstances shall any of the above information be deemed legal advice or counsel. Reliance on this information is at the risk of the reader and The Boulder Group expressly disclaims any liability arising from the use of such information. This information is designed exclusively for use by The Boulder Group clients and cannot be reproduced, retransmitted or distributed without the express written consent of The Boulder Group. AUTO PARTS STORES COMPANY COMPARISONS Advance Auto Parts AutoZone O’Reilly Auto Parts Credit Rating BBB- (Stable) BBB (Stable) BBB+ (Stable) Market Cap $13 billion $22.9 billion $27.7 billion Revenue $9.37 billion $11.2 billion $8.98 billion Number of Stores 5,200 6,000 5,147 Typical Lease Term 15 year primary term with fifteen years of options 15 or 20 year primary term with twenty years of options 20 year primary term with twenty years of options FOR MORE INFORMATION John Feeney Senior Vice President john@bouldergroup.com Scott Harris | Senior Analyst scott@bouldergroup.com Jeff Weil | Analyst jeff@bouldergroup.com CONTRIBUTORS Randy Blankstein | President randy@bouldergroup.com Jimmy Goodman | Partner jimmy@bouldergroup.com AUTHOR