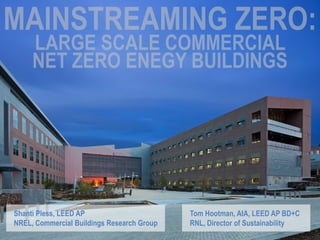
Mainstreaming zero uli fall meeting 2012
•
2 gefällt mir•458 views

Presentation on mainstreaming net zero energy for commercial buildings given at the ULI Fall Meeting 2012 in Denver, CO with Shanti Pless (NREL)

Empfohlen
Weitere ähnliche Inhalte
Andere mochten auch
Ähnlich wie Mainstreaming zero uli fall meeting 2012
Ähnlich wie Mainstreaming zero uli fall meeting 2012 (20)
Kürzlich hochgeladen
Kürzlich hochgeladen (20)
Mainstreaming zero uli fall meeting 2012
- 1. Shanti Pless, LEED AP Tom Hootman, AIA, LEED AP BD+C NREL, Commercial Buildings Research Group RNL, Director of Sustainability
- 3. WHO IS PURSUING NET ZERO ENERGY?
- 4. 1 1 1 1 2 1 1 1 6 1 1 1 1 New Buildings Institute Getting to Zero 2012 Status Update: A First Look at the Costs and Features of 2 Zero Energy Commercial Buildings (March 2012)
- 5. 1 1 1 1 2 1 1 1 6 1 1 1 1 New Buildings Institute Getting to Zero 2012 Status Update: A First Look at the Costs and Features of 2 Zero Energy Commercial Buildings (March 2012)
- 6. 1 1 1 1 2 1 1 1 6 1 1 1 1 New Buildings Institute Getting to Zero 2012 Status Update: A First Look at the Costs and Features of 2 Zero Energy Commercial Buildings (March 2012)
- 7. California PUC 2030 Massachusetts 2030 Federal / EISA 2030 ASHRAE Vision 2020 2030 Challenge Living Building Challenge
- 8. 13 11 19 5 1K-5K 5K-10K 10K-25K 25K-50K 8 50K-100K 4 >100K New Buildings Institute Getting to Zero 2012 Status Update: A First Look at the Costs and Features of Zero Energy Commercial Buildings (March 2012)
- 9. NREL – RESEARCH SUPPORT FACILITY NREL – RESEARCH SUPPORT FACILITY II SMUD – CAMPUS OPERATIONS SINGAPORE – CASE STUDY
- 11. DOE / NREL: Client Haselden Construction: General Contractor RNL: Architecture, Interiors, Landscape, Lighting Stantec: MEP Engineering, Energy Modeling KL&A: Structural Engineering Martin/Martin: Civil Engineering AEC: LEED, Daylight Modeling, Commissioning Namaste Solar: Solar Consultant
- 12. Federal Office Building $64M Firm Fixed Price 222,000 SF $57.4M Construction 822 Occupants Complete June 2010
- 15. Project objectives Absolute energy target Risk / reward / control balance Substantiation Incentive award fee
- 16. I want a green building Design a LEED <rating> building Design a building to use 30% less energy than ASHRAE 90.1-2004 Design a building to use less than 25,000 BTU/sqft Design a net zero energy building
- 17. PREDICTIVE MODELING (Absolute energy target) VERSUS COMPLIANCE MODELING (Percent better than ASHRAE 90.1)
- 18. New Buildings Institute Energy Performance of LEED for New Construction Buildings (March 2008)
- 24. Cost per Square Foot Gold Silver Other $- $100 $200 $300 $400 $500 $600 Certified Platinum Heifer International Center NVCI Cancer Research Kitsap County Admin Building The Signature Centre Great River Energy Headquarters Ft. Carson Brigade/Battalion HQ NREL Research Support Facility International Fund for Animal Welfare RSF Cost: $259/SF Omega Center Chevron Office Bremerton BEQ University of Denver Sturm College Naval Facilities Ft. Lewis Barracks and Dinning Dillard University EPA Region 8 Headquarters Fernald Visitors Center Average Cost: $334/SF Commerce City Civic Center Leo Trombatore Office ASU School of Journalism ASU College of Nursing & Health Federal Reserve Bank of Kansas City Leprino Building San Joaquin Admin Building Las Cruces Courthouse NASA Sustainability Base Applied Research & Development Aircraft RSF National Association of Realtors Oregon Sustainability Fort Bragg Forces Command HQ San Joaquin Comm. College DC Federal Building Source: DBIA Project Database
- 26. Net Zero Site Energy Building Net Zero Source Energy Building Net Zero Energy Emissions Building Net Zero Energy Cost Building
- 27. Demand-Side: Reduce site energy though low-energy building technologies On-Site Supply: Renewable energy within building footprint Renewable energy within site Off-Site Supply: Renewable energy off site to generate energy on site Purchase off-site renewable energy sources
- 28. Baseline Energy Use Passive Design Reduced Energy Use
- 29. Dramatically Reduced Efficient Systems Energy Use Renewable Energy
- 33. Energy driven form Conventional form 115,000 SF 65,000 SF
- 35. <30% >70% Window to Wall Ratio Window to Wall Ratio
- 38. Ambient lighting with daylight sensors for 25 fc Ambient daylight 6 watt task light 50 fc
- 51. Source: NREL, “Reducing Plug and Process Loads for a Large Scale, Low Energy Office Building: NREL’s Research Support Facility”
- 56. RSF II RSF RSF Staff Parking RSF Visitor Parking
- 57. New Building = 35 kBtu/SF/year Leased Building = 133 kBtu/SF/year Annual Energy Savings = $275,590
- 58. 20 Year NPV = $4.4M or $20/SF 30 Year NPV = $6.0M or $27/SF
- 61. Measured Versus Modeled Monthly and Cumulative EUI 4.5 36 The PV system is sized for an annual EUI of 35.1 kBtu/ft2. 4.0 32 3.5 28 PV 3.0 24 Data Center Annual EUI (kBtu/ft2) Mechanical Systems Plug Loads 2.5 20 Monthly EUI (kBtu/ft2) Lighting Heating 2.0 16 Cooling Model Annual EUI RSF Annual EUI 1.5 12 1.0 8 Credit: Chad Lobato/NREL 0.5 4 0.0 0 RSF RSF RSF RSF RSF RSF RSF RSF RSF RSF RSF RSF Model PV Model PV Model PV Model PV Model PV Model PV Model PV Model PV Model PV Model PV Model PV Model PV Note: The annual EUI values are demand side values and do not include the 61 Innovation for Our Energy Future
- 62. October 2010 – September 2011 Lighting Power Density 0.35 0.33 0.30 0.28 0.25 Model Average October 2010 0.23 November 2010 Power Density (W/ft2) 0.20 December 2010 January 2011 0.18 February 2011 March 2011 0.15 April 2011 0.13 May 2011 June 2011 0.10 July 2011 August 2011 0.08 September 2011 0.05 0.03 0.00 0 2 4 6 8 10 12 14 16 18 20 22 24 Credit: Chad Lobato/NREL Time of Day Innovation for Our Energy Future
- 63. October 2010 – September 2011 Plug Load Power Density 0.65 0.60 0.55 0.50 0.45 0.40 Power Density (W/ft2) 0.35 Credit: Matthew Luckwitz/NREL 0.30 Model Average October 2010 0.25 November 2010 December 2010 0.20 January 2011 February 2011 0.15 March 2011 0.10 April 2011 May 2011 0.05 June 2011 July 2011 0.00 August 2011 0 2 4 6 8 10 12 14 16 18 20 22 24 September 2011 Credit: Chad Lobato/NREL Time of Day Note: The elevators are included in the plug loads Innovation for Our Energy Future
- 65. WHAT ARE THE BEST PRACTICES?
- 66. 1 Performance-based procurement 2 Predicting energy use 3 Passive architecture and load reduction 4 Low energy active systems 5 Integrated renewable energy 6 Zero energy operation
- 67. WHO IS PURSUING NET ZERO ENERGY?