Roadmap to Membership of RICS - Pathways and Routes
Steram dicharge measurement
1. Discharge measurement using current meter by SOK Ty, Layheang Song, CHHIN Rattana
1
Table of Contents
1. Introduction.........................................................................................................................................................2
1.1- Stream discharge........................................................................................................................................2
1.2- Current meter...............................................................................................................................................2
2. Literature review..............................................................................................................................................3
3. Method.....................................................................................................................................................................3
3.1- Dividing section........................................................................................................................................4
3.1.1- Mid-section method.........................................................................................................................4
3.1.2- Mean section method ......................................................................................................................5
3.2- Velocity measurement..........................................................................................................................5
3.2.1- one point method (six-tenth depth method).......................................................................5
3.2.2- two point method..............................................................................................................................6
3.2.3- three point method...........................................................................................................................7
3.2.4- surface method...................................................................................................................................8
4. Data and calculation .......................................................................................................................................8
4.1- Data ...................................................................................................................................................................8
4.2- Calculation..................................................................................................................................................10
5. Discussion...........................................................................................................................................................13
6. Conclusion..........................................................................................................................................................13
2. Discharge measurement using current meter by SOK Ty, Layheang Song, CHHIN Rattana
2
1. Introduction
1.1- Stream discharge
Discharge is a volume of water passing across one section per unit. Generally, it’s
represented as “Q”. It’s determined by the multiplication of the cross section “S” and the
velocity “v”. The rate of the discharge is varies by location of the stream because of the
catchment area and water lost. And also it’s varies because of the time, it means that in the
dry season, the discharge is absolutely difference from the rainy season because of the
amount of the precipitation. About its unit in the international system, SI, it’s express as
cubic meter per second “m3/s” but in a large total amount of water such as in a river or in
the big stream in a year the unit as million cubic meter per year “mcm/year”. In the
country in Europe and America, the cubic feet per second (cfs) is used for the unit of the
discharge.
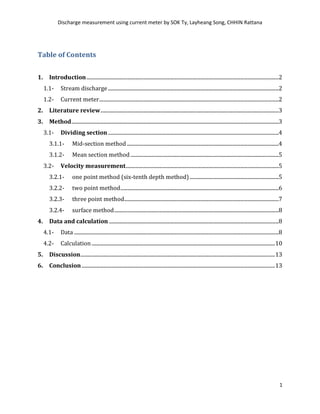
1.2- Current meter
Current meter is the most common used equipment for measuring the velocity in
the stream which contains the depth of water less than 1.5m. This equipment can measure
the velocity and the water depth to determine the cross section in the large length but
shallow because of the difficulties of the procedure.
Figure1.2: current meter model 01
Current meter model 01 (figure 1.2) can measure the velocity in the range of 0.03 m/s
to 10m/s and with the size of 125mm diameter by 270mm pitch (user guide current meter,
Velapot).
3. Discharge measurement using current meter by SOK Ty, Layheang Song, CHHIN Rattana
3
2. Literature review
The stream discharge must be calculated by the average velocity and the cross
sectional area of the stream, in generally:
Where:
- “Q” is the stream discharge, usually in “m3/s”
- “v” is the average cross sectional velocity, usually in “m/s”
- “S” is the total cross section , usually in “m”
In the real condition, the situation of the cross section in the stream is not as the
theory. As usual when the length of the cross section is so long, we have to divide it as many
sub-section according to the real situation of the stream. For the average velocity is also
according to the sub-section. So the total stream discharge is:
Where:
-“Q” is the total stream discharge
-“Si” is the each sub-cross section
-“vi” is the each average velocity
-“n” is the number of the section that we have divided
There are difference method for determine sub-section and the average velocity that are
going to describe in the next section.
3. Method
Because of the variation of the bottom of the stream, the large cross section and slope the
stream bank, we have to divide the total cross section into sub-area. For determining the
discharge, we need velocity of each sub-area. There are two methods for determination the
sub area and few methods for determination the average velocity.
Q v S
1
n
i i
i
Q S v
4. Discharge measurement using current meter by SOK Ty, Layheang Song, CHHIN Rattana
4
3.1- Dividing section
“Mean section method” and “Mid-section method” are the most efficiency method
for the dividing cross section (M.A KKAN, et al, 1997). Both mean section method and mid-
section method will give nearly the identical result for a flow cross section. In the figure 3.1
will show about the difference between the mean section method and mid-section method.
Figure 3.1: mean section and mid-section method
In this figure
b1, b3: the length of sub-section
d1, d2; d3: the observation water depth
3.1.1- Mid-section method
In the mid-section method of computing a current meter measurement, it is
assumed that the velocity sample at each vertical presents the mean velocity in the
rectangular sub-section (figure 3.1). We have to calculate the area of the sub-cross section
in assumption as rectangular:
“V average”is the velocity average in the mid-section of the assumption rectangular.
3 3average averageq s v d b v
5. Discharge measurement using current meter by SOK Ty, Layheang Song, CHHIN Rattana
5
3.1.2- Mean section method
For the cross section having the irregular, that is advantage in using the mean
section method. There are some difficulties in the calculation the discharge in the first and
the last section. Figure 3.1 is the determination of the mean section method.
3.2- Velocity measurement
The vertical mean velocity in the river or in the steam can be measured in the
variety methods. The velocity profile of the section is usually measured at a particular
fraction of the depth (h) of the measurement area (figure 3.2). Including, one point method,
two point method, tree point method, surface method are the varieties methods for
computing the average vertical velocity (M.A KKAN et al. Sep 1997).
Figure 3.2: vertical velocity
3.2.1- one point method (six-tenth depth method)
For the shallow depth, we can consider that the depth is less than 75cm for a large
current meter or 45cm for a small one, one point method, sometimes is called six-tenth
depth method, is the mostly used. A current meter measurement is taken singly at 60% of
the water depth from the water surface (figure 3.2.1).
1 21 2
3
2 2
average average
average
v vd d
q s v b
6. Discharge measurement using current meter by SOK Ty, Layheang Song, CHHIN Rattana
6
Figure 3.2.1: velocity is taken at 60% of “h” for one point method
3.2.2- two point method
The most common methodology for establishing the vertical mean velocity is two
point methods. The mean velocity is taken from the 20% and 80% of the water depth from
the water surface (figure 3.2.2). It’s always used in the measurement in the downstream
from the structure because of the velocities at this location is varies according to the depth.
The average of the two measurements is determined as the mean velocity:
80% 20%
2
at at
average
v v
v
7. Discharge measurement using current meter by SOK Ty, Layheang Song, CHHIN Rattana
7
Where:
- “V average” is the average velocity for establishing the discharge
- “V at 80%” is the velocity which we have to measure at 80% of the depth
- “V at 20%” is the velocity which we have to measure at 20% of the depth
3.2.3- three point method
Three point method combine two point method and one point method (six-tenth
depth method. Therefore, current meter measurements are taken at 20%, 60% and 80% of
the flow depth from the top (figure 3.2.3). The mean velocity in vertical obtain by the first
average of 80% and 20% of total “h” then averaging this result with the velocity at 60% of
the vertical flow depth.
Figure 3.2.3: measured depth of 3 point method
Thus, the mean velocity of the vertical depth would be:
The flow depth should exceed 0.76m when considering the use of this method
(USGS, 1980).
0.2 0.8
0.6
2
2
v v
v
v
8. Discharge measurement using current meter by SOK Ty, Layheang Song, CHHIN Rattana
8
3.2.4- surface method
The surface velocity can be measured easily with a stopwatch and small floats
(small enough that their movement is unaffected by wind, e.g. ping pong balls). A surveying
tape is needed to measure the river/stream width and the distance traveled.
Figure 3.2.4: surface method
Surface method is used in the stream where the current meter is incapable to use
because of the water depth and the velocities are too slow (USGS, 1980).
4. Data and calculation
In this section, we have two data for the Chrey Bak stream, downstream data and the
upstream data, which are measured on 09-August-2012 by ITC team which works on the
project of Suspended sediment dynamic in the tributary of Tonle Sap Lake basin: the case
of Chey bak river catchment in Kampong Chhnang led by Dr. OEURNG Chantha. This section
also shows how to apply the each method that has been shown in the section above.
4.1- Data
All these two data are the data of the Chrey Bak stream on the day of 9-August-2012.
Table 4.1a is the upstream data of the current meter measurement. It’s has been provided
into 13sections and measured at 20% and 80% of the vertical depth. Table 4.1b is the
downstream data of current meter measurement. It has been provided it into 20 sections
and measured at 20% and 80% of the vertical depth due to the water depth is not so large.
And the figure 4.1a and 4.1b is represented the profile of these two sections.
9. Discharge measurement using current meter by SOK Ty, Layheang Song, CHHIN Rattana
9
Table 4.1a: data of current meter mearement at Chrey Bak stream’s upstream on 9-Aug-12
Table 4.1b: data of current meter mearement at Chrey Bak stream’s outlet on 9-Aug-2012
10. Discharge measurement using current meter by SOK Ty, Layheang Song, CHHIN Rattana
10
Figure 4.1a: cross section profile of the upstream
Figure 4.1b: cross section of the outlet
4.2- Calculation
In this section of calculation, the discharge of the stream in each section must be
calculated by difference methodology. The discharge at the outlet will be determined by
mid-section method and the average velocities are established by 2 point method.
There are 5 steps:
Diving the cross section into sub-section
Assuming all the sub-section into rectangular but some section should be
triangular
Calculate the area of the sub-section
Determine the average velocities of each section
Calculate the discharge of each section and then sum these discharge
11. Discharge measurement using current meter by SOK Ty, Layheang Song, CHHIN Rattana
11
Step1: diving the cross section into sub-section
Step2: Assuming the sub-section to rectangular and to triangular
Step 3, 4 and 5: Calculate the area of the sub-section, determine the average velocities of
each section and calculate the discharge of each section and then sum these discharge
12. Discharge measurement using current meter by SOK Ty, Layheang Song, CHHIN Rattana
12
The discharge at the outlet will be determined by mean-section method and the
average velocities are established by 2 point method.
There are 4 steps:
Diving the cross section into sub-section
Calculate the area of the sub-section
Determine the average velocities of each section
Calculate the discharge of each section and then sum these discharge
Step1: diving the cross section into sub-section
Step 2, 3 and 4: Calculate the area of the sub-section, determine the average velocities of
each section and calculate the discharge of each section and then sum these discharge
13. Discharge measurement using current meter by SOK Ty, Layheang Song, CHHIN Rattana
13
5. Discussion
According the calculation, we see the discharge of the outlet of the Chrey Bak stream is
6.914m3/s and the upstream is 5.522m3/s at the same time, 9-August-2012. The discharge
of the downstream is must be greater than the upstream as in the introduction have been
explained. Even thought, there are the relations between positions in the streams due to
most of the discharge (except the water lost in some cases) in the upstream always
cumulates to the downstream. We can find the relation between the discharge by location
(outlet and upstream) by finding the rating curve. A rating curve is constructed by graphing
several manually derived discharge measurements. The discharge in the outlet, also in the
upstream, are also can calculate by using the rating curve too. But for determination the
rating curve, we must measure the discharge frequently and regularly, especially the
discharge which reaches the peak and the minimum to make the rating curve more precise.
6. Conclusion
Water in a channel flows are difference rate depending on its location and time. The
discharge (flow) cannot be measured directly in a river or stream like it can from a pipe or
hose because the rate is too high and its profile. So the area of the cross section is divided
into sub-sections, with one or more measurements taken for each. To reach to the real
value of the discharge, we should divide into more and more small sections and measure
carefully to get the precise values. All the application of methodologies must be done by its
advantages, advantages and the suitable condition.
Reference:
- ENG5300 Engineering Applications in the Earth Sciences: Measuring River
Discharge, John S. Gierke, Ph.D., P.E.
- Current meter discharge measurement for steady and unsteady flow in irrigation
channel, MUSHTAQ A.KHAN, K.MAHMOD, G.V SKOGROBE, Sept 1997.
- www.valeport.co.uk