SlideShare ist ein Scribd-Unternehmen logo
1 von 4
Downloaden Sie, um offline zu lesen
Sponsored by                                                             The STORES Top 100 Retailers are ranked by annual revenues as
                                                                                          reported in SEC filings, public statements
                                                                                          by the companies and, where noted, esti-
                                                                                          mates based on Planet Retail research.


        Company                            Headquarters                2008 Revenue   Y/Y        2008 Earnings        Y/Y            No. of      Y/Y
Rank


                                                                       (000)          Change     (000)                Change         Stores      Change

  1     Wal-Mart                           Bentonville, Ark.           $405,607,000    7.2%        $13,400,000           5.3%          7,873         8.4%


  2     Kroger                             Cincinnati                    76,000,000    8.2            1,249,000          5.8           3,654        -0.2


  3     Costco                             Issaquah, Wash.               72,483,020   12.6            1,282,725         18.5             544         5.0


  4     Home Depot                         Atlanta                       71,288,000    -7.8           2,260,000        -48.6           2,274         1.8


  5     Target                             Minneapolis                   64,948,000    2.5            2,214,000        -22.3           1,682         5.7


  6     Walgreen                           Deerfield, Ill.               59,034,000    9.8            2,157,000          5.7           6,934        15.6


  7     CVS Caremark                       Woonsocket, R.I.              48,989,900    8.7                  N.A.         N.A.          6,981        10.8


  8     Lowe’s                             Mooresville, N.C.             48,230,000    -0.1           2,195,000        -21.9           1,649         7.5


  9     Sears Holdings                     Hoffman Estates, Ill.         46,770,000    -7.8              53,000        -93.6           3,918         1.8


 10     Best Buy                           Richfield, Minn.              45,015,000   12.5            1,003,000        -28.7           3,942      200.0


 11     SUPERVALU                          Eden Prairie, Minn.           44,564,000    1.2           -2,855,000          N.A.          2,421        -2.1


 12     Safeway                            Pleasanton, Calif.            44,104,000    4.3              965,300          8.7           1,739        -0.2


 13     Rite Aid                           Camp Hill, Pa.                26,289,268    8.1           -2,915,420          N.A.          4,901        -2.5


 14     Macy’s                             Cincinnati                    24,892,000    -5.4          -4,803,000          N.A.            847        -0.7


 15     Publix                             Lakeland, Fla.                23,929,064    4.0            1,089,770          -8.0          1,044         7.4


 16     McDonald’s                         Oak Brook, Ill.               23,522,400    3.2            4,313,200         80.1         31,967          1.9


 17     Ahold USA                          Chantilly, Va.                21,830,000    4.0                  N.A.         N.A.            711         0.9


 18     Delhaize America                   Salisbury, N.C.               19,239,000    5.9                  N.A.         N.A.          1,594         1.5


 19     Amazon.com                         Seattle                       19,166,000   29.2              645,000         35.5              —         N.A.


 20     TJX                                Framingham, Mass.             18,999,505    1.9              880,617         14.1           2,652         3.5


 21     J.C. Penney                        Plano, Texas                  18,486,000    -6.9             572,000        -48.5           1,093         2.4


 22     7-Eleven(e)                        Dallas                        16,681,000   14.9                  N.A.         N.A.          6,320         1.7


 23     Pilot Travel Centers(e)            Knoxville, Tenn.              16,500,000   32.0                  N.A.         N.A.            342         5.9


 24     Kohl’s                             Menomonee Falls, Wis.         16,389,000    -0.5             885,000        -18.4           1,004         8.1


 25     Alimentation Couche Tard(p) Laval, Quebec                        15,583,000    1.4                  N.A.         N.A.          5,480         7.1


N.A. Not available or not applicable   (e) estimate   (p) projection                                                                Source: planetretail.net


24 STORES / JULY 2009                                                                                                                 WWW.STORES.ORG
Sponsored by


        Company                             Headquarters                2008 Revenue   Y/Y      2008 Earnings   Y/Y          No. of      Y/Y
Rank


                                                                        (000)          Change   (000)           Change       Stores      Change

  26     H.E.B.(e)                          San Antonio                  $14,647,680    8.5%             N.A.     N.A.          322         3.5%


  27     Gap                                San Francisco                 14,526,000    -7.8        $967,000     16.1%         3,149       -0.6


  28     Meijer (e)                         Grand Rapids, Mich.           14,321,000     3.2             N.A.     N.A.          186         2.8


  29     Staples                            Framingham, Mass.             14,153,851    10.9             N.A.     N.A.         2,218        8.8


  30     Toys “R” Us                        Wayne, N.J.                   13,724,000    -0.5         218,000      42.5         1,559       -0.1


  31     Love’s                             Oklahoma City                 12,450,000     8.6             N.A.     N.A.          220         6.8


  32     Dell Global Consumer               Round Rock, Texas             11,529,000    11.1             N.A.     N.A.            —       N.A.


  33     Yum! Brands                        Louisville, Ky.               11,279,000     8.3         964,000       6.1        36,292        2.7


  34     Valero                             San Antonio                   10,528,000    18.5             N.A.     N.A.         1,384       -2.1


  35     Dollar General                     Goodlettsville, Tenn.         10,457,668    10.1         108,182      N.A.         8,362        2.1


  36     Starbucks                          Seattle                       10,383,000    10.3         315,500     -53.1        16,680      11.1


  37     Office Depot                       Boca Raton, Fla.              10,353,398    -6.0             N.A.     N.A.         1,429        4.3


  38     BJ’s Wholesale Club                Natick, Mass.                 10,027,366    11.2         134,583       9.5          180         1.7


  39     Apple Stores/iTunes                Cupertino, Calif.              9,655,000    46.0             N.A.     N.A.          247       25.4


  40     A&P                                Montvale, N.J.                 9,516,186    48.7         -139,881     N.A.          436        -2.5


  41     Limited Brands                     Columbus, Ohio                 9,043,000   -10.8         220,000     -69.4%        3,014        3.0


  42     The Pantry                         Sanford, N.C.                  8,995,626    30.2           31,783     18.9         1,653        0.5


  43     Army Air Force Exchange Dallas                                    8,876,580     1.8         376,290     -14.8         3,000       -3.2


  44     GameStop                           Grapevine, Texas               8,805,897    24.1         398,282      38.2         6,207      17.9


  45     Quik Trip(e)                       Tulsa, Okla.                   8,640,300     4.1             N.A.     N.A.          518         6.4


  46     Nordstrom                          Seattle                        8,573,000    -5.6         401,000     -43.9          169         8.3


  47     RaceTrac Petroleum                 Atlanta                        8,000,000    27.0             N.A.     N.A.          525         0.8


  48     Whole Foods Markets                Austin, Texas                  7,953,912    20.7          114,524    -37.3          275        -0.4


  49     Travel Centers of America Westlake, Ohio                          7,658,379    24.2          -40,201      N.A.         233        -1.3


  50     Menard(e)                          Eau Claire, Wis.               7,500,000     2.7             N.A.      N.A.         243       13.0


 N.A. Not available or not applicable   (e) estimate   (p) projection                                                       Source: planetretail.net


WWW.STORES.ORG                                                                                                            STORES / JULY 2009 27
Sponsored by


        Company                             Headquarters                2008 Revenue   Y/Y      2008 Earnings   Y/Y          No. of      Y/Y
Rank


                                                                        (000)          Change   (000)           Change       Stores      Change

  51     Winn-Dixie Stores                  Jacksonville, Fla.            $7,340,000    0.8%             N.A.      N.A.         520        -0.2%


  52     QVC                                West Chester, Pa.              7,303,000    -1.3             N.A.      N.A.          —         N.A.


  53     Darden Restaurants(p)              Orlando                        7,223,000     9.0             N.A.      N.A.       1,772         4.1


  54     Bed Bath & Beyond                  Union, N.J.                    7,208,340     2.3        $425,123     -24.5%       1,037         6.8


  55     Dillard’s                          Little Rock, Ark.              6,988,440    -5.2         -241,065     N.A.         315         -3.4


  56     Family Dollar                      Matthews, N.C.                 6,983,628     2.2         233,073      -4.0        6,571         2.2


  57     Giant Eagle(e)                     Pittsburgh                     6,749,103     7.9             N.A.     N.A.         382          6.7


  58     Verizon Wireless                   Basking Ridge, N.J.            6,697,000    14.2             N.A.     N.A.        2,500         4.2


  59     Aldi(e)                            Batavia, Ill.                  6,633,500    19.3             N.A.     N.A.         989         10.5


  60     AutoZone                           Memphis                        6,522,706     5.7         641,606       7.7        4,240         4.5


  61     Ross Stores                        Pleasanton, Calif.             6,486,139     8.6         305,441      17.0         956          7.4


  62     Hy-Vee(e)                          W. Des Moines, Iowa            6,200,000    10.7             N.A.     N.A.         226          0.9


  63     Defense Commissary Agency Fort Lee, Va.                           5,800,000     4.7             N.A.     N.A.         254         -2.3


  64     Albertsons (e)                     Boise, Idaho                   5,367,185    -8.7             N.A.     N.A.         265        -15.6


  65     Blockbuster                        Dallas                         5,287,900    -4.6         -385,400     N.A.        7,405        -5.4


  66     Foot Locker                        New York                       5,237,000    -3.7          -80,000     N.A.        3,641        -3.8


  67     Advance Auto Parts                 Roanoke, Va.                   5,142,255     6.1         238,038      -0.1        3,368         3.3


  68     Barnes & Noble                     New York                       5,121,804    -5.3           75,920    -44.1         778         -2.5


  69     Save Mart (e)                      Modesto, Calif.                5,100,480    12.6             N.A.     N.A.         253          1.2


  70     PetSmart                           Phoenix                        5,065,293     8.4         192,670     -25.5        1,112        10.3


  71     AT&T Wireless                      Atlanta                        4,925,000    22.9             N.A.     N.A.        2,200         0.0


  72     Trader Joe’s(e)                    Monrovia, Calif.               4,896,000    13.7             N.A.     N.A.         315          6.8


  73     Sherwin-Williams                   Cleveland                      4,834,897    -2.4             N.A.     N.A.        3,346         0.6


  74     Wegmans Food Markets (e) Rochester, N.Y.                          4,668,480     3.7             N.A.     N.A.          72          2.9


  75     Big Lots                           Columbus, Ohio                 4,645,283    -0.2         151,547      -4.4        1,339        -1.0


 N.A. Not available or not applicable   (e) estimate   (p) projection                                                       Source: planetretail.net


WWW.STORES.ORG                                                                                                            STORES / JULY 2009 29
Sponsored by


        Company                             Headquarters                2008 Revenue   Y/Y      2008 Earnings   Y/Y         No. of      Y/Y
Rank


                                                                        (000)          Change   (000)           Change      Stores      Change

 76     Dollar Tree Stores                 Chesapeake, Va.                $4,644,900    9.5%        $229,500     14.0%       3,591         5.3%


 77     Casey’s General Stores             Ankeny, Iowa                    4,687,895    -2.9          85,690      0.9        1,499         2.1


 78     Neiman Marcus Group                Dallas                          4,600,536     4.8         142,813     27.6            71        9.2


 79     Luxottica Retail                   Cincinnati                      4,549,459     2.7             N.A.     N.A.       6,255        -2.4


 80     Susser Holdings                    Corpus Christi, Texas           4,239,883   56.0           16,477      1.4          512         1.6


 81     RadioShack                         Fort Worth, Texas               4,224,500    -0.6         192,400     -18.8       6,752         1.2


 82     Dick’s Sporting Goods              Pittsburgh                      4,130,128     6.2          -35,094     N.A.         487        12.2


 83     Sheetz(e)                          Altoona, Pa.                    4,106,700     5.3             N.A.     N.A.         352         2.3


 84     WinCo Foods                        Boise, Idaho                    4,000,000   13.6              N.A.     N.A.           66       10.0


 85     OSI Restaurant Partners            Tampa, Fla.                     3,962,857    -4.9         -739,409     N.A.       1,491         0.7


 86     OfficeMax                          Naperville, Ill.                3,957,000    -7.2       -1,657,932     N.A.       1,024         4.9


 87     Bass Pro Shops(e)                  Springfield, Mo.                3,930,000   17.3              N.A.     N.A.           54       14.9


 88     Michaels Stores                    Irving, Texas                   3,817,000    -1.2           -5,000     N.A.       1,170         3.6


 89     Roundy’s Supermarkets(e) Milwaukee                                 3,788,262     6.3             N.A.     N.A.         157         2.6


 90     Stater Bros. Holdings              San Bernardino, Calif.          3,741,254     1.8          40,630     -17.7         165         0.6


 91     Harris Teeter                      Charlotte, N.C.                 3,664,804    11.1          96,752     19.9          176         7.3


 92     Raley’s(e)                         W. Sacramento, Calif.           3,659,488     0.5             N.A.     N.A.         142         2.9


 93     Brinker International(p)           Dallas                          3,628,594   -14.3             N.A.     N.A.       1,689       -10.5


 94     O’Reilly Automotive                Springfield, Mo.                3,576,553   41.8          186,232      -4.0       3,285        79.5


 95     Burlington Coat Factory            Burlington, N.J.                3,542,000     3.4             N.A.     N.A.         433         9.1


 96     Abercrombie & Fitch                New Albany, Ohio                3,540,276    -5.6         272,255     -42.8       1,125         8.7


 97     Belk                               Charlotte, N.C.                 3,499,423    -8.5         -212,965     N.A.         307         1.3


 98     Collective Brands                  Topeka, Kan.                    3,442,000   13.4           -68,700     N.A.       4,877        -0.3


 99     Wawa(e)                            Wawa, Pa.                       3,395,700     2.9             N.A.     N.A.         570         0.9


100 Williams-Sonoma                        San Francisco                   3,361,472   -14.8          30,024     -84.7         627         4.5


 N.A. Not available or not applicable   (e) estimate   (p) projection                                                      Source: planetretail.net


WWW.STORES.ORG                                                                                                           STORES / JULY 2009 31

Weitere ähnliche Inhalte

Was ist angesagt?

Bnm comparativo de clasificaciones de riesgo nov01 - nov00
Bnm   comparativo de clasificaciones de riesgo nov01 - nov00Bnm   comparativo de clasificaciones de riesgo nov01 - nov00
Bnm comparativo de clasificaciones de riesgo nov01 - nov00gonzaloromani
 
Spencer Levy - Capital Markets 2.0 - Did We Speak Too Soon?
Spencer Levy - Capital Markets 2.0 - Did We Speak Too Soon?Spencer Levy - Capital Markets 2.0 - Did We Speak Too Soon?
Spencer Levy - Capital Markets 2.0 - Did We Speak Too Soon?Ryan Slack
 
Moving Minnesota Toward Better, More Affordable Health Care
Moving Minnesota Toward Better, More Affordable Health CareMoving Minnesota Toward Better, More Affordable Health Care
Moving Minnesota Toward Better, More Affordable Health CareMinnesota Chamber of Commerce
 
Yahoo! 2 Q 2007 Earnings Presentation
Yahoo! 2 Q 2007 Earnings PresentationYahoo! 2 Q 2007 Earnings Presentation
Yahoo! 2 Q 2007 Earnings Presentationeraz
 
The importance of being diligent graphic booklet (n.6 wg trading)
The importance of being diligent   graphic booklet (n.6 wg trading)The importance of being diligent   graphic booklet (n.6 wg trading)
The importance of being diligent graphic booklet (n.6 wg trading)susvolans
 
Irs Audit Activity Am Best Conference 3 23 11 Forray
Irs Audit Activity Am Best Conference 3 23 11 ForrayIrs Audit Activity Am Best Conference 3 23 11 Forray
Irs Audit Activity Am Best Conference 3 23 11 ForraySusanJF
 
Comdentstat
ComdentstatComdentstat
Comdentstatrgater
 
July 2012 plsn pdf
July 2012 plsn pdfJuly 2012 plsn pdf
July 2012 plsn pdfPLSN
 
Dsh summary
Dsh summaryDsh summary
Dsh summarysoder145
 
10 Ways to Use Life Insurance in Philanthropic Planning
10 Ways to Use Life Insurance in Philanthropic Planning10 Ways to Use Life Insurance in Philanthropic Planning
10 Ways to Use Life Insurance in Philanthropic Planningtbonhag
 
pitney bowes FastFacts
pitney bowes FastFactspitney bowes FastFacts
pitney bowes FastFactsfinance47
 
Electronic Security Expo 2012 Attrition Toolbox
Electronic Security Expo 2012 Attrition ToolboxElectronic Security Expo 2012 Attrition Toolbox
Electronic Security Expo 2012 Attrition Toolboxstevespott
 
wal mart store 1997Financials
wal mart store 1997Financialswal mart store 1997Financials
wal mart store 1997Financialsfinance1
 
Wag Report 2009 Q4 De 12 Mo
Wag Report 2009 Q4 De 12 MoWag Report 2009 Q4 De 12 Mo
Wag Report 2009 Q4 De 12 Mochipwags
 
Waking Up To A World Currency - tna - Sept 27 2010
Waking Up To A World Currency -  tna -  Sept 27 2010Waking Up To A World Currency -  tna -  Sept 27 2010
Waking Up To A World Currency - tna - Sept 27 2010miscott57
 
The CRED DQ Report - Market Delinquency by Property Type
The CRED DQ Report - Market Delinquency by Property TypeThe CRED DQ Report - Market Delinquency by Property Type
The CRED DQ Report - Market Delinquency by Property TypeMichael Haas
 

Was ist angesagt? (19)

Bnm comparativo de clasificaciones de riesgo nov01 - nov00
Bnm   comparativo de clasificaciones de riesgo nov01 - nov00Bnm   comparativo de clasificaciones de riesgo nov01 - nov00
Bnm comparativo de clasificaciones de riesgo nov01 - nov00
 
Spencer Levy - Capital Markets 2.0 - Did We Speak Too Soon?
Spencer Levy - Capital Markets 2.0 - Did We Speak Too Soon?Spencer Levy - Capital Markets 2.0 - Did We Speak Too Soon?
Spencer Levy - Capital Markets 2.0 - Did We Speak Too Soon?
 
Moving Minnesota Toward Better, More Affordable Health Care
Moving Minnesota Toward Better, More Affordable Health CareMoving Minnesota Toward Better, More Affordable Health Care
Moving Minnesota Toward Better, More Affordable Health Care
 
Yahoo! 2 Q 2007 Earnings Presentation
Yahoo! 2 Q 2007 Earnings PresentationYahoo! 2 Q 2007 Earnings Presentation
Yahoo! 2 Q 2007 Earnings Presentation
 
The importance of being diligent graphic booklet (n.6 wg trading)
The importance of being diligent   graphic booklet (n.6 wg trading)The importance of being diligent   graphic booklet (n.6 wg trading)
The importance of being diligent graphic booklet (n.6 wg trading)
 
Sales Math Workshop
Sales Math WorkshopSales Math Workshop
Sales Math Workshop
 
Irs Audit Activity Am Best Conference 3 23 11 Forray
Irs Audit Activity Am Best Conference 3 23 11 ForrayIrs Audit Activity Am Best Conference 3 23 11 Forray
Irs Audit Activity Am Best Conference 3 23 11 Forray
 
Chatt Cvb 1 15 09
Chatt Cvb 1 15 09Chatt Cvb 1 15 09
Chatt Cvb 1 15 09
 
Comdentstat
ComdentstatComdentstat
Comdentstat
 
July 2012 plsn pdf
July 2012 plsn pdfJuly 2012 plsn pdf
July 2012 plsn pdf
 
Dsh summary
Dsh summaryDsh summary
Dsh summary
 
10 Ways to Use Life Insurance in Philanthropic Planning
10 Ways to Use Life Insurance in Philanthropic Planning10 Ways to Use Life Insurance in Philanthropic Planning
10 Ways to Use Life Insurance in Philanthropic Planning
 
pitney bowes FastFacts
pitney bowes FastFactspitney bowes FastFacts
pitney bowes FastFacts
 
Electronic Security Expo 2012 Attrition Toolbox
Electronic Security Expo 2012 Attrition ToolboxElectronic Security Expo 2012 Attrition Toolbox
Electronic Security Expo 2012 Attrition Toolbox
 
wal mart store 1997Financials
wal mart store 1997Financialswal mart store 1997Financials
wal mart store 1997Financials
 
Wag Report 2009 Q4 De 12 Mo
Wag Report 2009 Q4 De 12 MoWag Report 2009 Q4 De 12 Mo
Wag Report 2009 Q4 De 12 Mo
 
Q3 2009 Earning Report of Knoll Inc.
Q3 2009 Earning Report of Knoll Inc.Q3 2009 Earning Report of Knoll Inc.
Q3 2009 Earning Report of Knoll Inc.
 
Waking Up To A World Currency - tna - Sept 27 2010
Waking Up To A World Currency -  tna -  Sept 27 2010Waking Up To A World Currency -  tna -  Sept 27 2010
Waking Up To A World Currency - tna - Sept 27 2010
 
The CRED DQ Report - Market Delinquency by Property Type
The CRED DQ Report - Market Delinquency by Property TypeThe CRED DQ Report - Market Delinquency by Property Type
The CRED DQ Report - Market Delinquency by Property Type
 

Andere mochten auch

Top 100 Retailers and Categories
Top 100 Retailers and CategoriesTop 100 Retailers and Categories
Top 100 Retailers and CategoriesHumberto Galasso
 
E-Grocery Opportunities 2014
E-Grocery Opportunities 2014E-Grocery Opportunities 2014
E-Grocery Opportunities 2014Siddhartha Roy
 
The Estonian EV programme introduction
The Estonian EV programme introductionThe Estonian EV programme introduction
The Estonian EV programme introductionJarmo Tuisk
 
Courting the-mobile-consumer-7-18-final (1)
Courting the-mobile-consumer-7-18-final (1)Courting the-mobile-consumer-7-18-final (1)
Courting the-mobile-consumer-7-18-final (1)Sumit Roy
 
Pip nielsen apps report
Pip nielsen apps reportPip nielsen apps report
Pip nielsen apps reportSumit Roy
 
Wanted: Best Practices for Collaborative Translation
Wanted: Best Practices for Collaborative TranslationWanted: Best Practices for Collaborative Translation
Wanted: Best Practices for Collaborative TranslationGrupo Inmigra i+d
 
Presentation for the delegation of Finnish tech journalists about Estonian EV...
Presentation for the delegation of Finnish tech journalists about Estonian EV...Presentation for the delegation of Finnish tech journalists about Estonian EV...
Presentation for the delegation of Finnish tech journalists about Estonian EV...Jarmo Tuisk
 
Com score the power of like
Com score   the power of likeCom score   the power of like
Com score the power of likeSumit Roy
 
Consumer Mobile Insights On Retail
Consumer Mobile Insights On RetailConsumer Mobile Insights On Retail
Consumer Mobile Insights On RetailSumit Roy
 
Ek titli magazine - September 2010
Ek titli magazine - September 2010Ek titli magazine - September 2010
Ek titli magazine - September 2010Bhavik Kaul
 
India Today Sept 16, 2008 - INDIAN EQUITIES RECOVER FROM WEAK START, END FLAT
India Today Sept 16, 2008 - INDIAN EQUITIES RECOVER FROM WEAK START, END FLATIndia Today Sept 16, 2008 - INDIAN EQUITIES RECOVER FROM WEAK START, END FLAT
India Today Sept 16, 2008 - INDIAN EQUITIES RECOVER FROM WEAK START, END FLATJagannadham Thunuguntla
 
The evolution of POS in Shopping
The  evolution of POS   in Shopping The  evolution of POS   in Shopping
The evolution of POS in Shopping Sumit Roy
 
Fortis Hospitals " Be a Fortisan Campaign"
Fortis Hospitals " Be a Fortisan Campaign"Fortis Hospitals " Be a Fortisan Campaign"
Fortis Hospitals " Be a Fortisan Campaign"Sumit Roy
 
Presentation1
Presentation1Presentation1
Presentation1yapsmail
 
Pfizer 12ar leading_consumer_healthcare_products
Pfizer 12ar leading_consumer_healthcare_productsPfizer 12ar leading_consumer_healthcare_products
Pfizer 12ar leading_consumer_healthcare_productsSumit Roy
 

Andere mochten auch (20)

Top 100 Retailers and Categories
Top 100 Retailers and CategoriesTop 100 Retailers and Categories
Top 100 Retailers and Categories
 
Top 100 Retailers
Top 100 RetailersTop 100 Retailers
Top 100 Retailers
 
E-Grocery Opportunities 2014
E-Grocery Opportunities 2014E-Grocery Opportunities 2014
E-Grocery Opportunities 2014
 
The Estonian EV programme introduction
The Estonian EV programme introductionThe Estonian EV programme introduction
The Estonian EV programme introduction
 
Courting the-mobile-consumer-7-18-final (1)
Courting the-mobile-consumer-7-18-final (1)Courting the-mobile-consumer-7-18-final (1)
Courting the-mobile-consumer-7-18-final (1)
 
Pip nielsen apps report
Pip nielsen apps reportPip nielsen apps report
Pip nielsen apps report
 
Wanted: Best Practices for Collaborative Translation
Wanted: Best Practices for Collaborative TranslationWanted: Best Practices for Collaborative Translation
Wanted: Best Practices for Collaborative Translation
 
Ben10 case study
Ben10 case studyBen10 case study
Ben10 case study
 
Presentation for the delegation of Finnish tech journalists about Estonian EV...
Presentation for the delegation of Finnish tech journalists about Estonian EV...Presentation for the delegation of Finnish tech journalists about Estonian EV...
Presentation for the delegation of Finnish tech journalists about Estonian EV...
 
Com score the power of like
Com score   the power of likeCom score   the power of like
Com score the power of like
 
Consumer Mobile Insights On Retail
Consumer Mobile Insights On RetailConsumer Mobile Insights On Retail
Consumer Mobile Insights On Retail
 
Ek titli magazine - September 2010
Ek titli magazine - September 2010Ek titli magazine - September 2010
Ek titli magazine - September 2010
 
India Today Sept 16, 2008 - INDIAN EQUITIES RECOVER FROM WEAK START, END FLAT
India Today Sept 16, 2008 - INDIAN EQUITIES RECOVER FROM WEAK START, END FLATIndia Today Sept 16, 2008 - INDIAN EQUITIES RECOVER FROM WEAK START, END FLAT
India Today Sept 16, 2008 - INDIAN EQUITIES RECOVER FROM WEAK START, END FLAT
 
Rational HATS overview 7.5.1
Rational HATS overview 7.5.1Rational HATS overview 7.5.1
Rational HATS overview 7.5.1
 
The evolution of POS in Shopping
The  evolution of POS   in Shopping The  evolution of POS   in Shopping
The evolution of POS in Shopping
 
SBC Directors presentation
SBC Directors presentationSBC Directors presentation
SBC Directors presentation
 
Fortis Hospitals " Be a Fortisan Campaign"
Fortis Hospitals " Be a Fortisan Campaign"Fortis Hospitals " Be a Fortisan Campaign"
Fortis Hospitals " Be a Fortisan Campaign"
 
Presentation1
Presentation1Presentation1
Presentation1
 
Enterprise Directions
Enterprise DirectionsEnterprise Directions
Enterprise Directions
 
Pfizer 12ar leading_consumer_healthcare_products
Pfizer 12ar leading_consumer_healthcare_productsPfizer 12ar leading_consumer_healthcare_products
Pfizer 12ar leading_consumer_healthcare_products
 

Ähnlich wie Top 100 Retail Brands

Page 1 Front PagePage 2 Stocks & BondsPage 3 Financial Sum.docx
Page 1 Front PagePage 2 Stocks & BondsPage 3 Financial Sum.docxPage 1 Front PagePage 2 Stocks & BondsPage 3 Financial Sum.docx
Page 1 Front PagePage 2 Stocks & BondsPage 3 Financial Sum.docxgerardkortney
 
Page 1 Front PagePage 2 Stocks & BondsPage 3 Financial Sum.docx
Page 1 Front PagePage 2 Stocks & BondsPage 3 Financial Sum.docxPage 1 Front PagePage 2 Stocks & BondsPage 3 Financial Sum.docx
Page 1 Front PagePage 2 Stocks & BondsPage 3 Financial Sum.docxalfred4lewis58146
 
Chicago Real Estate Market Data - Broken Down by City
Chicago Real Estate Market Data - Broken Down by CityChicago Real Estate Market Data - Broken Down by City
Chicago Real Estate Market Data - Broken Down by Citybethrepta
 
H W 2010 Q1 De 12 Mo
H W 2010 Q1 De 12 MoH W 2010 Q1 De 12 Mo
H W 2010 Q1 De 12 Mochipwags
 
2222020 Report Pagehttpsww3.capsim.comcgi-bindispla.docx
2222020 Report Pagehttpsww3.capsim.comcgi-bindispla.docx2222020 Report Pagehttpsww3.capsim.comcgi-bindispla.docx
2222020 Report Pagehttpsww3.capsim.comcgi-bindispla.docxRAJU852744
 
2q2103 land report
2q2103 land report2q2103 land report
2q2103 land reportScott Davis
 
Campus clothiers semmiannual financial projection
Campus clothiers semmiannual financial projectionCampus clothiers semmiannual financial projection
Campus clothiers semmiannual financial projectionbrittneytaylor
 
Market Report Comprehensive Q4-Year End
Market Report Comprehensive Q4-Year EndMarket Report Comprehensive Q4-Year End
Market Report Comprehensive Q4-Year EndAllison Seeley
 
2222020 Report Pagehttpsww3.capsim.comcgi-bindispla.docx
2222020 Report Pagehttpsww3.capsim.comcgi-bindispla.docx2222020 Report Pagehttpsww3.capsim.comcgi-bindispla.docx
2222020 Report Pagehttpsww3.capsim.comcgi-bindispla.docxlorainedeserre
 
New automated techniques to validate and populate property valuations
New automated techniques to validate and populate property valuationsNew automated techniques to validate and populate property valuations
New automated techniques to validate and populate property valuationsRob Carroll
 
Indicadores a diciembre 2013
Indicadores a diciembre 2013Indicadores a diciembre 2013
Indicadores a diciembre 2013redasomi
 
Bass Residence Solar PV Project
Bass Residence Solar PV ProjectBass Residence Solar PV Project
Bass Residence Solar PV ProjectMDV-SEIA
 
Final Performance Statistics.PDF
Final Performance Statistics.PDFFinal Performance Statistics.PDF
Final Performance Statistics.PDFEunice Fei Jin Shi
 
Dallas Market Update January 2008
Dallas Market Update January 2008Dallas Market Update January 2008
Dallas Market Update January 2008Dee Patience
 
Napco Better Result
Napco Better ResultNapco Better Result
Napco Better Resultpmoskie
 

Ähnlich wie Top 100 Retail Brands (20)

Page 1 Front PagePage 2 Stocks & BondsPage 3 Financial Sum.docx
Page 1 Front PagePage 2 Stocks & BondsPage 3 Financial Sum.docxPage 1 Front PagePage 2 Stocks & BondsPage 3 Financial Sum.docx
Page 1 Front PagePage 2 Stocks & BondsPage 3 Financial Sum.docx
 
Charlotte's stats
Charlotte's statsCharlotte's stats
Charlotte's stats
 
Page 1 Front PagePage 2 Stocks & BondsPage 3 Financial Sum.docx
Page 1 Front PagePage 2 Stocks & BondsPage 3 Financial Sum.docxPage 1 Front PagePage 2 Stocks & BondsPage 3 Financial Sum.docx
Page 1 Front PagePage 2 Stocks & BondsPage 3 Financial Sum.docx
 
Chicago Real Estate Market Data - Broken Down by City
Chicago Real Estate Market Data - Broken Down by CityChicago Real Estate Market Data - Broken Down by City
Chicago Real Estate Market Data - Broken Down by City
 
H W 2010 Q1 De 12 Mo
H W 2010 Q1 De 12 MoH W 2010 Q1 De 12 Mo
H W 2010 Q1 De 12 Mo
 
2222020 Report Pagehttpsww3.capsim.comcgi-bindispla.docx
2222020 Report Pagehttpsww3.capsim.comcgi-bindispla.docx2222020 Report Pagehttpsww3.capsim.comcgi-bindispla.docx
2222020 Report Pagehttpsww3.capsim.comcgi-bindispla.docx
 
2q2103 land report
2q2103 land report2q2103 land report
2q2103 land report
 
Campus clothiers semmiannual financial projection
Campus clothiers semmiannual financial projectionCampus clothiers semmiannual financial projection
Campus clothiers semmiannual financial projection
 
3 d pie chart
3 d pie chart3 d pie chart
3 d pie chart
 
Market Report Comprehensive Q4-Year End
Market Report Comprehensive Q4-Year EndMarket Report Comprehensive Q4-Year End
Market Report Comprehensive Q4-Year End
 
2222020 Report Pagehttpsww3.capsim.comcgi-bindispla.docx
2222020 Report Pagehttpsww3.capsim.comcgi-bindispla.docx2222020 Report Pagehttpsww3.capsim.comcgi-bindispla.docx
2222020 Report Pagehttpsww3.capsim.comcgi-bindispla.docx
 
New automated techniques to validate and populate property valuations
New automated techniques to validate and populate property valuationsNew automated techniques to validate and populate property valuations
New automated techniques to validate and populate property valuations
 
Exhibits - Copy
Exhibits - CopyExhibits - Copy
Exhibits - Copy
 
Americaspony
AmericasponyAmericaspony
Americaspony
 
Indicadores a diciembre 2013
Indicadores a diciembre 2013Indicadores a diciembre 2013
Indicadores a diciembre 2013
 
Bass Residence Solar PV Project
Bass Residence Solar PV ProjectBass Residence Solar PV Project
Bass Residence Solar PV Project
 
Final Performance Statistics.PDF
Final Performance Statistics.PDFFinal Performance Statistics.PDF
Final Performance Statistics.PDF
 
Dallas Market Update January 2008
Dallas Market Update January 2008Dallas Market Update January 2008
Dallas Market Update January 2008
 
Funciones
FuncionesFunciones
Funciones
 
Napco Better Result
Napco Better ResultNapco Better Result
Napco Better Result
 

Mehr von Sumit Roy

Mallcom Private Label Brochure
Mallcom Private Label BrochureMallcom Private Label Brochure
Mallcom Private Label BrochureSumit Roy
 
Catching up with shivakeshavan cii mumbai : Our
Catching up with shivakeshavan cii mumbai : Our Catching up with shivakeshavan cii mumbai : Our
Catching up with shivakeshavan cii mumbai : Our Sumit Roy
 
research report on online food ordering market in India
research report on online food ordering market in Indiaresearch report on online food ordering market in India
research report on online food ordering market in IndiaSumit Roy
 
how iOT is set to herald the Renaissance of 2nd industrial revolution
how iOT is set to herald the Renaissance of 2nd industrial revolution how iOT is set to herald the Renaissance of 2nd industrial revolution
how iOT is set to herald the Renaissance of 2nd industrial revolution Sumit Roy
 
patents received by the top 5 technology companies
patents received by the top 5 technology companies patents received by the top 5 technology companies
patents received by the top 5 technology companies Sumit Roy
 
programmatic Buying in Mobile Advertising
 programmatic Buying in Mobile Advertising  programmatic Buying in Mobile Advertising
programmatic Buying in Mobile Advertising Sumit Roy
 
State of mobile mobile developers:ecosystem and marketing mix
State of mobile mobile developers:ecosystem and marketing mixState of mobile mobile developers:ecosystem and marketing mix
State of mobile mobile developers:ecosystem and marketing mixSumit Roy
 
top 5 indicators on pharma brands and marketing spends
top 5 indicators on pharma brands and marketing spendstop 5 indicators on pharma brands and marketing spends
top 5 indicators on pharma brands and marketing spendsSumit Roy
 
2016 BrandZ™ Top 100 Most Valuable Global Brands increased 3 percent, to $3.4...
2016 BrandZ™ Top 100 Most Valuable Global Brands increased 3 percent, to $3.4...2016 BrandZ™ Top 100 Most Valuable Global Brands increased 3 percent, to $3.4...
2016 BrandZ™ Top 100 Most Valuable Global Brands increased 3 percent, to $3.4...Sumit Roy
 
worldwide media upsurge in spends by format :
worldwide media upsurge in  spends by format : worldwide media upsurge in  spends by format :
worldwide media upsurge in spends by format : Sumit Roy
 
global Venture funding and start up data : top 10 charts
global Venture funding and start up data : top 10 chartsglobal Venture funding and start up data : top 10 charts
global Venture funding and start up data : top 10 chartsSumit Roy
 
US SOLOMO ( SOCIAL LOCAL MOBILE SPENDS 2016 ONWARDS)
US SOLOMO ( SOCIAL LOCAL MOBILE SPENDS 2016 ONWARDS)US SOLOMO ( SOCIAL LOCAL MOBILE SPENDS 2016 ONWARDS)
US SOLOMO ( SOCIAL LOCAL MOBILE SPENDS 2016 ONWARDS)Sumit Roy
 
Mena nations mobile app downloads and cost per installs
Mena nations mobile app downloads and cost per installsMena nations mobile app downloads and cost per installs
Mena nations mobile app downloads and cost per installsSumit Roy
 
State of mobile app downloads and cost per installs in Latin America
State of mobile app downloads and cost per installs in Latin AmericaState of mobile app downloads and cost per installs in Latin America
State of mobile app downloads and cost per installs in Latin AmericaSumit Roy
 
state mobile app downloads in asia pacific
state mobile app downloads  in asia pacificstate mobile app downloads  in asia pacific
state mobile app downloads in asia pacificSumit Roy
 
top 100 start up companies with valuations of 1$ billion and above
top 100 start up companies with valuations of 1$ billion and abovetop 100 start up companies with valuations of 1$ billion and above
top 100 start up companies with valuations of 1$ billion and aboveSumit Roy
 
global biggest start up companies with valuations of 1$ billion and above
global biggest start up companies with valuations of 1$ billion and aboveglobal biggest start up companies with valuations of 1$ billion and above
global biggest start up companies with valuations of 1$ billion and aboveSumit Roy
 
The hottest consumer products this year
The hottest consumer products this yearThe hottest consumer products this year
The hottest consumer products this yearSumit Roy
 
top 10 most powerful brands in Indonesia
top 10 most powerful brands in Indonesiatop 10 most powerful brands in Indonesia
top 10 most powerful brands in IndonesiaSumit Roy
 
The state of global Mobile market in 2015
The state of global Mobile market in 2015The state of global Mobile market in 2015
The state of global Mobile market in 2015Sumit Roy
 

Mehr von Sumit Roy (20)

Mallcom Private Label Brochure
Mallcom Private Label BrochureMallcom Private Label Brochure
Mallcom Private Label Brochure
 
Catching up with shivakeshavan cii mumbai : Our
Catching up with shivakeshavan cii mumbai : Our Catching up with shivakeshavan cii mumbai : Our
Catching up with shivakeshavan cii mumbai : Our
 
research report on online food ordering market in India
research report on online food ordering market in Indiaresearch report on online food ordering market in India
research report on online food ordering market in India
 
how iOT is set to herald the Renaissance of 2nd industrial revolution
how iOT is set to herald the Renaissance of 2nd industrial revolution how iOT is set to herald the Renaissance of 2nd industrial revolution
how iOT is set to herald the Renaissance of 2nd industrial revolution
 
patents received by the top 5 technology companies
patents received by the top 5 technology companies patents received by the top 5 technology companies
patents received by the top 5 technology companies
 
programmatic Buying in Mobile Advertising
 programmatic Buying in Mobile Advertising  programmatic Buying in Mobile Advertising
programmatic Buying in Mobile Advertising
 
State of mobile mobile developers:ecosystem and marketing mix
State of mobile mobile developers:ecosystem and marketing mixState of mobile mobile developers:ecosystem and marketing mix
State of mobile mobile developers:ecosystem and marketing mix
 
top 5 indicators on pharma brands and marketing spends
top 5 indicators on pharma brands and marketing spendstop 5 indicators on pharma brands and marketing spends
top 5 indicators on pharma brands and marketing spends
 
2016 BrandZ™ Top 100 Most Valuable Global Brands increased 3 percent, to $3.4...
2016 BrandZ™ Top 100 Most Valuable Global Brands increased 3 percent, to $3.4...2016 BrandZ™ Top 100 Most Valuable Global Brands increased 3 percent, to $3.4...
2016 BrandZ™ Top 100 Most Valuable Global Brands increased 3 percent, to $3.4...
 
worldwide media upsurge in spends by format :
worldwide media upsurge in  spends by format : worldwide media upsurge in  spends by format :
worldwide media upsurge in spends by format :
 
global Venture funding and start up data : top 10 charts
global Venture funding and start up data : top 10 chartsglobal Venture funding and start up data : top 10 charts
global Venture funding and start up data : top 10 charts
 
US SOLOMO ( SOCIAL LOCAL MOBILE SPENDS 2016 ONWARDS)
US SOLOMO ( SOCIAL LOCAL MOBILE SPENDS 2016 ONWARDS)US SOLOMO ( SOCIAL LOCAL MOBILE SPENDS 2016 ONWARDS)
US SOLOMO ( SOCIAL LOCAL MOBILE SPENDS 2016 ONWARDS)
 
Mena nations mobile app downloads and cost per installs
Mena nations mobile app downloads and cost per installsMena nations mobile app downloads and cost per installs
Mena nations mobile app downloads and cost per installs
 
State of mobile app downloads and cost per installs in Latin America
State of mobile app downloads and cost per installs in Latin AmericaState of mobile app downloads and cost per installs in Latin America
State of mobile app downloads and cost per installs in Latin America
 
state mobile app downloads in asia pacific
state mobile app downloads  in asia pacificstate mobile app downloads  in asia pacific
state mobile app downloads in asia pacific
 
top 100 start up companies with valuations of 1$ billion and above
top 100 start up companies with valuations of 1$ billion and abovetop 100 start up companies with valuations of 1$ billion and above
top 100 start up companies with valuations of 1$ billion and above
 
global biggest start up companies with valuations of 1$ billion and above
global biggest start up companies with valuations of 1$ billion and aboveglobal biggest start up companies with valuations of 1$ billion and above
global biggest start up companies with valuations of 1$ billion and above
 
The hottest consumer products this year
The hottest consumer products this yearThe hottest consumer products this year
The hottest consumer products this year
 
top 10 most powerful brands in Indonesia
top 10 most powerful brands in Indonesiatop 10 most powerful brands in Indonesia
top 10 most powerful brands in Indonesia
 
The state of global Mobile market in 2015
The state of global Mobile market in 2015The state of global Mobile market in 2015
The state of global Mobile market in 2015
 

Kürzlich hochgeladen

Field Attribute Index Feature in Odoo 17
Field Attribute Index Feature in Odoo 17Field Attribute Index Feature in Odoo 17
Field Attribute Index Feature in Odoo 17Celine George
 
How to Add Barcode on PDF Report in Odoo 17
How to Add Barcode on PDF Report in Odoo 17How to Add Barcode on PDF Report in Odoo 17
How to Add Barcode on PDF Report in Odoo 17Celine George
 
THEORIES OF ORGANIZATION-PUBLIC ADMINISTRATION
THEORIES OF ORGANIZATION-PUBLIC ADMINISTRATIONTHEORIES OF ORGANIZATION-PUBLIC ADMINISTRATION
THEORIES OF ORGANIZATION-PUBLIC ADMINISTRATIONHumphrey A Beña
 
Roles & Responsibilities in Pharmacovigilance
Roles & Responsibilities in PharmacovigilanceRoles & Responsibilities in Pharmacovigilance
Roles & Responsibilities in PharmacovigilanceSamikshaHamane
 
HỌC TỐT TIẾNG ANH 11 THEO CHƯƠNG TRÌNH GLOBAL SUCCESS ĐÁP ÁN CHI TIẾT - CẢ NĂ...
HỌC TỐT TIẾNG ANH 11 THEO CHƯƠNG TRÌNH GLOBAL SUCCESS ĐÁP ÁN CHI TIẾT - CẢ NĂ...HỌC TỐT TIẾNG ANH 11 THEO CHƯƠNG TRÌNH GLOBAL SUCCESS ĐÁP ÁN CHI TIẾT - CẢ NĂ...
HỌC TỐT TIẾNG ANH 11 THEO CHƯƠNG TRÌNH GLOBAL SUCCESS ĐÁP ÁN CHI TIẾT - CẢ NĂ...Nguyen Thanh Tu Collection
 
Procuring digital preservation CAN be quick and painless with our new dynamic...
Procuring digital preservation CAN be quick and painless with our new dynamic...Procuring digital preservation CAN be quick and painless with our new dynamic...
Procuring digital preservation CAN be quick and painless with our new dynamic...Jisc
 
Q4 English4 Week3 PPT Melcnmg-based.pptx
Q4 English4 Week3 PPT Melcnmg-based.pptxQ4 English4 Week3 PPT Melcnmg-based.pptx
Q4 English4 Week3 PPT Melcnmg-based.pptxnelietumpap1
 
Difference Between Search & Browse Methods in Odoo 17
Difference Between Search & Browse Methods in Odoo 17Difference Between Search & Browse Methods in Odoo 17
Difference Between Search & Browse Methods in Odoo 17Celine George
 
How to do quick user assign in kanban in Odoo 17 ERP
How to do quick user assign in kanban in Odoo 17 ERPHow to do quick user assign in kanban in Odoo 17 ERP
How to do quick user assign in kanban in Odoo 17 ERPCeline George
 
What is Model Inheritance in Odoo 17 ERP
What is Model Inheritance in Odoo 17 ERPWhat is Model Inheritance in Odoo 17 ERP
What is Model Inheritance in Odoo 17 ERPCeline George
 
Barangay Council for the Protection of Children (BCPC) Orientation.pptx
Barangay Council for the Protection of Children (BCPC) Orientation.pptxBarangay Council for the Protection of Children (BCPC) Orientation.pptx
Barangay Council for the Protection of Children (BCPC) Orientation.pptxCarlos105
 
Full Stack Web Development Course for Beginners
Full Stack Web Development Course  for BeginnersFull Stack Web Development Course  for Beginners
Full Stack Web Development Course for BeginnersSabitha Banu
 
AMERICAN LANGUAGE HUB_Level2_Student'sBook_Answerkey.pdf
AMERICAN LANGUAGE HUB_Level2_Student'sBook_Answerkey.pdfAMERICAN LANGUAGE HUB_Level2_Student'sBook_Answerkey.pdf
AMERICAN LANGUAGE HUB_Level2_Student'sBook_Answerkey.pdfphamnguyenenglishnb
 
Grade 9 Q4-MELC1-Active and Passive Voice.pptx
Grade 9 Q4-MELC1-Active and Passive Voice.pptxGrade 9 Q4-MELC1-Active and Passive Voice.pptx
Grade 9 Q4-MELC1-Active and Passive Voice.pptxChelloAnnAsuncion2
 
GRADE 4 - SUMMATIVE TEST QUARTER 4 ALL SUBJECTS
GRADE 4 - SUMMATIVE TEST QUARTER 4 ALL SUBJECTSGRADE 4 - SUMMATIVE TEST QUARTER 4 ALL SUBJECTS
GRADE 4 - SUMMATIVE TEST QUARTER 4 ALL SUBJECTSJoshuaGantuangco2
 
Gas measurement O2,Co2,& ph) 04/2024.pptx
Gas measurement O2,Co2,& ph) 04/2024.pptxGas measurement O2,Co2,& ph) 04/2024.pptx
Gas measurement O2,Co2,& ph) 04/2024.pptxDr.Ibrahim Hassaan
 

Kürzlich hochgeladen (20)

Field Attribute Index Feature in Odoo 17
Field Attribute Index Feature in Odoo 17Field Attribute Index Feature in Odoo 17
Field Attribute Index Feature in Odoo 17
 
FINALS_OF_LEFT_ON_C'N_EL_DORADO_2024.pptx
FINALS_OF_LEFT_ON_C'N_EL_DORADO_2024.pptxFINALS_OF_LEFT_ON_C'N_EL_DORADO_2024.pptx
FINALS_OF_LEFT_ON_C'N_EL_DORADO_2024.pptx
 
How to Add Barcode on PDF Report in Odoo 17
How to Add Barcode on PDF Report in Odoo 17How to Add Barcode on PDF Report in Odoo 17
How to Add Barcode on PDF Report in Odoo 17
 
THEORIES OF ORGANIZATION-PUBLIC ADMINISTRATION
THEORIES OF ORGANIZATION-PUBLIC ADMINISTRATIONTHEORIES OF ORGANIZATION-PUBLIC ADMINISTRATION
THEORIES OF ORGANIZATION-PUBLIC ADMINISTRATION
 
Roles & Responsibilities in Pharmacovigilance
Roles & Responsibilities in PharmacovigilanceRoles & Responsibilities in Pharmacovigilance
Roles & Responsibilities in Pharmacovigilance
 
HỌC TỐT TIẾNG ANH 11 THEO CHƯƠNG TRÌNH GLOBAL SUCCESS ĐÁP ÁN CHI TIẾT - CẢ NĂ...
HỌC TỐT TIẾNG ANH 11 THEO CHƯƠNG TRÌNH GLOBAL SUCCESS ĐÁP ÁN CHI TIẾT - CẢ NĂ...HỌC TỐT TIẾNG ANH 11 THEO CHƯƠNG TRÌNH GLOBAL SUCCESS ĐÁP ÁN CHI TIẾT - CẢ NĂ...
HỌC TỐT TIẾNG ANH 11 THEO CHƯƠNG TRÌNH GLOBAL SUCCESS ĐÁP ÁN CHI TIẾT - CẢ NĂ...
 
Procuring digital preservation CAN be quick and painless with our new dynamic...
Procuring digital preservation CAN be quick and painless with our new dynamic...Procuring digital preservation CAN be quick and painless with our new dynamic...
Procuring digital preservation CAN be quick and painless with our new dynamic...
 
YOUVE_GOT_EMAIL_PRELIMS_EL_DORADO_2024.pptx
YOUVE_GOT_EMAIL_PRELIMS_EL_DORADO_2024.pptxYOUVE_GOT_EMAIL_PRELIMS_EL_DORADO_2024.pptx
YOUVE_GOT_EMAIL_PRELIMS_EL_DORADO_2024.pptx
 
Q4 English4 Week3 PPT Melcnmg-based.pptx
Q4 English4 Week3 PPT Melcnmg-based.pptxQ4 English4 Week3 PPT Melcnmg-based.pptx
Q4 English4 Week3 PPT Melcnmg-based.pptx
 
Difference Between Search & Browse Methods in Odoo 17
Difference Between Search & Browse Methods in Odoo 17Difference Between Search & Browse Methods in Odoo 17
Difference Between Search & Browse Methods in Odoo 17
 
Model Call Girl in Tilak Nagar Delhi reach out to us at 🔝9953056974🔝
Model Call Girl in Tilak Nagar Delhi reach out to us at 🔝9953056974🔝Model Call Girl in Tilak Nagar Delhi reach out to us at 🔝9953056974🔝
Model Call Girl in Tilak Nagar Delhi reach out to us at 🔝9953056974🔝
 
How to do quick user assign in kanban in Odoo 17 ERP
How to do quick user assign in kanban in Odoo 17 ERPHow to do quick user assign in kanban in Odoo 17 ERP
How to do quick user assign in kanban in Odoo 17 ERP
 
Raw materials used in Herbal Cosmetics.pptx
Raw materials used in Herbal Cosmetics.pptxRaw materials used in Herbal Cosmetics.pptx
Raw materials used in Herbal Cosmetics.pptx
 
What is Model Inheritance in Odoo 17 ERP
What is Model Inheritance in Odoo 17 ERPWhat is Model Inheritance in Odoo 17 ERP
What is Model Inheritance in Odoo 17 ERP
 
Barangay Council for the Protection of Children (BCPC) Orientation.pptx
Barangay Council for the Protection of Children (BCPC) Orientation.pptxBarangay Council for the Protection of Children (BCPC) Orientation.pptx
Barangay Council for the Protection of Children (BCPC) Orientation.pptx
 
Full Stack Web Development Course for Beginners
Full Stack Web Development Course  for BeginnersFull Stack Web Development Course  for Beginners
Full Stack Web Development Course for Beginners
 
AMERICAN LANGUAGE HUB_Level2_Student'sBook_Answerkey.pdf
AMERICAN LANGUAGE HUB_Level2_Student'sBook_Answerkey.pdfAMERICAN LANGUAGE HUB_Level2_Student'sBook_Answerkey.pdf
AMERICAN LANGUAGE HUB_Level2_Student'sBook_Answerkey.pdf
 
Grade 9 Q4-MELC1-Active and Passive Voice.pptx
Grade 9 Q4-MELC1-Active and Passive Voice.pptxGrade 9 Q4-MELC1-Active and Passive Voice.pptx
Grade 9 Q4-MELC1-Active and Passive Voice.pptx
 
GRADE 4 - SUMMATIVE TEST QUARTER 4 ALL SUBJECTS
GRADE 4 - SUMMATIVE TEST QUARTER 4 ALL SUBJECTSGRADE 4 - SUMMATIVE TEST QUARTER 4 ALL SUBJECTS
GRADE 4 - SUMMATIVE TEST QUARTER 4 ALL SUBJECTS
 
Gas measurement O2,Co2,& ph) 04/2024.pptx
Gas measurement O2,Co2,& ph) 04/2024.pptxGas measurement O2,Co2,& ph) 04/2024.pptx
Gas measurement O2,Co2,& ph) 04/2024.pptx
 

Top 100 Retail Brands

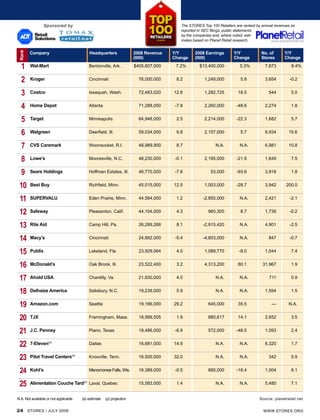
  • 1. Sponsored by The STORES Top 100 Retailers are ranked by annual revenues as reported in SEC filings, public statements by the companies and, where noted, esti- mates based on Planet Retail research. Company Headquarters 2008 Revenue Y/Y 2008 Earnings Y/Y No. of Y/Y Rank (000) Change (000) Change Stores Change 1 Wal-Mart Bentonville, Ark. $405,607,000 7.2% $13,400,000 5.3% 7,873 8.4% 2 Kroger Cincinnati 76,000,000 8.2 1,249,000 5.8 3,654 -0.2 3 Costco Issaquah, Wash. 72,483,020 12.6 1,282,725 18.5 544 5.0 4 Home Depot Atlanta 71,288,000 -7.8 2,260,000 -48.6 2,274 1.8 5 Target Minneapolis 64,948,000 2.5 2,214,000 -22.3 1,682 5.7 6 Walgreen Deerfield, Ill. 59,034,000 9.8 2,157,000 5.7 6,934 15.6 7 CVS Caremark Woonsocket, R.I. 48,989,900 8.7 N.A. N.A. 6,981 10.8 8 Lowe’s Mooresville, N.C. 48,230,000 -0.1 2,195,000 -21.9 1,649 7.5 9 Sears Holdings Hoffman Estates, Ill. 46,770,000 -7.8 53,000 -93.6 3,918 1.8 10 Best Buy Richfield, Minn. 45,015,000 12.5 1,003,000 -28.7 3,942 200.0 11 SUPERVALU Eden Prairie, Minn. 44,564,000 1.2 -2,855,000 N.A. 2,421 -2.1 12 Safeway Pleasanton, Calif. 44,104,000 4.3 965,300 8.7 1,739 -0.2 13 Rite Aid Camp Hill, Pa. 26,289,268 8.1 -2,915,420 N.A. 4,901 -2.5 14 Macy’s Cincinnati 24,892,000 -5.4 -4,803,000 N.A. 847 -0.7 15 Publix Lakeland, Fla. 23,929,064 4.0 1,089,770 -8.0 1,044 7.4 16 McDonald’s Oak Brook, Ill. 23,522,400 3.2 4,313,200 80.1 31,967 1.9 17 Ahold USA Chantilly, Va. 21,830,000 4.0 N.A. N.A. 711 0.9 18 Delhaize America Salisbury, N.C. 19,239,000 5.9 N.A. N.A. 1,594 1.5 19 Amazon.com Seattle 19,166,000 29.2 645,000 35.5 — N.A. 20 TJX Framingham, Mass. 18,999,505 1.9 880,617 14.1 2,652 3.5 21 J.C. Penney Plano, Texas 18,486,000 -6.9 572,000 -48.5 1,093 2.4 22 7-Eleven(e) Dallas 16,681,000 14.9 N.A. N.A. 6,320 1.7 23 Pilot Travel Centers(e) Knoxville, Tenn. 16,500,000 32.0 N.A. N.A. 342 5.9 24 Kohl’s Menomonee Falls, Wis. 16,389,000 -0.5 885,000 -18.4 1,004 8.1 25 Alimentation Couche Tard(p) Laval, Quebec 15,583,000 1.4 N.A. N.A. 5,480 7.1 N.A. Not available or not applicable (e) estimate (p) projection Source: planetretail.net 24 STORES / JULY 2009 WWW.STORES.ORG
  • 2. Sponsored by Company Headquarters 2008 Revenue Y/Y 2008 Earnings Y/Y No. of Y/Y Rank (000) Change (000) Change Stores Change 26 H.E.B.(e) San Antonio $14,647,680 8.5% N.A. N.A. 322 3.5% 27 Gap San Francisco 14,526,000 -7.8 $967,000 16.1% 3,149 -0.6 28 Meijer (e) Grand Rapids, Mich. 14,321,000 3.2 N.A. N.A. 186 2.8 29 Staples Framingham, Mass. 14,153,851 10.9 N.A. N.A. 2,218 8.8 30 Toys “R” Us Wayne, N.J. 13,724,000 -0.5 218,000 42.5 1,559 -0.1 31 Love’s Oklahoma City 12,450,000 8.6 N.A. N.A. 220 6.8 32 Dell Global Consumer Round Rock, Texas 11,529,000 11.1 N.A. N.A. — N.A. 33 Yum! Brands Louisville, Ky. 11,279,000 8.3 964,000 6.1 36,292 2.7 34 Valero San Antonio 10,528,000 18.5 N.A. N.A. 1,384 -2.1 35 Dollar General Goodlettsville, Tenn. 10,457,668 10.1 108,182 N.A. 8,362 2.1 36 Starbucks Seattle 10,383,000 10.3 315,500 -53.1 16,680 11.1 37 Office Depot Boca Raton, Fla. 10,353,398 -6.0 N.A. N.A. 1,429 4.3 38 BJ’s Wholesale Club Natick, Mass. 10,027,366 11.2 134,583 9.5 180 1.7 39 Apple Stores/iTunes Cupertino, Calif. 9,655,000 46.0 N.A. N.A. 247 25.4 40 A&P Montvale, N.J. 9,516,186 48.7 -139,881 N.A. 436 -2.5 41 Limited Brands Columbus, Ohio 9,043,000 -10.8 220,000 -69.4% 3,014 3.0 42 The Pantry Sanford, N.C. 8,995,626 30.2 31,783 18.9 1,653 0.5 43 Army Air Force Exchange Dallas 8,876,580 1.8 376,290 -14.8 3,000 -3.2 44 GameStop Grapevine, Texas 8,805,897 24.1 398,282 38.2 6,207 17.9 45 Quik Trip(e) Tulsa, Okla. 8,640,300 4.1 N.A. N.A. 518 6.4 46 Nordstrom Seattle 8,573,000 -5.6 401,000 -43.9 169 8.3 47 RaceTrac Petroleum Atlanta 8,000,000 27.0 N.A. N.A. 525 0.8 48 Whole Foods Markets Austin, Texas 7,953,912 20.7 114,524 -37.3 275 -0.4 49 Travel Centers of America Westlake, Ohio 7,658,379 24.2 -40,201 N.A. 233 -1.3 50 Menard(e) Eau Claire, Wis. 7,500,000 2.7 N.A. N.A. 243 13.0 N.A. Not available or not applicable (e) estimate (p) projection Source: planetretail.net WWW.STORES.ORG STORES / JULY 2009 27
  • 3. Sponsored by Company Headquarters 2008 Revenue Y/Y 2008 Earnings Y/Y No. of Y/Y Rank (000) Change (000) Change Stores Change 51 Winn-Dixie Stores Jacksonville, Fla. $7,340,000 0.8% N.A. N.A. 520 -0.2% 52 QVC West Chester, Pa. 7,303,000 -1.3 N.A. N.A. — N.A. 53 Darden Restaurants(p) Orlando 7,223,000 9.0 N.A. N.A. 1,772 4.1 54 Bed Bath & Beyond Union, N.J. 7,208,340 2.3 $425,123 -24.5% 1,037 6.8 55 Dillard’s Little Rock, Ark. 6,988,440 -5.2 -241,065 N.A. 315 -3.4 56 Family Dollar Matthews, N.C. 6,983,628 2.2 233,073 -4.0 6,571 2.2 57 Giant Eagle(e) Pittsburgh 6,749,103 7.9 N.A. N.A. 382 6.7 58 Verizon Wireless Basking Ridge, N.J. 6,697,000 14.2 N.A. N.A. 2,500 4.2 59 Aldi(e) Batavia, Ill. 6,633,500 19.3 N.A. N.A. 989 10.5 60 AutoZone Memphis 6,522,706 5.7 641,606 7.7 4,240 4.5 61 Ross Stores Pleasanton, Calif. 6,486,139 8.6 305,441 17.0 956 7.4 62 Hy-Vee(e) W. Des Moines, Iowa 6,200,000 10.7 N.A. N.A. 226 0.9 63 Defense Commissary Agency Fort Lee, Va. 5,800,000 4.7 N.A. N.A. 254 -2.3 64 Albertsons (e) Boise, Idaho 5,367,185 -8.7 N.A. N.A. 265 -15.6 65 Blockbuster Dallas 5,287,900 -4.6 -385,400 N.A. 7,405 -5.4 66 Foot Locker New York 5,237,000 -3.7 -80,000 N.A. 3,641 -3.8 67 Advance Auto Parts Roanoke, Va. 5,142,255 6.1 238,038 -0.1 3,368 3.3 68 Barnes & Noble New York 5,121,804 -5.3 75,920 -44.1 778 -2.5 69 Save Mart (e) Modesto, Calif. 5,100,480 12.6 N.A. N.A. 253 1.2 70 PetSmart Phoenix 5,065,293 8.4 192,670 -25.5 1,112 10.3 71 AT&T Wireless Atlanta 4,925,000 22.9 N.A. N.A. 2,200 0.0 72 Trader Joe’s(e) Monrovia, Calif. 4,896,000 13.7 N.A. N.A. 315 6.8 73 Sherwin-Williams Cleveland 4,834,897 -2.4 N.A. N.A. 3,346 0.6 74 Wegmans Food Markets (e) Rochester, N.Y. 4,668,480 3.7 N.A. N.A. 72 2.9 75 Big Lots Columbus, Ohio 4,645,283 -0.2 151,547 -4.4 1,339 -1.0 N.A. Not available or not applicable (e) estimate (p) projection Source: planetretail.net WWW.STORES.ORG STORES / JULY 2009 29
  • 4. Sponsored by Company Headquarters 2008 Revenue Y/Y 2008 Earnings Y/Y No. of Y/Y Rank (000) Change (000) Change Stores Change 76 Dollar Tree Stores Chesapeake, Va. $4,644,900 9.5% $229,500 14.0% 3,591 5.3% 77 Casey’s General Stores Ankeny, Iowa 4,687,895 -2.9 85,690 0.9 1,499 2.1 78 Neiman Marcus Group Dallas 4,600,536 4.8 142,813 27.6 71 9.2 79 Luxottica Retail Cincinnati 4,549,459 2.7 N.A. N.A. 6,255 -2.4 80 Susser Holdings Corpus Christi, Texas 4,239,883 56.0 16,477 1.4 512 1.6 81 RadioShack Fort Worth, Texas 4,224,500 -0.6 192,400 -18.8 6,752 1.2 82 Dick’s Sporting Goods Pittsburgh 4,130,128 6.2 -35,094 N.A. 487 12.2 83 Sheetz(e) Altoona, Pa. 4,106,700 5.3 N.A. N.A. 352 2.3 84 WinCo Foods Boise, Idaho 4,000,000 13.6 N.A. N.A. 66 10.0 85 OSI Restaurant Partners Tampa, Fla. 3,962,857 -4.9 -739,409 N.A. 1,491 0.7 86 OfficeMax Naperville, Ill. 3,957,000 -7.2 -1,657,932 N.A. 1,024 4.9 87 Bass Pro Shops(e) Springfield, Mo. 3,930,000 17.3 N.A. N.A. 54 14.9 88 Michaels Stores Irving, Texas 3,817,000 -1.2 -5,000 N.A. 1,170 3.6 89 Roundy’s Supermarkets(e) Milwaukee 3,788,262 6.3 N.A. N.A. 157 2.6 90 Stater Bros. Holdings San Bernardino, Calif. 3,741,254 1.8 40,630 -17.7 165 0.6 91 Harris Teeter Charlotte, N.C. 3,664,804 11.1 96,752 19.9 176 7.3 92 Raley’s(e) W. Sacramento, Calif. 3,659,488 0.5 N.A. N.A. 142 2.9 93 Brinker International(p) Dallas 3,628,594 -14.3 N.A. N.A. 1,689 -10.5 94 O’Reilly Automotive Springfield, Mo. 3,576,553 41.8 186,232 -4.0 3,285 79.5 95 Burlington Coat Factory Burlington, N.J. 3,542,000 3.4 N.A. N.A. 433 9.1 96 Abercrombie & Fitch New Albany, Ohio 3,540,276 -5.6 272,255 -42.8 1,125 8.7 97 Belk Charlotte, N.C. 3,499,423 -8.5 -212,965 N.A. 307 1.3 98 Collective Brands Topeka, Kan. 3,442,000 13.4 -68,700 N.A. 4,877 -0.3 99 Wawa(e) Wawa, Pa. 3,395,700 2.9 N.A. N.A. 570 0.9 100 Williams-Sonoma San Francisco 3,361,472 -14.8 30,024 -84.7 627 4.5 N.A. Not available or not applicable (e) estimate (p) projection Source: planetretail.net WWW.STORES.ORG STORES / JULY 2009 31