SlideShare ist ein Scribd-Unternehmen logo
1 von 17
Tensile Testing Experiment
Introduction
What is Tensile Testing
Tensile testing is a way of determining how something will
react when it is pulled apart –i.e. when a force is applied to it
in tension. In Tensile Testing, a specimen is subjected to an
increasing axial load whilst measuring the corresponding
elongation until it fractures. The test is designed to give the
yield stress, ultimate tensile stress and the percentage
elongation (an indication of ductility) for a material.


Applications of Tensile Testing
TENSILE TESTS are performed for several reasons.

        If a material is to be used as part of an engineering
        structure that will be subjected to a load, it is
        important to know that the material is strong and
        rigid enough to withstand the loads that it will
        experience in service. These tests provides data on the integrity and safety of materials,
        components and products, helping manufacturers ensure that their finished products are fit-for-
        purpose and manufactured to the highest quality.These measures of strength are used, with
        appropriate caution (in the form of safety factors), in engineering design.
        Moreover, tensile properties often are measured during development of new materials and
        processes, so that different materials and processes can be compared. Thus, the results of
        tensile tests are used in selecting materials for engineering applications.

    Some of the examples are discussed below.

1.Airframe Manufacturing
A newly designed aircraft must be
thoroughly tested before it can be
flown. Hydraulic stress testing is a
common technique for checking
the strength and flexibility of
wings, fuselage, propellers, and
entire airframes. Tens or even
hundreds of hydraulic actuators
push and pull at an airframe to test for failures and materials fatigue that might occur under flight
conditions. Strain is measured at hundreds of points to qualify test results.

2. Bolts Installation
Most fastener applications are designed to support or transmit some form of externally applied load. In
bolts testing, Tensile strength is the maximum tension-applied load the fastener can support prior to
fracture. Usually, if strength is only requirement carbon steel bolts are sufficient. For special
applications, non-ferrous metal bolts can be considered.
Theory


Tensile Specimens
The Shape of the Specimen
Consider the typical tensile specimen shown in Figure below.


It has enlarged ends or shoulders for gripping. The importantpart of the specimen is the gage section.
Thecross-sectional area of the gage section is reducedrelative to that of the remainder of thespecimen
so that deformation and failure will be localized in this region. The gage length is theregion over which
measurements are made andis centered within the reduced section.

Holding the Specimen
There are various ways of gripping the specimen, some of which are illustrated in Figure below


The end may be screwed into a threaded grip, or it may be pinned; butt ends may be used, or the grip
section may be held between wedges.
Stress-Strain Curves
A tensile test involves mounting the specimen in a machine,
such as those described in the previous section, and
subjecting it to tension. The tensile force is recorded as a
function of the increase in gage length. The Figure shows a
typical curve for a ductile material. Such plots of tensile force
versus tensile elongation would be of little value if they were
not      normalized       with    respect      to      specimen
dimensions.Therefore, engineers commonly use two
normalized parameters.

    1. Engineering / Normal Stress
    2. Engineering / Normal Strain

Engineering stress
Engineering stress, or normal stress, σ, is definedas


where F is the tensile force and A0 is the initialcross-sectional area of the gage section.

Units of stress:
SI Units: Newton per square meter (      ) = Pascal (Pa)

FPS Units: pounds per square inch (psi)

Engineering strain
Engineering strain, or normal strain,ε, is defined as


where L0 is the initial gage length and ΔL is
thechange in gage length (L -L0).

Units of Strain
Strain is measured as     .

When force-elongation data are converted
toengineering stress and strain, a stress-strain curve
that is identical in shape to theforce-elongation
curve can be plotted. The advantageof dealing with
stress versus strainrather than load versus
elongation is that thestress-strain curve is virtually
independent ofspecimen dimensions.
Elastic versus Plastic Deformation.
Whena solid material is subjected to small stresses, thebonds between the atoms are stretched.
Whenthe stress is removed, the bonds relax and thematerial returns to its original shape. This reversible
deformation is called elastic deformation. At higher stresses, planes of atomsslide over one another.
This deformation, whichis not recovered when the stress is removed, istermed plastic deformation.

NoteThe term“plastic deformation” does not mean that the deformedmaterial is a plastic (a polymeric
material).

For most materials, the initial portion of the Stress strain curve is linear. The slope of this linear region
iscalled the elastic modulus or Young’s modulus:


When the stress rises high enough, the stress-strainbehavior will cease to be linear and thestrain will not
disappear completely on unloading.The strain that remains is called plasticstrain. The first plastic strain
usually correspondsto the first deviation from linearity.

Yield Strength
It is tempting to define an elastic limit as thestress at
which plastic deformation first occursand a proportional
limit as the stress at whichthe stress-strain curve first
deviates from linearity. The beginning of the plasticityis
usually described by an offset yieldstrength, which can be
measured with greaterreproducibility. It can be found by
constructinga straight line parallel to the initial linear
portionof the stress-strain curve, but offset byε = 0.002
or 0.2%. The yield strength is the stress atwhich this line
intersects the stress-strain curve. The logic is that if the
material hadbeen loaded to this stress and then
unloaded, theunloading path would have been along this
offsetline and would have resulted in a plastic strain of ε
0.2%.

Tensile Strength
The tensile strength (ultimate strength) is definedas the
highest value of engineering stress (shown in figure
below). Up to the maximum load, the deformationshould
be uniform along the gage section.With ductile materials, the tensile strengthcorresponds to the point
at which the deformationstarts to localize, forming a neck (Fig. a).Less ductile materials fracture before
they neck(Fig. b). In this case, the fracture strength is thetensile strength. Indeed, very brittle
materials(e.g., glass at room temperature) do not yieldbefore fracture (Fig. c). Such materials
havetensile strengths but not yield strengths.
Ductility
There are two common measuresused to describe the ductility of a material. One is the percent
elongation, which is defined simplyas


where L0 is the initial gage length and Lf is thelength of the gage section at fracture. Measurementsmay
be made on the broken pieces or underload. For most materials, the amount of elasticelongation is so
small that the two areequivalent. When this is not so (as with brittlemetals or rubber), the results should
statewhether or not the elongation includes an elasticcontribution.

The other common measure ofductility is percent reduction of area, which isdefined as


where A0 and Af are the initial cross-sectionalarea and the cross-sectional area at fracture, respectively.If
failure occurs without necking, onecan be calculated from the other:


After a neck has developed, the two are nolonger related. Percent elongation, as a measureof ductility,
has the disadvantage that it is reallycomposed of two parts: the uniform elongationthat occurs before
necking, and the localizedelongation that occurs during necking. The secondpart is sensitive to the
specimen shape.When a gage section that is very long (relativeto its diameter), the necking elongation
convertedto percent is very small. In contrast, witha gage section that is short (relative to its diameter),
the necking elongation can account formost of the total elongation.
For round bars, this problem has been solved by standardizing the ratio of gage length todiameter to
4:1. Within a series of bars, all withthe same gage-length-to-diameter ratio, thenecking elongation will
be the same fraction ofthe total elongation. However, there is no simpleway to make meaningful
comparisons of percentelongation from such standardized bars with thatmeasured on sheet tensile
specimens or wire.With sheet tensile specimens, a portion of theelongation occurs during diffuse
necking, andthis could be standardized by maintaining thesame ratio of width to gage length. However,
aportion of the elongation also occurs duringwhat is called localized necking, and this dependson the
sheet thickness. For tensile testingof wire, it is impractical to have a reduced section,and so the ratio of
gage length to diameteris necessarily very large. Necking elongationcontributes very little to the total
elongation.

Percent reduction of area, as a measure ofductility, has the disadvantage that with veryductile materials
it is often difficult to measurethe final cross-sectional area at fracture. This isparticularly true of sheet
specimens.
The Equipment
The Mini Tensile Tester provides means of stretching a specimen to destruction to produce a force-
elongation graph from which the yield stress and ultimate stress can be extracted.

Note:Due to the simplistic nature of the equipment and chucks, an accurate answer for the modulus for
metallic materials will not be found. This is because the movement in the chucks and the mechanisms
can be of a greater magnitude than the extension in the elastic region.

Operating the Apparatus
The hand-wheel at the top of the machine pulls the top of the specimen up by 1mm per turn. The
bottom of the specimen is connected to the large springs, the deflection of which is measured on dial
indicator. Thus, the specimen elongation is given by subtracting the Dial indicator reading from the
number of turns. For example if the hand-wheel has turned three times the dial indicator reading from
the number of turns is 2.83 the elongation = 3.00 – 2.83 = 0.17mm. The dial indicator also provides an
indication of the force being applied to the specimen; since the springs have a combined rate of
100N/mm each dial indicator division is equal to one Newton. So if the dial indicator reads 2.83mm then
the force is 283N.

Safety
The guards provided with this machine should be fitted at all times. On specimen failure the
mechanism snaps back rapidly and students should be aware of this. NEVER operate this machine
unless the guards are in place.

Procedure:
   1. Select an appropriate specimen for testing
   2. Measure length (L) of specimen’s thin part as show in the diagram below.
   3. Measure the cross sectional breadth (B) and height (H) of the specimen rod using micrometer
      screw gauge.
   4. Take an initial reading against the scale at the back. Let this be R1.
   5. Take up the slack in the mechanism by tuning the hand-wheel until the dial indicator begins to
      move.
   6. Align the grove on the hand-wheel to the nearest mark on the scale, and zero the dial indicator
      using the outer bezel.
   7. Turn the hand-wheel and take dial indicator readings in the increments as shown below
          a. For Steel and Duralumin ½ turn increments are acceptable through the range.
          b. For Aluminium turn increments are acceptable through the range.
          c. For Plastics     turn increments for the first three turns are acceptable, then increments
              of 2 turns until destruction
   8. Towards the end of the test the material will yield rapidly and an accurate dial indicator reading
      may not be easily seen. If the reading does not stabilize after 20-30 seconds, then take the
      specimen to fracture by continually turning the hand-wheel until it snaps (with a bang!).
9. Wind the hand-wheel back until the ends of the specimen touch and read off the new length o
     the scale at the back (R2).

Specimen Test Section Dimensions (Nominal)
Observation Charts

For Steel


        Quantity                                      Symbol Observation

        Length of Specimen (mm)                       L

        Breadth of Specimen (mm)                      B

        Height of Specimen (mm)                       H

        Initial Scale Reading (mm)                    R1

        Final Scale Reading (mm)                      R2

        Cross Sectional Area of Specimen (mm2)        A


Number of      Dial Indicator                                              Normal Stress
                                     Elongation(mm)        Force(N)                        Strain
Turns          Reading                                                     (MPa)
Plot a graph of Stress-Strain Graph and Indicate on the graph Yield Strength σY and Ultimate
tensile Strength σUS


Use the graph to calculate the Young Modulus of Elasticity (E)


What is the Percentage Elongation (Ductility) of Specimen?


Calculate Percentage Deviation of Young Modulus from the Reference Book.
For Alumnium


        Quantity                                      Symbol Observation

        Length of Specimen (mm)                       L

        Breadth of Specimen (mm)                      B

        Height of Specimen (mm)                       H

        Initial Scale Reading (mm)                    R1

        Final Scale Reading (mm)                      R2

        Cross Sectional Area of Specimen (mm2)        A


Number of      Dial Indicator                                              Normal Stress
                                     Elongation(mm)        Force(N)                        Strain
Turns          Reading                                                     (MPa)
Plot a graph of Stress-Strain Graph and Indicate on the graph Yield Strength σY and Ultimate
tensile Strength σUS


Use the graph to calculate the Young Modulus of Elasticity (E)


What is the Percentage Elongation (Ductility) of Specimen?


Calculate Percentage Deviation of Young Modulus from the Reference Book.
For Duralumin


        Quantity                                      Symbol Observation

        Length of Specimen (mm)                       L

        Breadth of Specimen (mm)                      B

        Height of Specimen (mm)                       H

        Initial Scale Reading (mm)                    R1

        Final Scale Reading (mm)                      R2

        Cross Sectional Area of Specimen (mm2)        A


Number of      Dial Indicator                                              Normal Stress
                                     Elongation(mm)        Force(N)                        Strain
Turns          Reading                                                     (MPa)
Plot a graph of Stress-Strain Graph and Indicate on the graph Yield Strength σY and Ultimate
tensile Strength σUS


Use the graph to calculate the Young Modulus of Elasticity (E)


What is the Percentage Elongation (Ductility) of Specimen?


Calculate Percentage Deviation of Young Modulus from the Reference Book.
For Plastic


        Quantity                                      Symbol Observation

        Length of Specimen (mm)                       L

        Breadth of Specimen (mm)                      B

        Height of Specimen (mm)                       H

        Initial Scale Reading (mm)                    R1

        Final Scale Reading (mm)                      R2

        Cross Sectional Area of Specimen (mm2)        A


Number of      Dial Indicator                                              Normal Stress
                                     Elongation(mm)        Force(N)                        Strain
Turns          Reading                                                     (MPa)
Plot a graph of Stress-Strain Graph and Indicate on the graph Yield Strength σY and Ultimate
tensile Strength σUS


Use the graph to calculate the Young Modulus of Elasticity (E)


What is the Percentage Elongation (Ductility) of Steel Specimen?


Calculate Percentage Deviation of Young Modulus from the Reference Book.

Weitere ähnliche Inhalte

Was ist angesagt?

IMPACT TEST REPORT ...
IMPACT TEST REPORT                                                           ...IMPACT TEST REPORT                                                           ...
IMPACT TEST REPORT ...musadoto
 
Group presentation for tensile testing a4
Group presentation for tensile testing   a4Group presentation for tensile testing   a4
Group presentation for tensile testing a4Prajwal Vc
 
Lab report engineering materials lab - tensile test
Lab report   engineering materials lab - tensile testLab report   engineering materials lab - tensile test
Lab report engineering materials lab - tensile testMuhammad Yossi
 
Rockwell hardness test
Rockwell hardness testRockwell hardness test
Rockwell hardness testPrangonDas1
 
Compression test verification_for_a_wood
Compression test verification_for_a_woodCompression test verification_for_a_wood
Compression test verification_for_a_woodSumitThakur755213
 
Tensile testing ppt
Tensile testing pptTensile testing ppt
Tensile testing pptRahul Yadav
 
Tensile, Impact and Hardness Testing of Mild Steel
Tensile, Impact and Hardness Testing of Mild SteelTensile, Impact and Hardness Testing of Mild Steel
Tensile, Impact and Hardness Testing of Mild SteelGulfam Hussain
 
1018 Steel and PLA Tensile Test and Hardness Report
1018 Steel and PLA Tensile Test and Hardness Report1018 Steel and PLA Tensile Test and Hardness Report
1018 Steel and PLA Tensile Test and Hardness ReportTobyBarrons
 
lab report structure deflection of cantilever
lab report structure deflection of cantileverlab report structure deflection of cantilever
lab report structure deflection of cantileverYASMINE HASLAN
 
Tensile test report
Tensile test reportTensile test report
Tensile test reportertanoguz
 
Rockwell hardnes testing
Rockwell hardnes testingRockwell hardnes testing
Rockwell hardnes testingUsman
 
Deflection of simply supported beam and cantilever
Deflection of simply supported beam and cantileverDeflection of simply supported beam and cantilever
Deflection of simply supported beam and cantileveryashdeep nimje
 
Universal testing machines
Universal testing machinesUniversal testing machines
Universal testing machinesGulfam Hussain
 
Charpy impact test
Charpy impact testCharpy impact test
Charpy impact testMoetiManogo
 
Mechanical Testing : Testing Of Materials
Mechanical Testing : Testing Of MaterialsMechanical Testing : Testing Of Materials
Mechanical Testing : Testing Of MaterialsDr.S.Thirumalvalavan
 

Was ist angesagt? (20)

IMPACT TEST REPORT ...
IMPACT TEST REPORT                                                           ...IMPACT TEST REPORT                                                           ...
IMPACT TEST REPORT ...
 
Group presentation for tensile testing a4
Group presentation for tensile testing   a4Group presentation for tensile testing   a4
Group presentation for tensile testing a4
 
Lab report engineering materials lab - tensile test
Lab report   engineering materials lab - tensile testLab report   engineering materials lab - tensile test
Lab report engineering materials lab - tensile test
 
Rockwell hardness test
Rockwell hardness testRockwell hardness test
Rockwell hardness test
 
Compression test verification_for_a_wood
Compression test verification_for_a_woodCompression test verification_for_a_wood
Compression test verification_for_a_wood
 
Tensile testing ppt
Tensile testing pptTensile testing ppt
Tensile testing ppt
 
Tensile test
Tensile testTensile test
Tensile test
 
Tensile, Impact and Hardness Testing of Mild Steel
Tensile, Impact and Hardness Testing of Mild SteelTensile, Impact and Hardness Testing of Mild Steel
Tensile, Impact and Hardness Testing of Mild Steel
 
Tensile test
Tensile testTensile test
Tensile test
 
1018 Steel and PLA Tensile Test and Hardness Report
1018 Steel and PLA Tensile Test and Hardness Report1018 Steel and PLA Tensile Test and Hardness Report
1018 Steel and PLA Tensile Test and Hardness Report
 
lab report structure deflection of cantilever
lab report structure deflection of cantileverlab report structure deflection of cantilever
lab report structure deflection of cantilever
 
Tensile test report
Tensile test reportTensile test report
Tensile test report
 
Rockwell hardnes testing
Rockwell hardnes testingRockwell hardnes testing
Rockwell hardnes testing
 
Deflection of simply supported beam and cantilever
Deflection of simply supported beam and cantileverDeflection of simply supported beam and cantilever
Deflection of simply supported beam and cantilever
 
Universal testing machines
Universal testing machinesUniversal testing machines
Universal testing machines
 
4 tension test
4 tension test4 tension test
4 tension test
 
Charpy impact test
Charpy impact testCharpy impact test
Charpy impact test
 
UTM
UTMUTM
UTM
 
Strength of Materials
Strength of MaterialsStrength of Materials
Strength of Materials
 
Mechanical Testing : Testing Of Materials
Mechanical Testing : Testing Of MaterialsMechanical Testing : Testing Of Materials
Mechanical Testing : Testing Of Materials
 

Andere mochten auch

Optimising interactive advertising and marketing by Human Dialogue
Optimising interactive advertising and marketing by Human DialogueOptimising interactive advertising and marketing by Human Dialogue
Optimising interactive advertising and marketing by Human DialogueHuman Dialogue
 
Corrosion Engineering 2012
Corrosion Engineering 2012Corrosion Engineering 2012
Corrosion Engineering 2012Ola Odejayi
 
Art Direction Vs The Web (FOWD London 2012)
Art Direction Vs The Web (FOWD London 2012)Art Direction Vs The Web (FOWD London 2012)
Art Direction Vs The Web (FOWD London 2012)James Fenton
 
Plasma processing in extractive metallurgy
Plasma processing in extractive metallurgyPlasma processing in extractive metallurgy
Plasma processing in extractive metallurgySum K
 
Biztech Day Online Branding 101
Biztech Day Online Branding 101Biztech Day Online Branding 101
Biztech Day Online Branding 101Nicole Nicolay
 
Scriptwriting for radio
Scriptwriting for radioScriptwriting for radio
Scriptwriting for radionbrownbridge
 
DOCSKC-_566159-v1-Outline_for_Best_Practices_-_How_Administrative_Assistants_...
DOCSKC-_566159-v1-Outline_for_Best_Practices_-_How_Administrative_Assistants_...DOCSKC-_566159-v1-Outline_for_Best_Practices_-_How_Administrative_Assistants_...
DOCSKC-_566159-v1-Outline_for_Best_Practices_-_How_Administrative_Assistants_...Janey (Jaye) Pritchett
 
Interactive Advertising on the Windows Media Center Platform
Interactive Advertising on the Windows Media Center PlatformInteractive Advertising on the Windows Media Center Platform
Interactive Advertising on the Windows Media Center Platformgoodfriday
 
CambridgeIP Nanomaterials Trends
CambridgeIP Nanomaterials TrendsCambridgeIP Nanomaterials Trends
CambridgeIP Nanomaterials TrendsCambridgeIP Ltd
 
Dancing & Disappearing Water: Magic or Surface Engineering?
Dancing & Disappearing Water: Magic or Surface Engineering?Dancing & Disappearing Water: Magic or Surface Engineering?
Dancing & Disappearing Water: Magic or Surface Engineering?Society of Women Engineers
 

Andere mochten auch (12)

Optimising interactive advertising and marketing by Human Dialogue
Optimising interactive advertising and marketing by Human DialogueOptimising interactive advertising and marketing by Human Dialogue
Optimising interactive advertising and marketing by Human Dialogue
 
Corrosion Engineering 2012
Corrosion Engineering 2012Corrosion Engineering 2012
Corrosion Engineering 2012
 
Art Direction Vs The Web (FOWD London 2012)
Art Direction Vs The Web (FOWD London 2012)Art Direction Vs The Web (FOWD London 2012)
Art Direction Vs The Web (FOWD London 2012)
 
Plasma processing in extractive metallurgy
Plasma processing in extractive metallurgyPlasma processing in extractive metallurgy
Plasma processing in extractive metallurgy
 
Biztech Day Online Branding 101
Biztech Day Online Branding 101Biztech Day Online Branding 101
Biztech Day Online Branding 101
 
Scriptwriting for radio
Scriptwriting for radioScriptwriting for radio
Scriptwriting for radio
 
SURFACE ANALYSIS TECHNIQUES
SURFACE ANALYSIS TECHNIQUES SURFACE ANALYSIS TECHNIQUES
SURFACE ANALYSIS TECHNIQUES
 
DOCSKC-_566159-v1-Outline_for_Best_Practices_-_How_Administrative_Assistants_...
DOCSKC-_566159-v1-Outline_for_Best_Practices_-_How_Administrative_Assistants_...DOCSKC-_566159-v1-Outline_for_Best_Practices_-_How_Administrative_Assistants_...
DOCSKC-_566159-v1-Outline_for_Best_Practices_-_How_Administrative_Assistants_...
 
Interactive Advertising on the Windows Media Center Platform
Interactive Advertising on the Windows Media Center PlatformInteractive Advertising on the Windows Media Center Platform
Interactive Advertising on the Windows Media Center Platform
 
Tribology Life Member
Tribology Life MemberTribology Life Member
Tribology Life Member
 
CambridgeIP Nanomaterials Trends
CambridgeIP Nanomaterials TrendsCambridgeIP Nanomaterials Trends
CambridgeIP Nanomaterials Trends
 
Dancing & Disappearing Water: Magic or Surface Engineering?
Dancing & Disappearing Water: Magic or Surface Engineering?Dancing & Disappearing Water: Magic or Surface Engineering?
Dancing & Disappearing Water: Magic or Surface Engineering?
 

Ähnlich wie Tensile testing experiment

Mc testing Lec 2.pptx
Mc testing Lec 2.pptxMc testing Lec 2.pptx
Mc testing Lec 2.pptxDrAjitKatkar
 
Tensile Strength
Tensile StrengthTensile Strength
Tensile StrengthVICTOR ROY
 
Tensile Strengthy
Tensile StrengthyTensile Strengthy
Tensile StrengthyVICTOR ROY
 
Experiment 4 - Testing of Materials in Tension Object .docx
Experiment 4 - Testing of Materials in Tension  Object .docxExperiment 4 - Testing of Materials in Tension  Object .docx
Experiment 4 - Testing of Materials in Tension Object .docxSANSKAR20
 
Chpr3 experimental
Chpr3 experimentalChpr3 experimental
Chpr3 experimentalRaj Shekaran
 
A2 strain gages_2003
A2 strain gages_2003A2 strain gages_2003
A2 strain gages_2003supreeth15
 
stress strain.pptx
stress strain.pptxstress strain.pptx
stress strain.pptxssuser8cba2c
 
Mechanical properties
Mechanical propertiesMechanical properties
Mechanical propertiesYatin Singh
 
Demonstration of Mechanical Behaviour of Material Using a Practical Approach
Demonstration of Mechanical Behaviour of Material Using a Practical Approach Demonstration of Mechanical Behaviour of Material Using a Practical Approach
Demonstration of Mechanical Behaviour of Material Using a Practical Approach Dr. Gaurav Kumar Gugliani
 
Demonstration of Mechanical Behaviour of Material Using a Practical Approach
Demonstration of Mechanical Behaviour of Material Using a Practical Approach Demonstration of Mechanical Behaviour of Material Using a Practical Approach
Demonstration of Mechanical Behaviour of Material Using a Practical Approach Dr.Gaurav Kumar Gugliani
 
Fastener technicalreferenceguide
Fastener technicalreferenceguideFastener technicalreferenceguide
Fastener technicalreferenceguideChetan vadodariya
 
fdocuments.in_tensile-test-presentation-55845f0fef46d.ppt
fdocuments.in_tensile-test-presentation-55845f0fef46d.pptfdocuments.in_tensile-test-presentation-55845f0fef46d.ppt
fdocuments.in_tensile-test-presentation-55845f0fef46d.pptRanjithAk38
 
Rheology-Terminology.pdf
Rheology-Terminology.pdfRheology-Terminology.pdf
Rheology-Terminology.pdfabiyotnegu1
 
mechanical properties
mechanical propertiesmechanical properties
mechanical propertiesKum Visal
 
Aircraft materials lecture 3
Aircraft materials lecture 3Aircraft materials lecture 3
Aircraft materials lecture 3Kanupriya jhanji
 

Ähnlich wie Tensile testing experiment (20)

Mc testing Lec 2.pptx
Mc testing Lec 2.pptxMc testing Lec 2.pptx
Mc testing Lec 2.pptx
 
Tensile Strength
Tensile StrengthTensile Strength
Tensile Strength
 
Tensile Strengthy
Tensile StrengthyTensile Strengthy
Tensile Strengthy
 
Experiment 4 - Testing of Materials in Tension Object .docx
Experiment 4 - Testing of Materials in Tension  Object .docxExperiment 4 - Testing of Materials in Tension  Object .docx
Experiment 4 - Testing of Materials in Tension Object .docx
 
Chpr3 experimental
Chpr3 experimentalChpr3 experimental
Chpr3 experimental
 
A2 strain gages_2003
A2 strain gages_2003A2 strain gages_2003
A2 strain gages_2003
 
stress strain.pptx
stress strain.pptxstress strain.pptx
stress strain.pptx
 
Stress strain curve
Stress strain curveStress strain curve
Stress strain curve
 
Mechanical properties
Mechanical propertiesMechanical properties
Mechanical properties
 
Chap02-A.pdf
Chap02-A.pdfChap02-A.pdf
Chap02-A.pdf
 
1-tension.pdf
1-tension.pdf1-tension.pdf
1-tension.pdf
 
Demonstration of Mechanical Behaviour of Material Using a Practical Approach
Demonstration of Mechanical Behaviour of Material Using a Practical Approach Demonstration of Mechanical Behaviour of Material Using a Practical Approach
Demonstration of Mechanical Behaviour of Material Using a Practical Approach
 
Demonstration of Mechanical Behaviour of Material Using a Practical Approach
Demonstration of Mechanical Behaviour of Material Using a Practical Approach Demonstration of Mechanical Behaviour of Material Using a Practical Approach
Demonstration of Mechanical Behaviour of Material Using a Practical Approach
 
Fastener technicalreferenceguide
Fastener technicalreferenceguideFastener technicalreferenceguide
Fastener technicalreferenceguide
 
fdocuments.in_tensile-test-presentation-55845f0fef46d.ppt
fdocuments.in_tensile-test-presentation-55845f0fef46d.pptfdocuments.in_tensile-test-presentation-55845f0fef46d.ppt
fdocuments.in_tensile-test-presentation-55845f0fef46d.ppt
 
Rheology-Terminology.pdf
Rheology-Terminology.pdfRheology-Terminology.pdf
Rheology-Terminology.pdf
 
mechanical properties
mechanical propertiesmechanical properties
mechanical properties
 
Fracture Mechanics & Failure Analysis:Lecture Toughness and fracture toughness
Fracture Mechanics & Failure Analysis:Lecture Toughness and fracture toughnessFracture Mechanics & Failure Analysis:Lecture Toughness and fracture toughness
Fracture Mechanics & Failure Analysis:Lecture Toughness and fracture toughness
 
Aircraft materials lecture 3
Aircraft materials lecture 3Aircraft materials lecture 3
Aircraft materials lecture 3
 

Tensile testing experiment

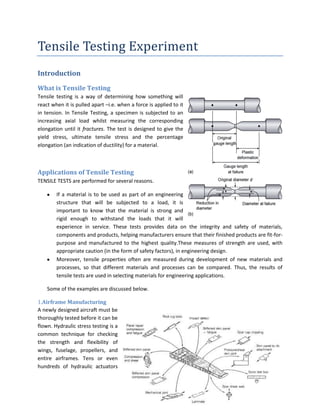
  • 1. Tensile Testing Experiment Introduction What is Tensile Testing Tensile testing is a way of determining how something will react when it is pulled apart –i.e. when a force is applied to it in tension. In Tensile Testing, a specimen is subjected to an increasing axial load whilst measuring the corresponding elongation until it fractures. The test is designed to give the yield stress, ultimate tensile stress and the percentage elongation (an indication of ductility) for a material. Applications of Tensile Testing TENSILE TESTS are performed for several reasons. If a material is to be used as part of an engineering structure that will be subjected to a load, it is important to know that the material is strong and rigid enough to withstand the loads that it will experience in service. These tests provides data on the integrity and safety of materials, components and products, helping manufacturers ensure that their finished products are fit-for- purpose and manufactured to the highest quality.These measures of strength are used, with appropriate caution (in the form of safety factors), in engineering design. Moreover, tensile properties often are measured during development of new materials and processes, so that different materials and processes can be compared. Thus, the results of tensile tests are used in selecting materials for engineering applications. Some of the examples are discussed below. 1.Airframe Manufacturing A newly designed aircraft must be thoroughly tested before it can be flown. Hydraulic stress testing is a common technique for checking the strength and flexibility of wings, fuselage, propellers, and entire airframes. Tens or even hundreds of hydraulic actuators
  • 2. push and pull at an airframe to test for failures and materials fatigue that might occur under flight conditions. Strain is measured at hundreds of points to qualify test results. 2. Bolts Installation Most fastener applications are designed to support or transmit some form of externally applied load. In bolts testing, Tensile strength is the maximum tension-applied load the fastener can support prior to fracture. Usually, if strength is only requirement carbon steel bolts are sufficient. For special applications, non-ferrous metal bolts can be considered.
  • 3. Theory Tensile Specimens The Shape of the Specimen Consider the typical tensile specimen shown in Figure below. It has enlarged ends or shoulders for gripping. The importantpart of the specimen is the gage section. Thecross-sectional area of the gage section is reducedrelative to that of the remainder of thespecimen so that deformation and failure will be localized in this region. The gage length is theregion over which measurements are made andis centered within the reduced section. Holding the Specimen There are various ways of gripping the specimen, some of which are illustrated in Figure below The end may be screwed into a threaded grip, or it may be pinned; butt ends may be used, or the grip section may be held between wedges.
  • 4. Stress-Strain Curves A tensile test involves mounting the specimen in a machine, such as those described in the previous section, and subjecting it to tension. The tensile force is recorded as a function of the increase in gage length. The Figure shows a typical curve for a ductile material. Such plots of tensile force versus tensile elongation would be of little value if they were not normalized with respect to specimen dimensions.Therefore, engineers commonly use two normalized parameters. 1. Engineering / Normal Stress 2. Engineering / Normal Strain Engineering stress Engineering stress, or normal stress, σ, is definedas where F is the tensile force and A0 is the initialcross-sectional area of the gage section. Units of stress: SI Units: Newton per square meter ( ) = Pascal (Pa) FPS Units: pounds per square inch (psi) Engineering strain Engineering strain, or normal strain,ε, is defined as where L0 is the initial gage length and ΔL is thechange in gage length (L -L0). Units of Strain Strain is measured as . When force-elongation data are converted toengineering stress and strain, a stress-strain curve that is identical in shape to theforce-elongation curve can be plotted. The advantageof dealing with stress versus strainrather than load versus elongation is that thestress-strain curve is virtually independent ofspecimen dimensions.
  • 5. Elastic versus Plastic Deformation. Whena solid material is subjected to small stresses, thebonds between the atoms are stretched. Whenthe stress is removed, the bonds relax and thematerial returns to its original shape. This reversible deformation is called elastic deformation. At higher stresses, planes of atomsslide over one another. This deformation, whichis not recovered when the stress is removed, istermed plastic deformation. NoteThe term“plastic deformation” does not mean that the deformedmaterial is a plastic (a polymeric material). For most materials, the initial portion of the Stress strain curve is linear. The slope of this linear region iscalled the elastic modulus or Young’s modulus: When the stress rises high enough, the stress-strainbehavior will cease to be linear and thestrain will not disappear completely on unloading.The strain that remains is called plasticstrain. The first plastic strain usually correspondsto the first deviation from linearity. Yield Strength It is tempting to define an elastic limit as thestress at which plastic deformation first occursand a proportional limit as the stress at whichthe stress-strain curve first deviates from linearity. The beginning of the plasticityis usually described by an offset yieldstrength, which can be measured with greaterreproducibility. It can be found by constructinga straight line parallel to the initial linear portionof the stress-strain curve, but offset byε = 0.002 or 0.2%. The yield strength is the stress atwhich this line intersects the stress-strain curve. The logic is that if the material hadbeen loaded to this stress and then unloaded, theunloading path would have been along this offsetline and would have resulted in a plastic strain of ε 0.2%. Tensile Strength The tensile strength (ultimate strength) is definedas the highest value of engineering stress (shown in figure below). Up to the maximum load, the deformationshould be uniform along the gage section.With ductile materials, the tensile strengthcorresponds to the point at which the deformationstarts to localize, forming a neck (Fig. a).Less ductile materials fracture before they neck(Fig. b). In this case, the fracture strength is thetensile strength. Indeed, very brittle materials(e.g., glass at room temperature) do not yieldbefore fracture (Fig. c). Such materials havetensile strengths but not yield strengths.
  • 6. Ductility There are two common measuresused to describe the ductility of a material. One is the percent elongation, which is defined simplyas where L0 is the initial gage length and Lf is thelength of the gage section at fracture. Measurementsmay be made on the broken pieces or underload. For most materials, the amount of elasticelongation is so small that the two areequivalent. When this is not so (as with brittlemetals or rubber), the results should statewhether or not the elongation includes an elasticcontribution. The other common measure ofductility is percent reduction of area, which isdefined as where A0 and Af are the initial cross-sectionalarea and the cross-sectional area at fracture, respectively.If failure occurs without necking, onecan be calculated from the other: After a neck has developed, the two are nolonger related. Percent elongation, as a measureof ductility, has the disadvantage that it is reallycomposed of two parts: the uniform elongationthat occurs before necking, and the localizedelongation that occurs during necking. The secondpart is sensitive to the specimen shape.When a gage section that is very long (relativeto its diameter), the necking elongation convertedto percent is very small. In contrast, witha gage section that is short (relative to its diameter), the necking elongation can account formost of the total elongation.
  • 7. For round bars, this problem has been solved by standardizing the ratio of gage length todiameter to 4:1. Within a series of bars, all withthe same gage-length-to-diameter ratio, thenecking elongation will be the same fraction ofthe total elongation. However, there is no simpleway to make meaningful comparisons of percentelongation from such standardized bars with thatmeasured on sheet tensile specimens or wire.With sheet tensile specimens, a portion of theelongation occurs during diffuse necking, andthis could be standardized by maintaining thesame ratio of width to gage length. However, aportion of the elongation also occurs duringwhat is called localized necking, and this dependson the sheet thickness. For tensile testingof wire, it is impractical to have a reduced section,and so the ratio of gage length to diameteris necessarily very large. Necking elongationcontributes very little to the total elongation. Percent reduction of area, as a measure ofductility, has the disadvantage that with veryductile materials it is often difficult to measurethe final cross-sectional area at fracture. This isparticularly true of sheet specimens.
  • 8. The Equipment The Mini Tensile Tester provides means of stretching a specimen to destruction to produce a force- elongation graph from which the yield stress and ultimate stress can be extracted. Note:Due to the simplistic nature of the equipment and chucks, an accurate answer for the modulus for metallic materials will not be found. This is because the movement in the chucks and the mechanisms can be of a greater magnitude than the extension in the elastic region. Operating the Apparatus The hand-wheel at the top of the machine pulls the top of the specimen up by 1mm per turn. The bottom of the specimen is connected to the large springs, the deflection of which is measured on dial indicator. Thus, the specimen elongation is given by subtracting the Dial indicator reading from the number of turns. For example if the hand-wheel has turned three times the dial indicator reading from the number of turns is 2.83 the elongation = 3.00 – 2.83 = 0.17mm. The dial indicator also provides an indication of the force being applied to the specimen; since the springs have a combined rate of 100N/mm each dial indicator division is equal to one Newton. So if the dial indicator reads 2.83mm then the force is 283N. Safety The guards provided with this machine should be fitted at all times. On specimen failure the mechanism snaps back rapidly and students should be aware of this. NEVER operate this machine unless the guards are in place. Procedure: 1. Select an appropriate specimen for testing 2. Measure length (L) of specimen’s thin part as show in the diagram below. 3. Measure the cross sectional breadth (B) and height (H) of the specimen rod using micrometer screw gauge. 4. Take an initial reading against the scale at the back. Let this be R1. 5. Take up the slack in the mechanism by tuning the hand-wheel until the dial indicator begins to move. 6. Align the grove on the hand-wheel to the nearest mark on the scale, and zero the dial indicator using the outer bezel. 7. Turn the hand-wheel and take dial indicator readings in the increments as shown below a. For Steel and Duralumin ½ turn increments are acceptable through the range. b. For Aluminium turn increments are acceptable through the range. c. For Plastics turn increments for the first three turns are acceptable, then increments of 2 turns until destruction 8. Towards the end of the test the material will yield rapidly and an accurate dial indicator reading may not be easily seen. If the reading does not stabilize after 20-30 seconds, then take the specimen to fracture by continually turning the hand-wheel until it snaps (with a bang!).
  • 9. 9. Wind the hand-wheel back until the ends of the specimen touch and read off the new length o the scale at the back (R2). Specimen Test Section Dimensions (Nominal)
  • 10. Observation Charts For Steel Quantity Symbol Observation Length of Specimen (mm) L Breadth of Specimen (mm) B Height of Specimen (mm) H Initial Scale Reading (mm) R1 Final Scale Reading (mm) R2 Cross Sectional Area of Specimen (mm2) A Number of Dial Indicator Normal Stress Elongation(mm) Force(N) Strain Turns Reading (MPa)
  • 11. Plot a graph of Stress-Strain Graph and Indicate on the graph Yield Strength σY and Ultimate tensile Strength σUS Use the graph to calculate the Young Modulus of Elasticity (E) What is the Percentage Elongation (Ductility) of Specimen? Calculate Percentage Deviation of Young Modulus from the Reference Book.
  • 12. For Alumnium Quantity Symbol Observation Length of Specimen (mm) L Breadth of Specimen (mm) B Height of Specimen (mm) H Initial Scale Reading (mm) R1 Final Scale Reading (mm) R2 Cross Sectional Area of Specimen (mm2) A Number of Dial Indicator Normal Stress Elongation(mm) Force(N) Strain Turns Reading (MPa)
  • 13. Plot a graph of Stress-Strain Graph and Indicate on the graph Yield Strength σY and Ultimate tensile Strength σUS Use the graph to calculate the Young Modulus of Elasticity (E) What is the Percentage Elongation (Ductility) of Specimen? Calculate Percentage Deviation of Young Modulus from the Reference Book.
  • 14. For Duralumin Quantity Symbol Observation Length of Specimen (mm) L Breadth of Specimen (mm) B Height of Specimen (mm) H Initial Scale Reading (mm) R1 Final Scale Reading (mm) R2 Cross Sectional Area of Specimen (mm2) A Number of Dial Indicator Normal Stress Elongation(mm) Force(N) Strain Turns Reading (MPa)
  • 15. Plot a graph of Stress-Strain Graph and Indicate on the graph Yield Strength σY and Ultimate tensile Strength σUS Use the graph to calculate the Young Modulus of Elasticity (E) What is the Percentage Elongation (Ductility) of Specimen? Calculate Percentage Deviation of Young Modulus from the Reference Book.
  • 16. For Plastic Quantity Symbol Observation Length of Specimen (mm) L Breadth of Specimen (mm) B Height of Specimen (mm) H Initial Scale Reading (mm) R1 Final Scale Reading (mm) R2 Cross Sectional Area of Specimen (mm2) A Number of Dial Indicator Normal Stress Elongation(mm) Force(N) Strain Turns Reading (MPa)
  • 17. Plot a graph of Stress-Strain Graph and Indicate on the graph Yield Strength σY and Ultimate tensile Strength σUS Use the graph to calculate the Young Modulus of Elasticity (E) What is the Percentage Elongation (Ductility) of Steel Specimen? Calculate Percentage Deviation of Young Modulus from the Reference Book.