Making communications land - Are they received and understood as intended? we...
Cost & fm
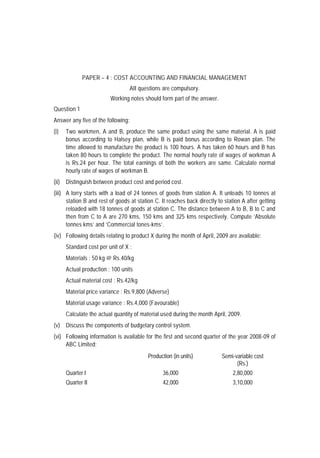
1. PAPER – 4 : COST ACCOUNTING AND FINANCIAL MANAGEMENT
All questions are compulsory.
Working notes should form part of the answer.
Question 1
Answer any five of the following:
(i) Two workmen, A and B, produce the same product using the same material. A is paid
bonus according to Halsey plan, while B is paid bonus according to Rowan plan. The
time allowed to manufacture the product is 100 hours. A has taken 60 hours and B has
taken 80 hours to complete the product. The normal hourly rate of wages of workman A
is Rs.24 per hour. The total earnings of both the workers are same. Calculate normal
hourly rate of wages of workman B.
(ii) Distinguish between product cost and period cost.
(iii) A lorry starts with a load of 24 tonnes of goods from station A. It unloads 10 tonnes at
station B and rest of goods at station C. It reaches back directly to station A after getting
reloaded with 18 tonnes of goods at station C. The distance between A to B, B to C and
then from C to A are 270 kms, 150 kms and 325 kms respectively. Compute ‘Absolute
tonnes kms’ and ‘Commercial tones-kms’.
(iv) Following details relating to product X during the month of April, 2009 are available:
Standard cost per unit of X :
Materials : 50 kg @ Rs.40/kg
Actual production : 100 units
Actual material cost : Rs.42/kg
Material price variance : Rs.9,800 (Adverse)
Material usage variance : Rs.4,000 (Favourable)
Calculate the actual quantity of material used during the month April, 2009.
(v) Discuss the components of budgetary control system.
(vi) Following information is available for the first and second quarter of the year 2008-09 of
ABC Limited:
Production (in units) Semi-variable cost
(Rs.)
Quarter I 36,000 2,80,000
Quarter II 42,000 3,10,000
2. PROFESSIONAL COMPETENCE EXAMINATION : JUNE, 2009
You are required to segregate the semi-variable cost and calculate :
(a) Variable cost per unit; and
(b) Total fixed cost. (5 × 2 = 10 Marks)
Answer
(i)
A B
Time Allowed (Hrs.) 100 100
Time Taken (Hrs.) 60 80
Time Saved (Hrs.) 40 20
Let the rate of wages of the worker B is Rs.x per hour
Normal Wages 1440 80x
(Time taken × Hourly rate of wages) (60×24)
Bonus 480 16x
20
(1/2 × 40 × 24) (80 x)
100
1920 96x
According to the problem,
Total earnings of A = Total earnings of B
1920 = 96x
1920
x = = Rs.20
96
Hourly rate of wages of the worker is Rs.20 per hour.
Alternative Solution:
In case of worker B, in place of x, it can be written as ‘80x hourly rate’.
Hence final equation will be
96x hourly rate = 1920
1920
Hourly rate of B = = Rs. 20
96
(ii) Product Cost vis-à-vis Period cost
Product costs are associated with the purchase and sale of goods. In the production
scenario, such costs are associated with the acquisition and conversion of materials and
2
3. PAPER – 4 : COST ACCOUNTING AND FINANCIAL MANAGEMENT
all other manufacturing inputs into finished product for sale. Hence under absorption cost,
total manufacturing costs constitute inventoriable or product cost.
Periods costs are the costs, which are not assigned to the products but are charged as
expense against revenue of the period in which they are incurred. General Administration,
marketing, sales and distributor overheads are recognized as period costs.
(iii) Absolute tonnes kms
= tonnes (unit of weight) ×Km (Unit of distance)
= 24 tonnes × 270 kms
+ 14 tonnes × 150 kms
+ 18 tonnes × 325 kms
= 6480 + 2100 + 5850
= 14430 tonnes kms
Commercial Tonnes kms
= Average load × total kms travelled
24 14 18
= tonnes × 745 kms
3
= 13906.67 Tonnes km
(iv) Standard cost of materials for actual output Rs.
[(100 units × 50 kg) × Rs.40 per kg] = 2,00,000
Material Usage Variance 4,000 (F)
1,96,000
Material Price Variance 9,800 (A)
Actual cost of materials used 2,05,800
Actual material cost = Rs.42 per kg.
Rs.2,05,800
Actual quantity of materials used during the month = = 4,900 kg.
42
Alternative solution
Material price variance = Rs. 9800 (A)
Actual price per kg. = Rs. 42
Actual quantity of material used = Rs. 9800/(42-40) = 4900 kg
3
4. PROFESSIONAL COMPETENCE EXAMINATION : JUNE, 2009
(v) Components of budgetary control system
The policy of a business for a defined period is represented by the master budget the
details of which are given in a number of individual budgets called functional budgets.
The functional budgets are broadly grouped under the following heads:
(a) Physical Budgets – Sales Qty, Product Qty., Inventory, Manpower budget.
(b) Cost Budgets – Manufacturing Cost, Administration Cost, sales & distribution cost,
R & D Cost.
(c) Profit Budget
(vi)
Production (Units) Semi Variable Cost (Rs.)
Quarter I 36,000 2,80,000
Quarter II 42,000 3,10,000
Difference 6,000 30,000
Change in Semi Variable Cost
Variable Cost per Unit =
Change in Pr oduction
Rs.30,000
=
6,000 units
= Rs.5 per units
Total Fixed Cost = Semi Veriable Cost – (Production x Variable Cost per Unit)
Total fixed cost in Quarter I :
= 2,80,000 – (36,000 × 5)
= 2,80,000 – 1,80,000
= 1,00,000
Total fixed cost in Quarter II :
= 3,10,000 – (42,000 × 5)
= 3,10,000 – 2,10,000
= 1,00,000
Question 2
Following is the sales budget for the first six months of the year 2009 in respect of PQR Ltd. :
Month : Jan. Feb. March April May June
Sales (units) : 10,000 12,000 14,000 15,000 15,000 16,000
4
5. PAPER – 4 : COST ACCOUNTING AND FINANCIAL MANAGEMENT
Finished goods inventory at the end of each month is expected to be 20% of budgeted sales
quantity for the following month. Finished goods inventory was 2,700 units on January 1,
2009. There would be no work-in-progress at the end of any month.
Each unit of finished product requires two types of materials as detailed below:
Material X : 4 kgs @ Rs.10/kg
Material Y : 6 kgs @ Rs.15/kg
Material on hand on January 1, 2009 was 19,000 kgs of material X and 29,000 kgs of material
Y. Monthly closing stock of material is budgeted to be equal to half of the requirements of next
month’s production.
Budgeted direct labour hour per unit of finished product is ¾ hour.
Budgeted direct labour cost for the first quarter of the year 2009 is Rs.10,89,000.
Actual data for the quarter one, ended on March 31, 2009 is as under:
Actual production quantity : 40,000 units
Direct material cost
(Purchase cost based on materials actually issued to production)
Material X : 1,65,000 kgs @ Rs.10.20/kg
Material Y : 2,38,000 kgs @ Rs.15.10/kg
Actual direct labour hours worked : 32,000 hours
Actual direct labour cost : Rs.13,12,000
Required :
(a) Prepare the following budgets:
(i) Monthly production quantity for the quarter one.
(ii) Monthly raw material consumption quantity budget from January, 2009 to April,
2009.
(iii) Materials purchase quantity budget for the quarter one.
(b) Compute the following variances :
(i) Material cost variance
(ii) Material price variance
(iii) Material usage variance
(iv) Direct labour cost variance
(v) Direct labour rate variance
(vi) Direct labour efficiency variance (6 +9 = 15 Marks)
5
6. PROFESSIONAL COMPETENCE EXAMINATION : JUNE, 2009
Answer
(a) (i) Production Budget for January to March 2009
(Quantitative)
Jan Feb Mar April
Budgeted Sales 10,000 12,000 14,000 15,000
Add: Budgeted Closing Stock 2,400 2,800 3,000 3,000
(20% of sales of next month)
12,400 14,800 17,000 18,000
Less: Opening Stock 2,700 2,400 2,800 3,000
Budgeted Output 9,700 12,400 14,200 15,000
Total Budgeted Output for the Quarter ended March 31, 2009
= (9,700 + 12,400 + 14,200)
= 36,300 units.
(ii) Raw Material Consumption Budget (in quantity)
Month Budgeted Output Material ‘X’ @ 4 kg Material ‘Y’ @ 6 kg
(Units) per unit (Kg) per unit (Kg)
Jan 9,700 38,800 58,200
Feb 12,400 49,600 74,400
Mar 14,200 56,800 85,200
Apr 15,000 60,000 90,000
Total 2,05,200 3,07,800
(iii) Raw Materials Purchase Budget (in quantity)
for the Quarter ended (March 31,2009)
Material X (kg) Material Y (kg)
Raw material required for production 1,45,200 2,17,800
Add: Closing Stock of raw material 30,000 45,000
1,75,200 2,62,800
Less: Opening Stock of raw material 19,000 29,000
Material to be purchased 1,56,200 2,33,800
6
7. PAPER – 4 : COST ACCOUNTING AND FINANCIAL MANAGEMENT
Alternative Solution
(iii) Raw Materials Purchase Budget (in quantity)
for the Quarter ended (March 31,2009)
Material X
Jan Feb Mar Total
Raw material required for
production(x) 38800 49600 56800 145200
Add: Closing stock of raw material 24800 28400 30000 83200
63600 78000 86800 228400
Less: Opening stock of raw material X 19000 24800 28400 72200
Materials to be purchased X 44600 53200 58400 156200
Raw Materials Purchase Budget (in quantity)
for the Quarter ended (March 31,2009)
Material Y
Jan Feb Mar Total
Raw material required for production(Y) 58200 74400 85200 217800
Add: Closing stock of raw material 37200 42600 45000 124800
95400 117000 130200 342600
Less: Opening stock of raw material Y 29000 37200 42600 108800
Materials to be purchased Y 66400 79800 87600 233800
(b) Calculation of Material Cost Variance
(a) (b)
Std Price × Std Mix × Std Qty for actual output Std. Price × Std. Mix × Actual Qty.
X – 10 × 4 × 40,000 = 16,00,000 4
X – 10 × × 4, 03,000 = 16,12,000
10
Y – 15 × 6 × 40,000 = 36,00,000 6
Y – 15 × × 4,03,000 = 36,27,000
10
52,00,000
52,39,000
7
8. PROFESSIONAL COMPETENCE EXAMINATION : JUNE, 2009
(c) (d)
Std Price × Actual Mix × Actual Qty Actual Price × Actual Mix × Actual Qty.
X – 10 × 1,65,000 = 16,50,000 X – 10.20 × 1,65,000 = 16,83,000
Y – 15 × 2,38,000 = 35,70,000 Y – 15.10 × 2,38,000 35,93,800
52,20,000 52,76,800
Direct Material Usage Variance = (a – c)
X– 16,00,000 – 16,50,000 = 50,000 (A)
Y– 36,00,000 – 35,70,000 = 30,000 (F)
52,00,000 – 52,20,000 = 20,000 (A)
Direct Material Price Variance = (c – d)
X– 16,50,000 – 16,83,000 = 33,000 (A)
Y– 35,70,000 – 35,93,800 = 23,800 (A)
52,20,000 – 52,76,800 = 56,800 (A)
Direct Material Cost Variance = (a – d)
X– 16,00,000 – 16,83,000 = 83,000 (A)
Y– 36,00,000 – 35,93,800 = 6,200 (F)
52,00,000 – 52,76,800 = 76,800 (A)
Verification:
Direct Material Cost Variance = Direct Material Usage Variance + Direct Material Price
Variance
= 20,000 (A) + 56,800 (A)
= 76,800 (A)
Alternative Solution (Total basis)
Direct Material Cost Variance = 52, 00,000 – 52, 76,800 =76,800 (A)
Direct Material Price Variance = 52, 20,000 – 52, 76,800 = 56,800 (A)
Direct Material Usage Variance = 52, 20,000 -52, 00,000 = 20,000 (A)
Calculation of Labour Cost Variances:
Budgeted output for the quarter = 36,300 units
Budgeted direct labour hours = 36,300 × ¾ hrs.
= 27,225 hours
8
9. PAPER – 4 : COST ACCOUNTING AND FINANCIAL MANAGEMENT
Standard or Budgeted labour rate per hour
Budgeted direct labour cos t
=
Budgeted direct labour hours
Rs.10,89,000
= = Rs.40
27,225 hours
Standard labour hours for actual output:
= 40,000 units × ¾ hour
= 30,000 hours
Rs.13,12,000
Actual labour hour rate = = Rs.41
32,000 hrs
Direct Labour Efficiency Variance = Standard Rate × (Std. hrs – Actual hrs.)
= Rs.40 × (30,000 – 32,000)
= Rs.80,000 (A)
Direct Labour Rate Variance = Actual hrs. × (Std. Rate – Actual Rate)
= 32,000 × (40 – 41)
= Rs.32,000 (A)
Direct Labour Cost Variance = (Std. rate × Std. hrs.) – (Actual rate × Actual hrs.)
= (40 × 30,000) – (41 × 32,000)
= 12,00,000 – 13,12,000
= 1,12,000 (A)
Verification:
Direct Labour Cost Variance = Direct Labour Efficiency Variance + Direct Labour Rate Variance
= Rs.80,000 (A) + Rs.32,000 (A)
= 1,12,000 (A)
Question 3
(a) A manufacturing company has disclosed a net loss of Rs.2,13,000 as per their cost
accounting records for the year ended March 31, 2009. However, their financial
accounting records disclosed a net loss of Rs.2,58,000 for the same period. A scrutiny of
data of both the sets of books of accounts revealed the following information:
9
10. PROFESSIONAL COMPETENCE EXAMINATION : JUNE, 2009
Rs.
(i) Factory overheads underabsorbed 5,000
(ii) Administration overheads overabsorbed 3,000
(iii) Depreciation charged in financial accounts 70,000
(iv) Depreciation charged in cost accounts 80,000
(v) Interest on investments not included in cost accounts 20,000
(vi) Income-tax provided in financial accounts 65,000
(vii) Transfer fees (credit in financial accounts) 2,000
(viii) Preliminary expenses written off 3,000
(ix) Over-valuation of closing stock of finished goods in cost accounts 7,000
Prepare a Memorandum Reconciliation Account. (7 Marks)
(b) Describe briefly, how joint costs upto the point of separation may be apportioned
amongst the joint products under the following methods:
(i) Average unit cost method
(ii) Contribution margin method
(iii) Market value at the point of separation
(iv) Market value after further processing
(v) Net realizable value method. (9 Marks)
Answer
(a) Memorandum Reconciliation Account
Particulars Rs. Particulars Rs.
To Net loss as per costing 2,13,000 By Administrative overhead 3,000
books over absorbed in costs
To Factory overheads 5,000 By Depreciation over charged 10,000
under absorbed in cost books (80,000 –
70,000)
To Income tax not provided 65,000 By Interest on investments not 20,000
in cost books included in cost books
To Preliminary expenses 3,000 By Transfer fees not 2,000
written off in financial considered in cost books
books
10
11. PAPER – 4 : COST ACCOUNTING AND FINANCIAL MANAGEMENT
To Over-valuation of 7,000 By Net loss as per financial 2,58,000
Closing Stock of books
finished goods in cost
books
2,93,000 2,93,000
(b) Methods of apportioning joint cost among the joint products:
(i) Average Unit Cost Method: under this method, total process cost (upto the point
of separation) is divided by total units of joint products produced. On division
average cost per unit of production is obtained. The effect of application of this
method is that all joint products will have uniform cost per unit.
(ii) Contribution Margin Method: under this method joint costs are segregated into
two parts – variable and fixed. The variable costs are apportioned over the joint
products on the basis of units produced (average method) or physical quantities. If
the products are further processed, then all variable cost incurred be added to the
variable cost determined earlier. Then contribution is calculated by deducting
variable cost from their respective sales values. The fixed costs are then
apportioned over the joint products on the basis of contribution ratios.
(iii) Market Value at the Time of Separation: This method is used for apportioning
joint costs to joint products upto the split off point. It is difficult to apply if the market
value of the products at the point of separation are not available. The joint cost may
be apportioned in the ratio of sales values of different joint products.
(iv) Market Value after further Processing: Here the basis of apportionment of joint
costs is the total sales value of finished products at the further processing. The use
of this method is unfair where further processing costs after the point of separation
are disproportionate or when all the joint products are not subjected to further
processing.
(v) Net Realisable Value Method: Here joint costs is apportioned on the basis of net
realisable value of the joint products,
Net Realisable Value = Sale value of joint products (at finished stage)
(-) estimated profit margin
(-) selling & distribution expenses, if any
(-) post split off cost
Question 4
Answer any three of the following:
(i) Discuss accounting treatment of spoilage and defectives in cost accounting.
(ii) Discuss accounting treatment of idle capacity costs in cost accounting.
11
12. PROFESSIONAL COMPETENCE EXAMINATION : JUNE, 2009
(iii) A contract is estimated to be 80% complete in its first year of construction as certified.
The contractee pays 75% of value of work certified, as and when certified and makes the
final payment on the completion of contract. Following information is available for the first
year:
Rs.
Cost of work-in-progress uncertified 8,000
Profit transferred to Profit & Loss A/c at the end of year I on incomplete 60,000
contract
Cost of work to date 88,000
Calculate the value of work- in-progress certified and amount of contract price.
(iv) Product Z has a profit-volume ratio of 28%. Fixed operating costs directly attributable to
product Z during the quarter II of the financial year2009-10 will be Rs.2,80,000.
Calculate the sales revenue required to achieve a quarterly profit of Rs. 70,000.
(3 x 3 = 9 Marks)
Answer
(i) Accounting of Spoilage and Defectives:
Spoilage is the tem used for materials which are badly damaged in manufacturing
operations, and it cannot rectified economically and hence taken out of the process to be
disposed of in some manner without further processing.
Normal spoilage costs are included in costs either charging it to production order or by
charging it to production overheads so that it is spread over all products. Any value
realized from spoilage is credited to production order or production overhead account as
the case may be.
Cost of abnormal spoilage is charged to costing P/L A/c.
Defectives: Signifies those units or portions of production which can be rectified and
turned cut as good units by application of additional material, labour or other service.
Defectives are charged to general overheads or department overheads depending upon
their traceability. They are charged to good production, when second have a normal
value and defective rectified into ‘second’ or ‘first’ are normal.
Costing P/L A/c – in case of abnormal nature .
(ii) Treatment of Idle Capacity Cost
(a) If idle capacity is due to unavoidable reasons such as repairs & maintenance,
change over of job etc., a supplementary overhead rate may be used to recover the
idle capacity cost. In this case, the costs are charged to production capacity utilized.
(b) If idle capacity cost is due to avoidable reasons such as faulty planning, power
failure etc, the cost should be charged to P/L A/c.
12
13. PAPER – 4 : COST ACCOUNTING AND FINANCIAL MANAGEMENT
(c) If idle capacity is due to seasonal factors, then the cost should be charged to cost of
production by inflating overhead rates.
(iii) As the contract is 80% complete, so 2/3 rd of the notional profit on cash basis has been
transferred to Profit & Loss A/c in the first year of contract.
2
Amount transferred to Profit & Loss A/c = × Notional Profit × % of cost received
3
2 75
or , 60,000 = × Notional Profit ×
3 100
60,000 3 100
or, Notional Profit =
2 75
= Rs.1,20,000
Computation of Value of Work Certified
Cost of work to date = Rs. 88,000
Add: Notional Profit = Rs.1,20,000
Rs.2,08,000
Less: Cost of Work Uncertified = 8,000
Value of Work Certified = Rs.2,00,000
Since the Value of Work Certified is 80% of the Contract Price, therefore
Value of Work Certified
Contract Price =
80%
Rs.2,00,000
=
80%
= Rs.2,50,000
(iv) P/V ratio = 28%
Quarterly fixed Cost = Rs.2,80,000
Desired Profit = Rs.70,000
Sales revenue required to achieve desired profit
Fixed Cost Desired Pr ofit
=
P / V ratio
2,80,000 70,000
= = Rs.12,50,000
28%
13
14. PROFESSIONAL COMPETENCE EXAMINATION : JUNE, 2009
Question 5
Answer any five of the following:
(i) Write a short note on functions of Treasury department.
(ii) Discuss the concept of American Depository Receipts.
(iii) How is Debt service coverage ratio calculated? What is its significance?
(iv) Discuss conflict in profit versus wealth maximization objective.
(v) Discuss the concept of Debt-Equity or EBIT-EPS indifference point, while determining the
capital structure of a company.
(vi) Discuss the benefits to the originator of Debt Securitization. (5 x 2 = 10 Marks)
Answer
(i) Functions of Treasury Department
(a) Cash Management: The efficient collection and payment of cash both inside the
organization and to third parties is the function of treasury department. Treasury
normally manages surplus funds in an investment portfolio.
(b) Currency Management: The treasury department manages the foreign currency
risk exposure of the company. It advises on the currency to be used when invoicing
overseas sales. It also manages any net exchange exposures in accordance with
the company policy.
(c) Fund Management: Treasury department is responsible for planning and sourcing
of company’s short, medium, and long - term cash needs. It also participates in the
decision on capital structure and forecasts future interest and foreign currency
rates.
(d) Banking: Since short-term finance can come in the form of bank loans or through
the sale of commercial paper in the money market, therefore, treasury department
carries out negotiations with bankers and acts as the initial point of contact with
them.
(e) Corporate Finance: Treasury department is involved with both acquisition and
divestment activities within the group. In addition, it is often responsible for investor
relations.
(ii) Concept of American Depository Receipts
American Depository Receipts (ADRs) are securities offered by non- US companies who
want to list on any of the US exchanges. It is a derivative instrument. It represents a
certain number of company’s shares. These are used by depository bank against a fee
income. ADRs allow US investors to buy shares of these companies without the cost of
14
15. PAPER – 4 : COST ACCOUNTING AND FINANCIAL MANAGEMENT
investing directly in a foreign stock exchange. ADRs are listed on either NYSE or
NASDAQ. It facilitates integration of global capital markets. The company can use the
ADR route either to get international listing or to raise money in international capital
market.
(iii) Calculation of Debt Service Coverage Ratio (DSCR) and its Significance
The debt service coverage ratio can be calculated as under:
Earnings available for debt service
Debt Service Coverage Ratio
Interest Installments
EBITDA
Or, Debt Service Coverage Ratio =
Principal Repayment Due
Interest
1 Tc
Debt service coverage ratio indicates the capacity of a firm to service a particular level of
debt i.e. repayment of principal and interest. High credit rating firms target DSCR to be
greater than 2 in its entire loan life. High DSCR facilitates the firm to borrow at the most
competitive rates.
(iv) Conflict in Profit versus Wealth Maximization Objective
Profit maximisation is a short–term objective and cannot be the sole objective of a
company. It is at best a limited objective. If profit is given undue importance, a number of
problems can arise like the term profit is vague, profit maximisation has to be attempted
with a realisation of risks involved, it does not take into account the time pattern of
returns and as an objective it is too narrow.
Whereas, on the other hand, wealth maximisation, is a long-term objective and means
that the company is using its resources in a good manner. If the share value is to stay
high, the company has to reduce its costs and use the resources properly. If the
company follows the goal of wealth maximisation, it means that the company will promote
only those policies that will lead to an efficient allocation of resources.
(v) Concept of Debt-Equity or EBIT-EPS Indifference Point while Determining the
Capital Structure of a Company
The determination of optimum level of debt in the capital structure of a company is a
formidable task and is a major policy decision. It ensures that the firm is able to service
its debt as well as contain its interest cost. Determination of optimum level of debt
involves equalizing between return and risk.
EBIT – EPS analysis is a widely used tool to determine level of debt in a firm. Through
this analysis, a comparison can be drawn for various methods of financing by obtaining
indifference point. It is a point to the EBIT level at which EPS remains unchanged
15
16. PROFESSIONAL COMPETENCE EXAMINATION : JUNE, 2009
irrespective of debt-equity mix. The indifference point for the capital mix (equity share
capital and debt) can be determined as follows:
(EBIT I1 ) (1 T ) (EBIT I2 )(1 T )
=
E1 E2
(vi) Benefits to the Originator of Debt Securitization
The benefits to the originator of debt securitization are as follows:
(a) The assets are shifted off the balance sheet, thus giving the originator recourse to
off balance sheet funding.
(b) It converts illiquid assets to liquid portfolio.
(c) It facilitates better balance sheet management as assets are transferred off
balance sheet facilitating satisfaction of capital adequacy norms.
(d) The originator's credit rating enhances.
Question 6
Balance Sheets of RST Limited as on March 31, 2008 and March 31, 2009 are as under:
Liabilities 31.3.2008 31.3.2009 Assets 31.3.2008 31.3.2009
Rs. Rs. Rs. Rs.
Equity Share Land &
Capital (Rs. Building 6,00,000 7,00,000
10 face value
10,00,000 12,00,000
per share)
General 3,50,000 2,00,000 Plant & 9,00,000 11,00,000
Reserve Machinery
9% Investments 2,50,000 2,50,000
Preference 3,00,000 5,00,000 (Long-term)
Share Capital
Share 25,000 4,000 Stock 3,60,000 3,50,000
Premium A/c
Profit & Loss 2,00,000 3,00,000 Debtors 3,00,000 3,90,000
A/c
8% 3,00,000 1,00,000 Cash & Bank 1,00,000 95,000
Debentures
16
17. PAPER – 4 : COST ACCOUNTING AND FINANCIAL MANAGEMENT
Creditors 2,05,000 3,00,000 Prepaid 15,000 20,000
Expenses
Bills Payable 45,000 81,000 Advance Tax 80,000 1,05,000
Payment
Provision for 70,000 1,00,000 Preliminary 40,000 35,000
Tax Expenses
Proposed
Dividend 1,50,000 2,60,000 __________ _________
26,45,000 30,45,000 26,45,000 30,45,000
Additional information:
(i) Depreciation charged on building and plant and machinery during the year 2008-09 were
Rs. 50,000 and Rs. 1,20,000 respectively.
(ii) During the year an old machine costing Rs. 1,50,000 was sold for Rs. 32,000. Its written
down value was Rs. 40,000 on date of sale.
(iii) During the year, income tax for the year 2007-08 was assessed at Rs. 76,000. A cheque
of Rs. 4,000 was received along with the assessment order towards refund of income tax
paid in excess, by way of advance tax in earlier years.
(iv) Proposed dividend for 2007-08 was paid during the year 2008-09.
(v) 9% Preference shares of Rs. 3,00,000, which were due for redemption, were redeemed
during the year 2008-09 at a premium of 5%, out of the proceeds of fresh issue of 9%
Preference shares.
(vi) Bonus shares were issued to the existing equity shareholders at the rate of one share for
every five shares held on 31.3.2008 out of general reserves.
(vii) Debentures were redeemed at the beginning of the year at a premium of 3%.
(viii) Interim dividend paid during the year 2008-09 was Rs. 50,000.
Required:
(a) Schedule of Changes in Working Capital; and
(b) Fund Flow Statement for the year ended March 31, 2009. (5 + 10 = 15 Marks)
17
18. PROFESSIONAL COMPETENCE EXAMINATION : JUNE, 2009
Answer
(a) Schedule of Changes in Working Capital
Particulars 31.3.08 31.3.09 Effect on Working
Capital
Increase Decrease
Rs. Rs. Rs. Rs.
Current Assets:
Stock 3,60,000 3,50,000 - 10,000
Debtors 3,00,000 3,90,000 90,000 -
Cash and Bank 1,00,000 95,000 - 5,000
Prepaid Expenses 15,000 20,000 5,000 -
Total (A) 7,75,000 8,55,000
Current Liabilities:
Creditors 2,05,000 3,00,000 - 95,000
Bills Payable 45,000 81,000 - 36,000
Total (B) 2,50,000 3,81,000
Net Working Capital (A-B) 5,25,000 4,74,000 -
Net Decrease in Working Capital - 51,000 51,000 -
5,25,000 5,25,000 1,46,000 1,46,000
(b) Funds Flow Statement for the year ended 31 st March, 2009
Sources of Fund Rs.
Funds from Operation 7,49,000
Issue of 9% Preference Shares 5,00,000
Sales of Plant & Machinery 32,000
Refund of Income Tax 4,000
Financial Resources Provided (A) 12,85,000
Applications of Fund Rs.
Purchase of Land and Building 1,50,000
Purchase of Plant and Machinery 3,60,000
18
19. PAPER – 4 : COST ACCOUNTING AND FINANCIAL MANAGEMENT
Redemption of Debentures 2,06,000
Redemption of Preference Shares 3,15,000
Payment of Tax 1,05,000
Payment of Interim Dividend 50,000
Payment of Dividend (2007-08) 1,50,000
Financial Resources Applied (B) 13,36,000
Net Decrease in Working Capital (A - B) 51,000
Working Notes:
Estimation of Funds from Operation Rs.
Profit and Loss A/c Balance on 31.3.2009 3,00,000
Add: Depreciation on Land and Building 50,000
Depreciation on Plant and Machinery 1,20,000
Loss on Sale of Plant and Machinery 8,000
( 40,000 – 32,000)
Preliminary Expenses written off 5,000
(40,000 – 35,000)
Transfer to General Reserve 50,000
Proposed Dividend 2,60,000
Provision for Taxation 1,06,000
Interim Dividend paid 50,000
6,49,000
9,49,000
Less: Profit and Loss A/c balance on 31.3.08 2,00,000
Funds from Operation 7,49,000
Plant & Machinery A/c
Rs. Rs.
To Balance b/d 9,00,000 By Depreciation 1,20,000
To Bank (Purchase 3,60,000 By Bank (Sale) 32,000
(Bal. Fig.) By P/L A/c (Loss on Sale) 8,000
_______ By Balance c/d 11,00,000
12,60,000 12,60,000
19
20. PROFESSIONAL COMPETENCE EXAMINATION : JUNE, 2009
Provision for Taxation A/c
Rs. Rs.
To Advance tax 76,000 By Balance b/d 70,000
payment A/c
To Balance c/d 1,00,000 By P/L A/c (additional 6,000
provision for 2007-08)
By P/L A/c (Provision for
_______ 08-09) 1,00,000
1,76,000 1,76,000
Advance Tax Payment A/c
Rs. Rs.
To Balance b/d 80,000 By Provision for taxation A/c 76,000
To Bank (paid for 08-09) 1,05,000 By Bank (Refund of tax) 4,000
_______ By Balance c/d 1,05,000
1,85000 1,85,000
8% Debentures A/c
Rs. Rs.
To Bank ( 2,00,000 x 2,06,000 By Balance b/d 3,00,000
103%) (redemption)
To Balance c/d 1,00,000 By Premium on redemption
of Debentures A/c 6,000
3,06,000 3,06,000
9% Preference Share Capital A/c
Rs. Rs.
To Bank A/c ( 3,00,000 x 3,15,000 By Balance b/d 3,00,000
105%) (redemption)
To Balance c/d 5,00,000 By Premium on 15,000
redemption of Preference
shares A/c
_______ By Bank (Issue) 5,00,000
8,15,000 8,15,000
20
21. PAPER – 4 : COST ACCOUNTING AND FINANCIAL MANAGEMENT
Securities Premium A/c
Rs. Rs.
To Premium on 6,000 By Balance b/d 25,000
redemption of debentures
A/c
To Premium on
redemption of preference
15,000
shares A/c
To Balance c/d 4,000 _____
25,000 25,000
General Reserve A/c
Rs. Rs.
To Bonus to 2,00,000 By Balance b/d 3,50,000
Shareholders A/c
To Balance c/d 2,00,000 By P/L A/c (transfer) b/f 50,000
4,00,000 4,00,000
Land and Building A/c
Rs. Rs.
To Balance b/d 6,00,000 By Depreciation 50,000
To Bank (Purchase) (Bal. Fig.) 1,50,000 By Balance c/d 7,00,000
7,50,000 7,50,000
Question 7
(a) The capital structure of MNP Ltd. is as under:
9% Debenture Rs. 2,75,000
11% Preference shares Rs. 2,25,000
Equity shares (face value : Rs. 10 per share) Rs. 5,00,000
Rs. 10,00,000
Additional information:
(i) Rs. 100 per debenture redeemable at par has 2% floatation cost and 10 years of
maturity. The market price per debenture is Rs. 105.
21
22. PROFESSIONAL COMPETENCE EXAMINATION : JUNE, 2009
(ii) Rs. 100 per preference share redeemable at par has 3% floatation cost and 10
years of maturity. The market price per preference share is Rs. 106.
(iii) Equity share has Rs. 4 floatation cost and market price per share of Rs. 24. The
next year expected dividend is Rs. 2 per share with annual growth of 5%. The firm
has a practice of paying all earnings in the form of dividends.
(iv) Corporate Income-tax rate is 35%.
Required :
Calculate Weighted Average Cost of Capital (WACC) using market value weights.
(b) A company is required to choose between two machines A and B. The two machines are
designed differently, but have identical capacity and do exactly the same job. Machine A
costs Rs. 6,00,000 and will last for 3 years. It costs Rs. 1,20,000 per year to run.
Machine B is an ‘economy’ model costing Rs. 4,00,000 but will last only for two years,
and costs Rs. 1,80,000 per year to run. These are real cash flows. The costs are
forecasted in rupees of constant purchasing power. Opportunity cost of capital is 10%.
Which machine company should buy? Ignore tax.
PVIF0.10, 1 = 0.9091, PVIF0. 10, 2 = 0.8264, PVIF 0. 10, 3 = 0.7513. (9 + 7 = 16 Marks)
Answer
(a) Computation of Weighted Average Cost of Capital using Market Value Weights
Cost of Equity (k e)
D1
Ke = +g
Po
Rs. 2
= + 5%
Rs. 24 Rs. 4
= 15%
Cost of Debt (kd)
I (1 T ) (RV NP) / N
Kd =
(RV NP) / 2
9(1 0.35) (100 98) / 10
=
(100 98) / 2
5.85 0.20
= = 6.11%
99
22
23. PAPER – 4 : COST ACCOUNTING AND FINANCIAL MANAGEMENT
Cost of Preference Shares (k p)
PD (RV NP) / N
Kp =
(RV NP) / 2
11 (100 97) / 10
=
(100 97) / 2
11.30
= = 11.47%
98.5
Calculation of WACC using Market Value Weights
Source of Capital Market Weights to Specific Total Cost
Value (Rs.) Total Capital Cost
Debentures (Rs. 105 per 2,88,750 0.1672 0.0611 0.0102
debenture)
Preference Shares (Rs. 106 per 2,38,500 0.1381 0.1147 0.0158
preference share)
Equity Shares (Rs. 24 per share) 12,00,000 0.6947 0.1500 0.1042
17,27,250 1.00 0.1302
WACC using market value weights = 13.02%
(b) Advise to the Management Regarding Buying of Machines
Statement Showing Evaluation of Two Machines
Machines A B
Purchase cost (Rs.): (i) 6,00,000 4,00,000
Life of machines (years) 3 2
Running cost of machine per year (Rs.): (ii) 1,20,000 1,80,000
Cumulative present value factor for 1-3 years @ 10%: (iii) 2.4868 -
Cumulative present value factor for 1-2 years @ 10%: (iv) - 1.7355
Present value of running cost of machines (Rs.): (v) 2,98,416 3,12,390
[(ii) (iii)] [(ii) (iv)]
Cash outflow of machines (Rs.): (vi)=(i) +(v) 8,98,416 7,12,390
Equivalent present value of annual cash outflow 3,61,273.93 4,10,481.13
[(vi)÷(iii)] [(vi) ÷(iv)]
23
24. PROFESSIONAL COMPETENCE EXAMINATION : JUNE, 2009
Recommendation: The Company should buy Machine A since its equivalent cash
outflow is less than Machine B.
Question 8
Answer any three of the following:
(i) A firm maintains a separate account for cash disbursement. Total disbursements are Rs.
2,62,500 per month. Administrative and transaction cost of transferring cash to
disbursement account is Rs. 25 per transfer. Marketable securities yield is 7.5% per
annum.
Determine the optimum cash balance according to William J Baumol model.
(ii) A firm has a total sales of Rs. 12,00,000 and its average collection period is 90 days. The
past experience indicates that bad debt losses are 1.5% on sales. The expenditure
incurred by the firm in administering receivable collection efforts are Rs. 50,000. A factor
is prepared to buy the firm’s receivables by charging 2% commission. The factor will pay
advance on receivables to the firm at an interest rate of 16% p.a. after withholding 10%
as reserve. Calculate effective cost of factoring to the firm. Assume 360 days in a year.
(iii) Explain the concept of discounted payback period.
(iv) Discuss the composition of Return on Equity (ROE) using the DuPont model.
(3 x 3 = 9 Marks)
Answer
(i) Determination of Optimal Cash Balance according to William J. Baumol Model
The formula for determining optimum cash balance is:
2U P
C
S
2 2,62,500 12 25
C =
0.075
15,75,00,000
=
0.075
= 2,10,00,00,000
Optimum Cash Balance, C, = Rs. 45,826
24
25. PAPER – 4 : COST ACCOUNTING AND FINANCIAL MANAGEMENT
(ii) Computation of Effective Cost of Factoring
Average level of Receivables = 12,00,000 90/360 3,00,000
Factoring Commission = 3,00,000 2/100 6,000
Factoring Reserve = 3,00,000 10/100 30,000
Amount Available for Advance = Rs. 3,00,000-(6,000+30,000) 2,64,000
Factor will deduct his interest @ 16% :-
Rs. 2,64,000 16 90
Interest = Rs. 10,560
360 100
Advance to be paid = Rs. 2,64,000 – Rs. 10,560 = Rs. 2,53,440
Annual Cost of Factoring to the Firm: Rs.
Factoring Commission (Rs. 6,000 360/90) 24,000
Interest Charges (Rs. 10,560 360/90) 42,240
Total 66,240
Firm’s Savings on taking Factoring Service: Rs.
Cost of Administration Saved 50,000
Cost of Bad Debts (Rs. 12,00,000 x 1.5/100) avoided 18,000
Total 68,000
Net Benefit to the Firm (Rs. 68,000 – Rs. 66,240) 1,760
Rs. 66,240 100 26.136%
Effective Cost of Factoring =
2,53,440
Effective Cost of Factoring = 26.136%
(iii) Concept of Discounted Payback Period
Payback period is time taken to recover the original investment from project cash flows. It
is also termed as break even period. The focus of the analysis is on liquidity aspect and it
suffers from the limitation of ignoring time value of money and profitability. Discounted
payback period considers present value of cash flows, discounted at company’s cost of
25
26. PROFESSIONAL COMPETENCE EXAMINATION : JUNE, 2009
capital to estimate breakeven period i.e. it is that period in which future discounted
cashflows equal the initial outflow. The shorter the period, better it is. It also ignores post
discounted payback period cash flows.
(iv) Composition of Return on Equity using the DuPont Model
There are three components in the calculation of return on equity using the traditional
DuPont model- the net profit margin, asset turnover, and the equity multiplier. By
examining each input individually, the sources of a company's return on equity can be
discovered and compared to its competitors.
(a) Net Profit Margin: The net profit margin is simply the after-tax profit a company
generates for each rupee of revenue.
Net profit margin = Net Income ÷ Revenue
Net profit margin is a safety cushion; the lower the margin, lesser the room for error.
(b) Asset Turnover: The asset turnover ratio is a measure of how effectively a company
converts its assets into sales. It is calculated as follows:
Asset Turnover = Revenue ÷ Assets
The asset turnover ratio tends to be inversely related to the net profit margin; i.e.,
the higher the net profit margin, the lower the asset turnover.
(c) Equity Multiplier: It is possible for a company with terrible sales and margins to take
on excessive debt and artificially increase its return on equity. The equity multiplier,
a measure of financial leverage, allows the investor to see what portion of the return
on equity is the result of debt. The equity multiplier is calculated as follows:
Equity Multiplier = Assets ÷ Shareholders’ Equity.
Calculation of Return on Equity
To calculate the return on equity using the DuPont model, simply multiply the three
components (net profit margin, asset turnover, and equity multiplier.)
Return on Equity = Net profit margin× Asset turnover × Equity multiplier
26