Confidence Intervals Using Z Scores
•Als XLSX, PDF herunterladen•
15 gefällt mir•48,131 views

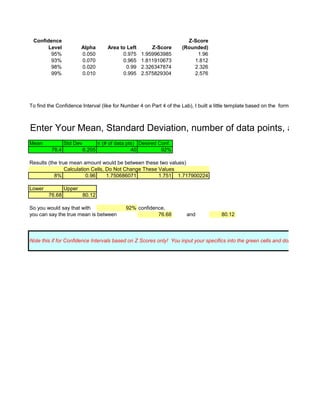
Note this is for Confidence Intervals based on Z Scores only! You input your specifics into the green cells and don't touch anything else. You need to download before using.

Empfohlen
Weitere ähnliche Inhalte
Mehr von Brent Heard
Mehr von Brent Heard (20)
Kürzlich hochgeladen
Kürzlich hochgeladen (20)
Confidence Intervals Using Z Scores
- 1. Confidence Z-Score Level Alpha Area to Left Z-Score (Rounded) 95% 0.050 0.975 1.959963985 1.96 93% 0.070 0.965 1.811910673 1.812 98% 0.020 0.99 2.326347874 2.326 99% 0.010 0.995 2.575829304 2.576 To find the Confidence Interval (like for Number 4 on Part 4 of the Lab), I built a little template based on the formulas they give Enter Your Mean, Standard Deviation, number of data points, and Con Mean Std Dev n (# of data pts) Desired Conf. 78.4 6.205 40 92% Results (the true mean amount would be between these two values) Calculation Cells, Do Not Change These Values 8% 0.96 1.750686071 1.751 1.717900224 Lower Upper 76.68 80.12 So you would say that with 92% confidence, you can say the true mean is between 76.68 and 80.12 Note this if for Confidence Intervals based on Z Scores only! You input your specifics into the green cells and don't touch anyth
- 2. on the formulas they give you for the Z score on Part 3 of the Lab. ONLY ENTER IN THE GREEN CELLS. points, and Confidence Level TO FIND SOMETHING LIKE THE "LOWEST POSSIBLE VALUE" YOU MIGHT CONSIDER FINDING THE 98% OR 99% LOWER LIMIT. WITH the 98% confidence lower limit you would know that 99% of the time the actual would be higher. WITH the 99% confidence lower limit you would know that 99.5% of the time the actual would be higher. cells and don't touch anything else.
- 3. GREEN CELLS. G LIKE THE "LOWEST OU MIGHT CONSIDER R 99% LOWER LIMIT. dence lower limit you would e time the actual would be dence lower limit you would he time the actual would be