SlideShare ist ein Scribd-Unternehmen logo
1 von 40
MOTION
GRAPHICAL REPRESENTATION OF
MOTION
INTRODUCTION:
 Graphs provide us a convenient way to present basic information about
various events.
 For example:
Run rate shown in cricket matches. Used to solve equations in two
variables.
USAGE OF GRAPHS:
 We can use line graphs to describe motion. We can show the dependence of
one physical quantity on other through line graphs.
 For example:
Distance-time graphs Velocity-time graphs
 Uniform velocity and uniform speed are equal when the magnitude of distance
and displacement is equal.
SIMPLE FLOW CHART TO
UNDERSTAND THE TOPIC:
GRAPHICAL REPRESENTATION OF MOTION
DISTANCE-TIME GRAPHS VELOCITY-TIME GRAPHS
CALCULATE SPEED USING
DISTANCE AND TIME
CALCULATE DISTANCE /d /a USING
VELOCITY AND TIME
DISTANCE-TIME GRAPHS:
 In a distance-time graph the distance is represented along the “y-axis” and
time is represented along the “x-axis”.
 Using a distance-time graph the change in the position of an object with
respect to time can be determined.
 A distance-time graph helps us find the speed of the object moving.
 When the object is under going uniform motion(velocity) the graph obtained
will always be a straight line graph, as the distance and time are directly
proportional to each other
 When the object is under going non-uniform motion(velocity) the graph
obtained will not be a straight line graph.
 When we are finding the speed we have to use the concept of slope.
HOW TO DETERMINE THE
SPEED FROM THIS GRAPH:
 To determine speed using the graph we have to:
1. Take two consecutive points and draw perpendiculars to the x & y axis as
shown in the figure.
2. Name the two points ‘A’ & ‘B’.
3. Name the point on the y-axis as S1 and the point on the x-axis asT1 (from
point A).
4. Name the point on the y-axis as S2 and the point on the x-axis as T2 (from
point B).
5. Speed =
𝐷𝑖𝑠𝑡𝑎𝑛𝑐𝑒
𝑇𝑖𝑚𝑒
 Speed =
𝑦−𝑎𝑥𝑖𝑠
𝑥−𝑎𝑥𝑖𝑠
=slope  Slope =
𝑦2
−𝑦1
𝑥2
−𝑥1
 Slope =
𝑠2
−𝑠1
𝑡2
−𝑡1
HOW TO SOLVE:
1. Here s1=30km, s2= 40km; t1=60mins,t2=80mins.
2. So, according to the formula- Slope =
𝑠2
−𝑠1
𝑡2
−𝑡1
Slope =
𝑦2
−𝑦1
𝑥2
−𝑥1
 Slope =
𝑠2
−𝑠1
𝑡2
−𝑡1
=
40−30
80−60
=
10
20
=
1
2
=0.5x60
Therefore, according to this diagram the vehicle is moving with a speed of 30
km/hr.
NON-UNIFORM SPEED(VELOCITY)
 The nature of this graph shows nonlinear variation of the distance travelled
by the car with time. Thus, the graph shown in represents motion with non-
uniform speed.
VELOCITY-TIME GRAPH:
 In a velocity-time graph the velocity is represented along the “y-axis” and the
time is represented along the “x-axis”.
 Whenever we fix a velocity on the y-axis its always a straight line parallel line
to the x-axis.
 The velocity is always independent of time i.e. in whichever time we try to find
the velocity the velocity remains the same.
 When the object has an uniform or constant velocity the graph obtained will
always be a straight line graph.
 Whenever the object does not have an uniform velocity the graph obtained
will be a curved line graph.
 When we have to find the distance we cannot use the concept of slope as
slope uses the concept of division but [D=SxT].
 When we are finding the distance we have to find the area under the graph.
HOW TO DETERMINE DISTANCE
FROM THIS GRAPH:
 To determine distance from this graph we have to:
1. (If the velocity is a constant) draw a straight line parallel to the x-axis.
2. Then take two consecutive points and name them ‘A’ & ‘B’.
3. Then draw two perpendicular lines from point ‘A’ & ‘B’ and name them ‘C’ & ‘D’.
4. Mark the two points ‘C’ & ‘D’ as T1 & T2 respectively.
5. We have to find the area of the rectangle ABDC=lxb.
HOW TO SOLVE:
1. LxB = ACxCD
2. Here the distance=ACxCD.
3. Where AC=40m/s,CD=6secs.
4. Therefore, ACxCD=40x6=240m.
5. Which implies that according to this diagram the moving vehicle has covered a
distance of 240m.
HOW TO DETERMINE DISTANCE
USING THIS GRAPH:
 Scale y-axis=10m/s for 1 unit; x-axis=2secs for 1 unit.
 In this figure we can calculate the distance in two ways
1. Area of trapezium ABDE or
2. Area of triangle ABC+Area of rectangle ACDE.
HOW TO SOLVE:
 Using area of trapezium:
1. Area of trapezium=
(𝑆𝑢𝑚 𝑜𝑓 𝑝𝑎𝑟𝑎𝑙𝑙𝑒𝑙 𝑠𝑖𝑑𝑒𝑠) 𝑋 ℎ𝑒𝑖𝑔ℎ𝑡
2
2. So, in the above figure: AEllBD and AC=height.
3. Therefore,
(𝐴𝐸+𝐵𝐷)𝑋𝐴𝐶
2
=
(25+55)𝑋8
2
=
640
2
= 320 km
4. Thus, the vehicle in this case has travelled a distance of 320 km.
HOW TO SOLVE:
 Using area of triangle+area of rectangle=1/2xbxh+lxb
 Area of triangle-
1.
1
2
xbxh =
1
2
xACxBC
2.
1
2
x30x8 pn: Change in colour represents cancellation.
3. 30x4=120 km
 Area of rectangle-
1. lxb=25x8
2. 25x8=200 km
 Therefore the total distance=120+200=320 km.
HOW TO DETERMINE DISTANCE
USING THIS GRAPH:
 In this case to find the distance we have to find the area under the graph
which is the area of the triangle.
 Area of triangle=
 Here we can take a point anywhere on the graph and we have to find the are
between the origin and the point taken.
 We have taken the point as ’A’ on the perpendiculars of 8 and 2. The origin is
‘O’ on zero and the other point on two as ‘C’.
 So we have to find the area of the triangle AOC.
 The difference between the previous graph and this graph is just the marking
of points, in the 1st one it’s any 2 points on the graph whereas here in the 2nd
one it only one point on the graph and your other point is nothing but the
origin.
1
2
xbxh
HOW TO SOLVE:
1. Area of triangle=
1
2
xbxh
2.
1
2
xbxh=
1
2
x2x8
3. Therefore, the area of the triangle AOC=8m2
4. Thus, the vehicle has travelled a distance of 8m.
VELOCITY-TIME GRAPHS OF AN OBJECT
IN NON-UNIFORMLY ACCELERATED
MOTION:
 (a) shows a velocity-time graph that represents the motion of an object whose
velocity is decreasing with time while (b) shows the velocity-time graph
representing the non-uniform variation of velocity of the object with time.
TYPES OF DISTANCE-TIME GRAPHS:
 If the graph obtained is a
straight line, then the object is
said to moving in increasing
uniform motion
 If the graph obtained is a
straight line parallel to the
time axis, then object is in
rest.
If the graph obtained is a
straight line as shown, then
the object is said to moving in
uniform motion and is moving
towards the initial position
 If the graph obtained is a curved
line as shown, then the object is
said to be in increasing non uniform
motion
 If the graph obtained is a curved
line as shown, then the object is
said to be in decreasing non
uniform motion
TYPES OF VELOCITY TIME GRAPHS:
 If the graph obtained is a
straight line parallel to the
time axis, then the object is
said to be with uniform
velocity. Therefore the
object is having zero
acceleration
 If the graph obtained is a
straight line as shown, then the
body is said to have uniform
acceleration.
RETARDATION: NEGATIVE
ACCELERATION:
 If the graph is a straight
line as shown, then the
object is said to be moving
with uniform retardation
 If the graph is a curved
line as shown, then the
object is said to be
moving with non uniform
acceleration
.
If the graph is a curved
line as shown, then the
object is said to be
moving with non uniform
retardation
VELOCITY TIME GRAPH
 In this graph, the object
accelerates in AB, moves with
constant velocity and zero
acceleration till BC and retardation
occurs till CD
DISTANCE TIME GRAPH
 In this graph, the object covers
distance in uniform speed in AB,
stays in rest in BC and then comes
back to the initial position.
CLUES FOR V-T GRAPHS:
SHORT SUMMARY OF THE TOPIC:
 When an object covers equal distance in equal intervals of time – Uniform
velocity.
 When an object covers unequal distances in equal intervals of time – Non-
uniform velocity.
 From the distance-time graph the speed is given by the slope of the line.
 From the velocity-time graph the distance is found by the area under the
graph or the area enclosed by the figure.
NUMERICALS:
1. Find the speed of the vehicle between
A and B.
Sol: Speed=Slope=S2-S1/ T2-T1
=4-3/6-4
=1/2
=0.5m/s
A
B
NUMERICALS:
1. Find the area of the shaded region.
Sol: Area of trapezium=(Sum of ll sides) x height/2
=(20+50)x3/2
=(70)x3/2
=210/2
=105m
NUMERICALS:
1. Find the distance covered by finding the shaded region.
Sol: Area of rectangle=lxb
=l=30,b=6
=lxb=30x6
=180m
NUMERICALS:
1. Find the area of the shaded region to find the distance.
Sol: Area of the shaded region=Area of a triangle
=1/2xbxh
=1/2x4x40
=1x2x40
=80m
NUMERICALS:
1. Find the speed of the car between the perpendicular of
(10,1) and (50,5).
Sol: Slope=Speed=S2-S1/T2-T1
=50-10/5-1
=40/4
=10 m/s
MCQ’S:
1. Distance-time graph of two objects A and B are shown below. Which
statement is true for the speed of object A and B?
a) Speed of object A is greater than object B
b) Speed of object A is lesser than object B
c) Both have same speed
d) Speed of Object A is double the speed of object B.
MCQ’S
1. In a distance-time graph, if the line is horizontal, then the object is:
a) Accelerating
b) Speeding up
c) At rest
d) Slowing down
MCQ’S
1. On the distance-time graph, the Y-axis should be labelled as:
a) Distance
b) Displacement
c) Speed
d) Time
MCQ’S
1. The velocity-time graph of an object moving in a fixed direction is shown in
the figure below. What do you conclude about the object?
a) Moves with a constant speed.
b) Moves with varying speeds.
c) Moves with a non zero acceleration.
d) Is at rest.
MCQ’S
1. The slope of the distance-time graph is:
a) Distance
b) Acceleration
c) Speed
d) Displacement
MCQ’S
1. The area enclosed by velocity-time graph and the time axis will be equal to the
magnitude of:
a) Velocity
b) Speed
c) Acceleration
d) Distance
MCQ’S
1. For a constant acceleration, the nature of velocity-time graph is:
a) Graph-B
b) Graph-D
c) Graph-C
d) Graph-A
MCQ’S
1. Area under a v – t graph represents a physical quantity which has the unit:
a) m2
b) m/s
c) m/s2
d) m
MCQ’S
1. The acceleration of an object moving in a straight line can be determined
from:
a) The area between the distance-time graph and time axis.
b) The area between the velocity-time graph and time axis
c) The slope of the velocity-time graph.
d) The slope of the distance-time graph.
MCQ’S
1. This is a velocity-time graph when the body is under:
a) Non-uniform retardation.
b) Uniform acceleration.
c) Uniform retardation.
d) Non-uniform acceleration.
DONE BY: DIVYA & SHRIMAYI

Weitere ähnliche Inhalte

Ähnlich wie GRAPHICAL REPRESENTATION OF MOTION💖.pptx

Speed+velocity+acceleration
Speed+velocity+accelerationSpeed+velocity+acceleration
Speed+velocity+acceleration
jacquibridges
 
11. notes on speed graphs
11. notes on speed graphs11. notes on speed graphs
11. notes on speed graphs
mdogoldogol
 

Ähnlich wie GRAPHICAL REPRESENTATION OF MOTION💖.pptx (20)

Vectors.pdf
Vectors.pdfVectors.pdf
Vectors.pdf
 
Ch02 ssm
Ch02 ssmCh02 ssm
Ch02 ssm
 
Speed+velocity+acceleration
Speed+velocity+accelerationSpeed+velocity+acceleration
Speed+velocity+acceleration
 
Movimiento en dos y tres dimensiones
Movimiento en dos y tres dimensionesMovimiento en dos y tres dimensiones
Movimiento en dos y tres dimensiones
 
IX-8-Motion.ppt
IX-8-Motion.pptIX-8-Motion.ppt
IX-8-Motion.ppt
 
presentation_equation_of_motion_1663608809_139366.pptx
presentation_equation_of_motion_1663608809_139366.pptxpresentation_equation_of_motion_1663608809_139366.pptx
presentation_equation_of_motion_1663608809_139366.pptx
 
presentation_equation_of_motion_1663608809_139366.pptx
presentation_equation_of_motion_1663608809_139366.pptxpresentation_equation_of_motion_1663608809_139366.pptx
presentation_equation_of_motion_1663608809_139366.pptx
 
presentation_equation_of_motion_1663608809_139366.pptx
presentation_equation_of_motion_1663608809_139366.pptxpresentation_equation_of_motion_1663608809_139366.pptx
presentation_equation_of_motion_1663608809_139366.pptx
 
11. notes on speed graphs
11. notes on speed graphs11. notes on speed graphs
11. notes on speed graphs
 
Chapter 2 Motion in a straight line
Chapter 2 Motion in a straight lineChapter 2 Motion in a straight line
Chapter 2 Motion in a straight line
 
Chapter 8 motion
Chapter 8 motionChapter 8 motion
Chapter 8 motion
 
8motion
8motion8motion
8motion
 
PHYSICS KSSM FORM 4 (2.2 motion graphs)
PHYSICS KSSM FORM 4 (2.2 motion graphs)PHYSICS KSSM FORM 4 (2.2 motion graphs)
PHYSICS KSSM FORM 4 (2.2 motion graphs)
 
Kinematics of Linear Motion​
Kinematics of Linear Motion​Kinematics of Linear Motion​
Kinematics of Linear Motion​
 
CH-3Motion in a St Line.pdf
CH-3Motion in a St Line.pdfCH-3Motion in a St Line.pdf
CH-3Motion in a St Line.pdf
 
Motion
MotionMotion
Motion
 
Kinematics lesson3 sb
Kinematics lesson3 sbKinematics lesson3 sb
Kinematics lesson3 sb
 
Kinematics of mass point
Kinematics of mass pointKinematics of mass point
Kinematics of mass point
 
Ch03 ssm
Ch03 ssmCh03 ssm
Ch03 ssm
 
motion
motionmotion
motion
 

KĂźrzlich hochgeladen

1029-Danh muc Sach Giao Khoa khoi 6.pdf
1029-Danh muc Sach Giao Khoa khoi  6.pdf1029-Danh muc Sach Giao Khoa khoi  6.pdf
1029-Danh muc Sach Giao Khoa khoi 6.pdf
QucHHunhnh
 
Seal of Good Local Governance (SGLG) 2024Final.pptx
Seal of Good Local Governance (SGLG) 2024Final.pptxSeal of Good Local Governance (SGLG) 2024Final.pptx
Seal of Good Local Governance (SGLG) 2024Final.pptx
negromaestrong
 

KĂźrzlich hochgeladen (20)

Explore beautiful and ugly buildings. Mathematics helps us create beautiful d...
Explore beautiful and ugly buildings. Mathematics helps us create beautiful d...Explore beautiful and ugly buildings. Mathematics helps us create beautiful d...
Explore beautiful and ugly buildings. Mathematics helps us create beautiful d...
 
On National Teacher Day, meet the 2024-25 Kenan Fellows
On National Teacher Day, meet the 2024-25 Kenan FellowsOn National Teacher Day, meet the 2024-25 Kenan Fellows
On National Teacher Day, meet the 2024-25 Kenan Fellows
 
Micro-Scholarship, What it is, How can it help me.pdf
Micro-Scholarship, What it is, How can it help me.pdfMicro-Scholarship, What it is, How can it help me.pdf
Micro-Scholarship, What it is, How can it help me.pdf
 
ComPTIA Overview | Comptia Security+ Book SY0-701
ComPTIA Overview | Comptia Security+ Book SY0-701ComPTIA Overview | Comptia Security+ Book SY0-701
ComPTIA Overview | Comptia Security+ Book SY0-701
 
1029-Danh muc Sach Giao Khoa khoi 6.pdf
1029-Danh muc Sach Giao Khoa khoi  6.pdf1029-Danh muc Sach Giao Khoa khoi  6.pdf
1029-Danh muc Sach Giao Khoa khoi 6.pdf
 
Asian American Pacific Islander Month DDSD 2024.pptx
Asian American Pacific Islander Month DDSD 2024.pptxAsian American Pacific Islander Month DDSD 2024.pptx
Asian American Pacific Islander Month DDSD 2024.pptx
 
Food Chain and Food Web (Ecosystem) EVS, B. Pharmacy 1st Year, Sem-II
Food Chain and Food Web (Ecosystem) EVS, B. Pharmacy 1st Year, Sem-IIFood Chain and Food Web (Ecosystem) EVS, B. Pharmacy 1st Year, Sem-II
Food Chain and Food Web (Ecosystem) EVS, B. Pharmacy 1st Year, Sem-II
 
Python Notes for mca i year students osmania university.docx
Python Notes for mca i year students osmania university.docxPython Notes for mca i year students osmania university.docx
Python Notes for mca i year students osmania university.docx
 
Measures of Central Tendency: Mean, Median and Mode
Measures of Central Tendency: Mean, Median and ModeMeasures of Central Tendency: Mean, Median and Mode
Measures of Central Tendency: Mean, Median and Mode
 
Measures of Dispersion and Variability: Range, QD, AD and SD
Measures of Dispersion and Variability: Range, QD, AD and SDMeasures of Dispersion and Variability: Range, QD, AD and SD
Measures of Dispersion and Variability: Range, QD, AD and SD
 
Class 11th Physics NEET formula sheet pdf
Class 11th Physics NEET formula sheet pdfClass 11th Physics NEET formula sheet pdf
Class 11th Physics NEET formula sheet pdf
 
Application orientated numerical on hev.ppt
Application orientated numerical on hev.pptApplication orientated numerical on hev.ppt
Application orientated numerical on hev.ppt
 
Web & Social Media Analytics Previous Year Question Paper.pdf
Web & Social Media Analytics Previous Year Question Paper.pdfWeb & Social Media Analytics Previous Year Question Paper.pdf
Web & Social Media Analytics Previous Year Question Paper.pdf
 
Mixin Classes in Odoo 17 How to Extend Models Using Mixin Classes
Mixin Classes in Odoo 17  How to Extend Models Using Mixin ClassesMixin Classes in Odoo 17  How to Extend Models Using Mixin Classes
Mixin Classes in Odoo 17 How to Extend Models Using Mixin Classes
 
General Principles of Intellectual Property: Concepts of Intellectual Proper...
General Principles of Intellectual Property: Concepts of Intellectual  Proper...General Principles of Intellectual Property: Concepts of Intellectual  Proper...
General Principles of Intellectual Property: Concepts of Intellectual Proper...
 
Unit-IV; Professional Sales Representative (PSR).pptx
Unit-IV; Professional Sales Representative (PSR).pptxUnit-IV; Professional Sales Representative (PSR).pptx
Unit-IV; Professional Sales Representative (PSR).pptx
 
Holdier Curriculum Vitae (April 2024).pdf
Holdier Curriculum Vitae (April 2024).pdfHoldier Curriculum Vitae (April 2024).pdf
Holdier Curriculum Vitae (April 2024).pdf
 
Energy Resources. ( B. Pharmacy, 1st Year, Sem-II) Natural Resources
Energy Resources. ( B. Pharmacy, 1st Year, Sem-II) Natural ResourcesEnergy Resources. ( B. Pharmacy, 1st Year, Sem-II) Natural Resources
Energy Resources. ( B. Pharmacy, 1st Year, Sem-II) Natural Resources
 
Seal of Good Local Governance (SGLG) 2024Final.pptx
Seal of Good Local Governance (SGLG) 2024Final.pptxSeal of Good Local Governance (SGLG) 2024Final.pptx
Seal of Good Local Governance (SGLG) 2024Final.pptx
 
psychiatric nursing HISTORY COLLECTION .docx
psychiatric  nursing HISTORY  COLLECTION  .docxpsychiatric  nursing HISTORY  COLLECTION  .docx
psychiatric nursing HISTORY COLLECTION .docx
 

GRAPHICAL REPRESENTATION OF MOTION💖.pptx

  • 2. INTRODUCTION:  Graphs provide us a convenient way to present basic information about various events.  For example: Run rate shown in cricket matches. Used to solve equations in two variables.
  • 3. USAGE OF GRAPHS:  We can use line graphs to describe motion. We can show the dependence of one physical quantity on other through line graphs.  For example: Distance-time graphs Velocity-time graphs  Uniform velocity and uniform speed are equal when the magnitude of distance and displacement is equal.
  • 4. SIMPLE FLOW CHART TO UNDERSTAND THE TOPIC: GRAPHICAL REPRESENTATION OF MOTION DISTANCE-TIME GRAPHS VELOCITY-TIME GRAPHS CALCULATE SPEED USING DISTANCE AND TIME CALCULATE DISTANCE /d /a USING VELOCITY AND TIME
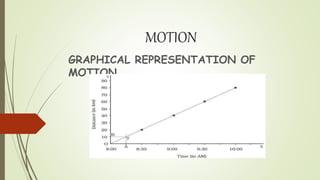
  • 5. DISTANCE-TIME GRAPHS:  In a distance-time graph the distance is represented along the “y-axis” and time is represented along the “x-axis”.  Using a distance-time graph the change in the position of an object with respect to time can be determined.  A distance-time graph helps us find the speed of the object moving.  When the object is under going uniform motion(velocity) the graph obtained will always be a straight line graph, as the distance and time are directly proportional to each other  When the object is under going non-uniform motion(velocity) the graph obtained will not be a straight line graph.  When we are finding the speed we have to use the concept of slope.
  • 6. HOW TO DETERMINE THE SPEED FROM THIS GRAPH:  To determine speed using the graph we have to: 1. Take two consecutive points and draw perpendiculars to the x & y axis as shown in the figure. 2. Name the two points ‘A’ & ‘B’. 3. Name the point on the y-axis as S1 and the point on the x-axis asT1 (from point A). 4. Name the point on the y-axis as S2 and the point on the x-axis as T2 (from point B). 5. Speed = 𝐷𝑖𝑠𝑡𝑎𝑛𝑐𝑒 𝑇𝑖𝑚𝑒  Speed = 𝑦−𝑎𝑥𝑖𝑠 𝑥−𝑎𝑥𝑖𝑠 =slope  Slope = 𝑦2 −𝑦1 𝑥2 −𝑥1  Slope = 𝑠2 −𝑠1 𝑡2 −𝑡1
  • 7. HOW TO SOLVE: 1. Here s1=30km, s2= 40km; t1=60mins,t2=80mins. 2. So, according to the formula- Slope = 𝑠2 −𝑠1 𝑡2 −𝑡1 Slope = 𝑦2 −𝑦1 𝑥2 −𝑥1  Slope = 𝑠2 −𝑠1 𝑡2 −𝑡1 = 40−30 80−60 = 10 20 = 1 2 =0.5x60 Therefore, according to this diagram the vehicle is moving with a speed of 30 km/hr.
  • 8. NON-UNIFORM SPEED(VELOCITY)  The nature of this graph shows nonlinear variation of the distance travelled by the car with time. Thus, the graph shown in represents motion with non- uniform speed.
  • 9. VELOCITY-TIME GRAPH:  In a velocity-time graph the velocity is represented along the “y-axis” and the time is represented along the “x-axis”.  Whenever we fix a velocity on the y-axis its always a straight line parallel line to the x-axis.  The velocity is always independent of time i.e. in whichever time we try to find the velocity the velocity remains the same.  When the object has an uniform or constant velocity the graph obtained will always be a straight line graph.  Whenever the object does not have an uniform velocity the graph obtained will be a curved line graph.  When we have to find the distance we cannot use the concept of slope as slope uses the concept of division but [D=SxT].  When we are finding the distance we have to find the area under the graph.
  • 10. HOW TO DETERMINE DISTANCE FROM THIS GRAPH:  To determine distance from this graph we have to: 1. (If the velocity is a constant) draw a straight line parallel to the x-axis. 2. Then take two consecutive points and name them ‘A’ & ‘B’. 3. Then draw two perpendicular lines from point ‘A’ & ‘B’ and name them ‘C’ & ‘D’. 4. Mark the two points ‘C’ & ‘D’ as T1 & T2 respectively. 5. We have to find the area of the rectangle ABDC=lxb.
  • 11. HOW TO SOLVE: 1. LxB = ACxCD 2. Here the distance=ACxCD. 3. Where AC=40m/s,CD=6secs. 4. Therefore, ACxCD=40x6=240m. 5. Which implies that according to this diagram the moving vehicle has covered a distance of 240m.
  • 12. HOW TO DETERMINE DISTANCE USING THIS GRAPH:  Scale y-axis=10m/s for 1 unit; x-axis=2secs for 1 unit.  In this figure we can calculate the distance in two ways 1. Area of trapezium ABDE or 2. Area of triangle ABC+Area of rectangle ACDE.
  • 13. HOW TO SOLVE:  Using area of trapezium: 1. Area of trapezium= (𝑆𝑢𝑚 𝑜𝑓 𝑝𝑎𝑟𝑎𝑙𝑙𝑒𝑙 𝑠𝑖𝑑𝑒𝑠) 𝑋 ℎ𝑒𝑖𝑔ℎ𝑡 2 2. So, in the above figure: AEllBD and AC=height. 3. Therefore, (𝐴𝐸+𝐵𝐷)𝑋𝐴𝐶 2 = (25+55)𝑋8 2 = 640 2 = 320 km 4. Thus, the vehicle in this case has travelled a distance of 320 km.
  • 14. HOW TO SOLVE:  Using area of triangle+area of rectangle=1/2xbxh+lxb  Area of triangle- 1. 1 2 xbxh = 1 2 xACxBC 2. 1 2 x30x8 pn: Change in colour represents cancellation. 3. 30x4=120 km  Area of rectangle- 1. lxb=25x8 2. 25x8=200 km  Therefore the total distance=120+200=320 km.
  • 15. HOW TO DETERMINE DISTANCE USING THIS GRAPH:  In this case to find the distance we have to find the area under the graph which is the area of the triangle.  Area of triangle=  Here we can take a point anywhere on the graph and we have to find the are between the origin and the point taken.  We have taken the point as ’A’ on the perpendiculars of 8 and 2. The origin is ‘O’ on zero and the other point on two as ‘C’.  So we have to find the area of the triangle AOC.  The difference between the previous graph and this graph is just the marking of points, in the 1st one it’s any 2 points on the graph whereas here in the 2nd one it only one point on the graph and your other point is nothing but the origin. 1 2 xbxh
  • 16. HOW TO SOLVE: 1. Area of triangle= 1 2 xbxh 2. 1 2 xbxh= 1 2 x2x8 3. Therefore, the area of the triangle AOC=8m2 4. Thus, the vehicle has travelled a distance of 8m.
  • 17. VELOCITY-TIME GRAPHS OF AN OBJECT IN NON-UNIFORMLY ACCELERATED MOTION:  (a) shows a velocity-time graph that represents the motion of an object whose velocity is decreasing with time while (b) shows the velocity-time graph representing the non-uniform variation of velocity of the object with time.
  • 18. TYPES OF DISTANCE-TIME GRAPHS:  If the graph obtained is a straight line, then the object is said to moving in increasing uniform motion  If the graph obtained is a straight line parallel to the time axis, then object is in rest. If the graph obtained is a straight line as shown, then the object is said to moving in uniform motion and is moving towards the initial position
  • 19.  If the graph obtained is a curved line as shown, then the object is said to be in increasing non uniform motion  If the graph obtained is a curved line as shown, then the object is said to be in decreasing non uniform motion
  • 20. TYPES OF VELOCITY TIME GRAPHS:  If the graph obtained is a straight line parallel to the time axis, then the object is said to be with uniform velocity. Therefore the object is having zero acceleration  If the graph obtained is a straight line as shown, then the body is said to have uniform acceleration.
  • 21. RETARDATION: NEGATIVE ACCELERATION:  If the graph is a straight line as shown, then the object is said to be moving with uniform retardation  If the graph is a curved line as shown, then the object is said to be moving with non uniform acceleration . If the graph is a curved line as shown, then the object is said to be moving with non uniform retardation
  • 22. VELOCITY TIME GRAPH  In this graph, the object accelerates in AB, moves with constant velocity and zero acceleration till BC and retardation occurs till CD DISTANCE TIME GRAPH  In this graph, the object covers distance in uniform speed in AB, stays in rest in BC and then comes back to the initial position.
  • 23. CLUES FOR V-T GRAPHS:
  • 24. SHORT SUMMARY OF THE TOPIC:  When an object covers equal distance in equal intervals of time – Uniform velocity.  When an object covers unequal distances in equal intervals of time – Non- uniform velocity.  From the distance-time graph the speed is given by the slope of the line.  From the velocity-time graph the distance is found by the area under the graph or the area enclosed by the figure.
  • 25. NUMERICALS: 1. Find the speed of the vehicle between A and B. Sol: Speed=Slope=S2-S1/ T2-T1 =4-3/6-4 =1/2 =0.5m/s A B
  • 26. NUMERICALS: 1. Find the area of the shaded region. Sol: Area of trapezium=(Sum of ll sides) x height/2 =(20+50)x3/2 =(70)x3/2 =210/2 =105m
  • 27. NUMERICALS: 1. Find the distance covered by finding the shaded region. Sol: Area of rectangle=lxb =l=30,b=6 =lxb=30x6 =180m
  • 28. NUMERICALS: 1. Find the area of the shaded region to find the distance. Sol: Area of the shaded region=Area of a triangle =1/2xbxh =1/2x4x40 =1x2x40 =80m
  • 29. NUMERICALS: 1. Find the speed of the car between the perpendicular of (10,1) and (50,5). Sol: Slope=Speed=S2-S1/T2-T1 =50-10/5-1 =40/4 =10 m/s
  • 30. MCQ’S: 1. Distance-time graph of two objects A and B are shown below. Which statement is true for the speed of object A and B? a) Speed of object A is greater than object B b) Speed of object A is lesser than object B c) Both have same speed d) Speed of Object A is double the speed of object B.
  • 31. MCQ’S 1. In a distance-time graph, if the line is horizontal, then the object is: a) Accelerating b) Speeding up c) At rest d) Slowing down
  • 32. MCQ’S 1. On the distance-time graph, the Y-axis should be labelled as: a) Distance b) Displacement c) Speed d) Time
  • 33. MCQ’S 1. The velocity-time graph of an object moving in a fixed direction is shown in the figure below. What do you conclude about the object? a) Moves with a constant speed. b) Moves with varying speeds. c) Moves with a non zero acceleration. d) Is at rest.
  • 34. MCQ’S 1. The slope of the distance-time graph is: a) Distance b) Acceleration c) Speed d) Displacement
  • 35. MCQ’S 1. The area enclosed by velocity-time graph and the time axis will be equal to the magnitude of: a) Velocity b) Speed c) Acceleration d) Distance
  • 36. MCQ’S 1. For a constant acceleration, the nature of velocity-time graph is: a) Graph-B b) Graph-D c) Graph-C d) Graph-A
  • 37. MCQ’S 1. Area under a v – t graph represents a physical quantity which has the unit: a) m2 b) m/s c) m/s2 d) m
  • 38. MCQ’S 1. The acceleration of an object moving in a straight line can be determined from: a) The area between the distance-time graph and time axis. b) The area between the velocity-time graph and time axis c) The slope of the velocity-time graph. d) The slope of the distance-time graph.
  • 39. MCQ’S 1. This is a velocity-time graph when the body is under: a) Non-uniform retardation. b) Uniform acceleration. c) Uniform retardation. d) Non-uniform acceleration.
  • 40. DONE BY: DIVYA & SHRIMAYI