
Empfohlen
Weitere ähnliche Inhalte
Andere mochten auch
Andere mochten auch (20)
Mehr von sr320
Mehr von sr320 (20)
Kürzlich hochgeladen
Kürzlich hochgeladen (20)
FISH441: Oyster acidification: gene and protein expression
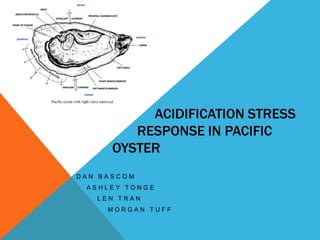
- 1. ACIDIFICATION STRESS RESPONSE IN PACIFIC OYSTER DAN BASCOM ASHLEY TONGE LEN TRAN MORGAN TUFF
- 2. BACKGROUND Adult Pacific oysters (Crassostrea gigas), photo credit: NOAA/Taylor Seafoods
- 3. OBJECTIVES To determine if acidification would generate a particular stress response in Pacific oysters Gene Expression • Len - metallothioneins • Ashley - gigasin2 • Morgan - HSP70 Protein Expression • Dan – HSP70 3D model of HSP70, photo credit usnon.comhealth
- 4. Experimental Design CO2 (Praxair) ~pH = 7.24 ~pH = 5.24
- 5. Experimental Design 18x 2n 15x 3n
- 6. Experimental Design 12x 2n 6x 2n 10x 3n 5x 3n ~pH = 7.24 ~pH = 5.24
- 7. Experimental Design 24 hours ~pH = 5.24 Sample 6x 2n 5x 3n
- 8. Experimental Design 6x 2n 5x 3n 120 hours Dry ~pH = 7.24 12x 2n 6x 2n 10x 3n 5x 3n ~pH = 7.24 Wet
- 9. Experimental Design 6x 2n 5x 3n 24 hours Sample 6x 2n 5x 3n ~pH = 7.24
- 10. METHODS qPCR-used to quantify expression of a specific DNA sequence using pre- designed primers SDS-PAGEWestern Blot-used to separate proteins by size then stain specific proteins for quantification using antibodies
- 11. SDSPAGE/Western Blot • Wells 2 and 3-high pH/dry diploid • Well 4-high pH/wet diploid • Wells 5 and 6-low pH diploid
- 12. Results • Ha: low pH treatments(wells 5 and 6) will have more HSP70 and thus appear brighter after staining – Reject • Ho: high and low pH treatments will show equal levels of HSP70 – Insufficient evidence to confirm • HSPs 60-90 kilodaltons • No binding to HSP70 • Banding at <10 kilodaltons could be to homologous protein fragments • Ubiquitin 8 kilodaltons, found in all cells
- 13. HSP-70 GENE EXPRESSION • 3n supposedly more resistant • Lower in Hsp70 in Dry
- 14. HSP-70 GENE EXPRESSION • Results not significant • Hypotheses for low Hsp-70 • Increased acidification Shut down transcription • Not stressed: Hsc70
- 15. EFFECTS OF ACIDITY ON CALCIFICATION Internal acidification during low tide imitated by emersion for final 24-hour period. Limited or stopped Calcification and shell formation in order to maintain homeostasis in the stress of acidity.
- 16. Metallothionein - Results Average MT Gene Expression 2n vs. 3n Crassostrea Gigas in Control pH (7.24pH) 0.025 0.02 Relative Gene Expression 0.017457467 0.015 0.008987637 0.01 0.005 0 MT_2n MT_3n Ploidy t-Test: Two-Sample Assuming Unequal Variances Variable 1 Variable 2 Mean 0.017457467 0.008987637 Variance 5.84378E-05 1.4464E-05 Observations 2 3 Hypothesized Mean Difference 0 df 1 t Stat 1.45170504 P(T<=t) one-tail 0.192004587 t Critical one-tail 6.313751514 P(T<=t) two-tail 0.384009175 t Critical two-tail 12.70620473
- 17. Metallothionein - Results Average MT Gene Expression 2n vs. 3n Crassostrea Gigas in Low pH (5.24 pH) 0.00006 0.00005 Relative Gene Expression 0.00004 4.20392E-05 0.00003 2.21536E-05 0.00002 0.00001 0 MT_2n MT_3n Ploidy Variable 1 Variable 2 Mean 4.20392E-05 2.21536E-05 Variance 1.04276E-09 1.97468E-10 Observations 3 4 Hypothesized Mean Difference 0 df 3 t Stat 0.998085905 P(T<=t) one-tail 0.195897224 t Critical one-tail 2.353363435 P(T<=t) two-tail 0.391794448 t Critical two-tail 3.182446305
- 18. Metallothionein - Results MT Gene Expression in Control pH vs. Low pH for 2n and 3n Crassostrea Gigas 0.018 0.017457467 0.016 0.014 Relative Gene Expression 0.012 0.01 0.008987637 0.008 Control pH Low pH 0.006 0.004 0.002 4.20392E-05 2.21536E-05 0 MT_2n MT_3n Ploidy MT_3n MT_2n Variable 1 Variable 2 Variable 1 Variable 2 Mean 0.008987637 2.21536E-05 Mean 0.017457467 4.20392E-05 Variance 1.4464E-05 1.97468E-10 Variance 5.84378E-05 1.04276E-09 Observations 3 4 Observations 2 3 Hypothesized Mean Difference 0 Hypothesized Mean Difference 0 df 2 df 1 t Stat 4.083085249 t Stat 3.221806557 P(T<=t) one-tail 0.027536942 P(T<=t) one-tail 0.095797511 t Critical one-tail 2.91998558 t Critical one-tail 6.313751514 P(T<=t) two-tail 0.055073883 P(T<=t) two-tail 0.191595021 t Critical two-tail 4.30265273 t Critical two-tail 12.70620473
- 19. Results – What do they mean? •Statistically no significant differences – p < 0.05 & t Stat < t Critical •2n vs. 3n •Control pH t Stat 1.45170504 t Critical two-tail 12.70620473 P(T<=t) two-tail 0.384009175 •Low pH t Stat 0.998085905 t Critical two-tail 3.182446305 P(T<=t) two-tail 0.391794448 •Low pH vs. High pH MT_2n MT_3n t Stat 3.221806557 t Stat 4.083085249 t Critical two-tail 12.70620473 t Critical two-tail 4.30265273 P(T<=t) two-tail 0.191595021 P(T<=t) two-tail 0.055073883
- 20. Results – What do they mean? •Hypothesis 1: Increasing stressors like ocean acidification upregulates metallothionein gene expression •UNSUPPRTED •Hypothesis 2: There is a difference in metallothionein gene expression in response to ocean acidification between C. gigas ploidy •UNSUPPRTED
- 21. Whyyyyy??? =[ • At pH 5.24, oysters died within 24 hours. – Possible RNA degradation • Misinterpreting gene expression results • Metallothionein gene was expressed! – Sufficient level in terms of acidity • Minimal but sufficient for acidic conditions
- 22. What next? • Time span – Longer study • Time for acclimatization • Different pHs – Closer to actual seawater – Moderate acidic deviation from control
Hinweis der Redaktion
- Pacific oyster (Crassostrea gigas)-native to Japan, introduced to the North American west coast and Puget Sound in early 1900’s for aquaculture. Now the most commonly farmed oyster in the world, hatcheries produce diploid and triploid varieties. Prefers habitats in the intertidal zone, during low tide, its shell closes for protection and to prevent water loss.