Reports with PEAR::Image_Graph
•
0 gefällt mir•700 views

Date: 2005-05-04 Location: Amsterdam, Netherlands Event: International PHP Conference

Empfohlen
Weitere ähnliche Inhalte
Mehr von SpeedPartner GmbH
Mehr von SpeedPartner GmbH (16)
Kürzlich hochgeladen
Kürzlich hochgeladen (20)
Reports with PEAR::Image_Graph
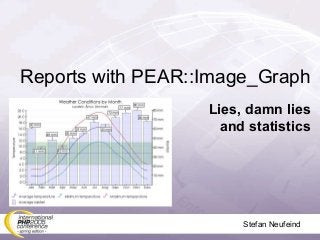
- 1. Reports with PEAR::Image_Graph Lies, damn lies and statistics Stefan Neufeind
- 2. Stefan NeufeindReports with PEAR::Image_Graph 2 Agenda • Need for graphs • Existing solutions • PEAR::Image_Graph • Basics • Components of a graph • Examples • Datapreprocessors • Output drivers • Resources
- 3. Stefan NeufeindReports with PEAR::Image_Graph 3 The needs • Business needs • Visualization of website visitors, sales, ... • Transform raw figures and tables to pictures • Easy to read, easy to use (output) • Developer needs • Shipped with collection of graph-elements • Flexible output (usable for different media) • Scriptable • “Easy” to use (API)
- 4. Stefan NeufeindReports with PEAR::Image_Graph 4 Existing solutions • OpenOffice.org, Excel, ... • Integrated solutions • Ready-to-use • Flexibility ? • Scriptable ? • Export (e.g. for the web) ?
- 5. Stefan NeufeindReports with PEAR::Image_Graph 5 Existing solutions • Toolkits for scripting (PHP) • PHPlot • Procedural API (scalability? ease of use?) • Backward-compatibility: even PHP3 + GD 1.2 (features?) • GPL-license (Non-GPL use not possible) • GD-library only • JpGraph • Object-oriented API • Feature-rich • Dual-licensing (non-commercial + professional) • GD-library only
- 6. Stefan NeufeindReports with PEAR::Image_Graph 6 The idea • PEAR::Image_Graph • Object-oriented, flexible, extendable • Integrated in PEAR • Community-based development • Free use under LGPL • Driver model for output • Re-design as of v0.3.0; base: “GraPHPite” by Jesper Veggerby, Denmark merged features from existing Image_Graph by Stefan Neufeind, Germany
- 7. Stefan NeufeindReports with PEAR::Image_Graph 7 What's needed • PHP 4 (mostly 4.3.0 required) or PHP 5 • PEAR support • GD support (for standard GD-output) • Support for GD1 and GD2 (recommended!) • PEAR::Image_Color • Optional PEAR-packages: • For data-preprocessors: 'Numbers_Words', 'Numbers_Roman' • Error logging via 'Log'
- 8. Stefan NeufeindReports with PEAR::Image_Graph 8 The basics • Use factory-methods • Not required – but allows “lazy includes“ include 'Image/Graph.php'; $Graph =& Image_Graph::factory ('graph', array(600, 400)); // instead of $Graph =& new Image_Graph(600, 400); // ...
- 9. Stefan NeufeindReports with PEAR::Image_Graph 9 The basics • Mind the ampersand (call by reference) • Otherwise problems with modifying objects // ... $Plot =& $Graph->addNew ('line', &$Dataset); // without ampersand the following // would be impossible $Plot->setLineColor('red'); // ...
- 10. Stefan NeufeindReports with PEAR::Image_Graph 10 The basics • Adding elements to parents // ... $newElement =& Image_Graph::factory( 'some element', array($param1, $param2, &$param3) ); $parentElement->add($newElement); // better instead do: $parentElement->addNew('some element', array($param1, $param2, &$param3)); // ...
- 11. Stefan NeufeindReports with PEAR::Image_Graph 11 The basics • Components of a graph: • graph • plotarea (to create the plots on) • plot • dataset (data to plot) • additional elements (e.g. legend)
- 12. Stefan NeufeindReports with PEAR::Image_Graph 12 Simple example • Adding elements to parents include 'Image/Graph.php'; $Graph =& Image_Graph::factory('graph', array(400, 300)); $Plotarea =& $Graph->addNew('plotarea'); $Dataset =& Image_Graph::factory('dataset'); $Dataset->addPoint('Denmark', 10); $Dataset->addPoint('Norway', 3); $Dataset->addPoint('Sweden', 8); $Dataset->addPoint('Finland', 5); $Plot =& $Plotarea->addNew('bar',&$Dataset); $Graph->done();
- 13. Stefan NeufeindReports with PEAR::Image_Graph 13 Plotarea • Holds axis-layout • Container for plots • Standard-behaviour: • X-axis textual ('Denmark','Sweden', ...) • Y-axis linear • Types: 'axis' (linear), 'axis_log' (logarithmic), 'Image_Graph_Axis_Category' (textual) $Plotarea =& $Graph->addNew('plotarea', array('axis', 'axis_log'));
- 14. Stefan NeufeindReports with PEAR::Image_Graph 14 Plots • Types: 'line', 'area', 'bar', 'smooth_line', 'smooth_area', 'pie', 'step', 'impulse', 'dot' or 'scatter', 'radar', Image_Graph_Plot_CandleStick, Image_Graph_Plot_Band • Special modes: 'normal', 'stacked', 'stacked100pct' // ... $Plot =& $Plotarea->addNew('bar', &$Dataset); // ...
- 15. Stefan NeufeindReports with PEAR::Image_Graph 15 Plots
- 16. Stefan NeufeindReports with PEAR::Image_Graph 16 Data for plots • Directly giving points $Dataset =& Image_Graph::factory('dataset'); $Dataset->addPoint('Denmark', 10); $Dataset->addPoint('Norway', 3); function foo($bar) { return 2 * $bar + 10; } // 100 values between -3 and 10 $Dataset =& Image_Graph::factory ('function', array(-3, 10, 'foo', 100)); • Function callback
- 17. Stefan NeufeindReports with PEAR::Image_Graph 17 Using colors • Derived version from Image_Color • Allows • Color names (e.g. 'green') or RGB ('#00ff00', '75%,20%,19%', array(0, 255, 0) • Optionally opacity ('red@0.2', '#00ff00@0.9', array(0, 255, 0, 0.2)) $element->setLineColor('red'); $element->setFillColor('#0000ff@0.1'); $element->setBackgroundColor('green@0.1'); $element->setBorderColor(array(0, 0, 0));
- 18. Stefan NeufeindReports with PEAR::Image_Graph 18 Using fillstyles • Simple fill • Gradient fill • Vertical, horizontal, diagonally, radial $fill =& Image_Graph::factory( 'Image_Graph_Fill_Image', 'image_fill.png'); $element->setFillStyle($fill); $fill =& Image_Graph::factory('gradient', array(IMAGE_GRAPH_VERTICAL, 'white','red')); $element->setFillStyle($fill); • Using image
- 19. Stefan NeufeindReports with PEAR::Image_Graph 19 Layouts • Horizontal, vertical, ... // split 40% from left; A and B are plotareas $Graph->add(Image_Graph::horizontal( $A, $B, 40) ); // directly create plotareas as well $Graph->add(Image_Graph::vertical( $part1 = Image_Graph::factory('plotarea'), $part3 = Image_Graph::factory('plotarea'), 40 ) );
- 20. Stefan NeufeindReports with PEAR::Image_Graph 20 Layouts • ..., matrix $Matrix =& $Graph->addNew ('Image_Graph_Layout_Matrix', array(2, 2)); $part1 =& $Matrix->getEntry(0, 0); $part2 =& $Matrix->getEntry(0, 1); $part3 =& $Matrix->getEntry(1, 0); $part4 =& $Matrix->getEntry(1, 1);
- 21. Stefan NeufeindReports with PEAR::Image_Graph 21 More complex example • TrueType-font, title, plotarea, legend • Vertical layout • Gradient fill • Two y-axes • Axes-titles
- 22. Stefan NeufeindReports with PEAR::Image_Graph 22 More complex example // create the graph $Graph =& Image_Graph::factory('graph', array(400, 300)); // add a TrueType font $Font =& $Graph->addNew('ttf_font', 'Gothic'); // set the font size to 11 pixels $Font->setSize(8); $Graph->setFont($Font); // create the plotarea layout $Graph->add(Image_Graph::vertical( Image_Graph::factory('title', array('Primary & Secondary Axis', 11)), Image_Graph::vertical( $Plotarea = Image_Graph::factory ('plotarea'), $Legend = Image_Graph::factory('legend'), 90),5) );
- 23. Stefan NeufeindReports with PEAR::Image_Graph 23 More complex example // make the legend use the plotarea $Legend->setPlotarea($Plotarea); // create a grid, assign to the secondary Y axis $GridY2 =& $Plotarea->addNew('bar_grid', IMAGE_GRAPH_AXIS_Y_SECONDARY); $GridY2->setFillStyle(Image_Graph::factory( 'gradient', array(IMAGE_GRAPH_GRAD_VERTICAL, 'white', 'lightgrey') ) ); // create a line plot using a random dataset $Dataset1 =& Image_Graph::factory('random', array(8, 10, 100, true)); $Plot1 =& $Plotarea->addNew('line', &$Dataset1); $Plot1->setLineColor('red');
- 24. Stefan NeufeindReports with PEAR::Image_Graph 24 More complex example // create an area plot using a random dataset $Dataset2 =& Image_Graph::factory('random', array(8, 1, 10, true)); $Plot2 =& $Plotarea->addNew ('Image_Graph_Plot_Area', $Dataset2, IMAGE_GRAPH_AXIS_Y_SECONDARY); $Plot2->setLineColor('gray'); $Plot2->setFillColor('blue@0.2'); // set the titles for the plots $Plot1->setTitle('Primary Axis'); $Plot2->setTitle('Secondary Axis');
- 25. Stefan NeufeindReports with PEAR::Image_Graph 25 More complex example $AxisX =& $Plotarea->getAxis(IMAGE_GRAPH_AXIS_X); $AxisX->setTitle('Oranges'); $AxisY =& $Plotarea->getAxis(IMAGE_GRAPH_AXIS_Y); $AxisY->setTitle('Apples', 'vertical'); $AxisYsecondary =& $Plotarea->getAxis (IMAGE_GRAPH_AXIS_Y_SECONDARY); $AxisYsecondary->setTitle('Pears', 'vertical2'); // output the Graph $Graph->done();
- 26. Stefan NeufeindReports with PEAR::Image_Graph 26 Data preprocessors $AxisX =& $Plotarea->getAxis(IMAGE_GRAPH_AXIS_X); $AxisX->setDataPreprocessor(Image_Graph::factory ('Image_Graph_DataPreprocessor_Array', array(array(1 => '30 Jul', 2 => '31 Jul', 3 => '1 Aug', 4 => '2 Aug') ) ) ); $AxisY =& $Plotarea->getAxis(IMAGE_GRAPH_AXIS_Y); $AxisY->setDataPreprocessor(Image_Graph::factory ('Image_Graph_DataPreprocessor_Formatted', '+ %0.1f%%')); • Adjustment / translation of axis
- 27. Stefan NeufeindReports with PEAR::Image_Graph 27 Output drivers include 'Image/Graph.php'; include 'Image/Graph/Driver.php'; $Driver =& Image_Graph_Driver::factory('svg', array('width' => 400, 'height' => 200) ); $Graph =& Image_Graph::factory('graph', &$Driver); • Currently available: • GD (GIF, JPG, PNG, WBMP) • but also: PDFlib, SVG, SWF • Extendable interface
- 28. Stefan NeufeindReports with PEAR::Image_Graph 28 Resources • Package home: http://pear.php.net/Image_Graph • Lots of examples (visual and code): http://pear.veggerby.dk • PEAR mailinglists (pear-general) • International PHP Magazine 4/05
- 29. Stefan NeufeindReports with PEAR::Image_Graph 29 That's Image_Graph Thank you for your attention! QUESTIONS ? pear.neufeind @ speedpartner.de Slides available at: http://pear.speedpartner.de/