SlideShare ist ein Scribd-Unternehmen logo
1 von 53
1
International Management Institute Kolkata
Summer Internship Report
On
Analyzing the Debt Schemes of Kotak Asset management company
limited with Special Reference to Kotak Bond Fund
Name: Sourav Kumar Mahato
PGDM 2015-17
Kotak Mahindra Asset Management Company Limited
Corporate Internship Mentor
Name: Deepak Kumar Kaushik
IMI-K Faculty Mentor
Name: Chanchal Chatterjee
Start Date for internship: 01st
April 2016
End Date Internship: 10th
June 206
Report Submission Date: 25th
June 2016
2
Serial Number Contents Page number
1 Certificate by the Mentor 3
2 Declaration Certificate 4
3 Acknowledgement 5
4 Objective of the Report 6
5 Selection of Topic 6
6 Objective of the Study 7
7 Methodology of the Project 7
8 Scope of the Study 7
9 Limitation of the study 8
10 Kotak Mahindra Group of Companies 8
11 Vision and mission 9
12 About Debt Portfolio Management 9
13 Classification of Debt Securities 9
14 Debt Market Instruments 10-11
15 Basic Characteristics of Debt Securities 11-12
16 Risk in Investing in Bonds 13
17 Investment Policies and Restrictions 13
18 Minimum Portfolio Diversification Norms 14
19 Introduction to Mutual Fund 15
20 Emergence of Mutual Fund 15
21 History of Mutual Fund 15-20
22 Mutual Fund Framework 21
23 Disadvantage of Mutual Fund 23
24 Classification of Mutual Fund 24
25 Offer document by Fund Houses 26
26 Accounting for Mutual Fund 27
27 Measuring and Evaluating Funds Performance 30
28 The Risk-Return Tradeoff 32
29 Debt market review 33
30 About Kotak Bond Fund 34
31 Fund Overview 34
32 Investment objective and Strategy 35
33 Asset allocation and 36
34 Return Matrix 37
35 Return Analysis 38
36 Portfolio action (FY2015-2016) 40-47
37 Monthly dividend (FY2015-2016) 48
38 Glossary 49-52
39 Bibliography 53
3
Certificate by Mentor
This is to certify that the contents of this report entitled “Mutual Fund Analysis on Debt Schemes
with Special Reference to Kotak Bond Fund” by ______________________________________
submitted to International Management Institute Kolkata for the Partial fulfilment of the
requirement of the Degree “Post Graduate Diploma in Management (PGDM)” is the original Work
which has been carried out under my supervision. I hereby certify the authenticity of the Data
and Facts mentioned in the report.
Deepak Kumar Kaushik Date: - ……………………….
(Manager)
Kotak Mahindra Asset Management Company Limited
235/2A, A. J. C. Bose Road, 3rd Floor, the Millennium
Kolkata – 700020.
+91 - 33 - 2282 2411/14
+91 - 33 - 2282 1102
Mobile- 9007977767/9830988500,
Email-deepak.kaushik@kotak.com
4
Declaration
I, Sourav Kumar Mahato (15PGDM074), to the best of our knowledge hereby declare that the
project report entitled “Mutual Fund Analysis on Debt Schemes with Special Reference to Kotak
Bond Fund” submitted to the International Management Institute, Kolkata is a record of an
Original work done by us under the guidance of Dr. Chanchal Chatterjee. This Project work is
submitted in the partial fulfilment of the academic requirement.
The project report has been submitted to Kotak Mutual Fund and International Management
Institute Kolkata.
Date: -……………......... Sourav Kumar Mahato (15PGDM074)
5
Acknowledgement
It is a matter of great pleasure for us in submitting the project report on “Mutual Fund Analysis
on Debt Schemes with Special Reference to Kotak Bond Fund” for the fulfilment of the
requirement of the academic course.
This successful project report has been made possible through the direct cooperation and
guidance of various people for whom we wish to express our appreciation and deep gratitude.
Words seemto be inadequate to express our thanks to Mr. Deepak Kaushik for his valuable
guidance, untiring efforts and immense encouragement during the entire course of the study.
We are highly obliged to Mr. Sachin Sood, Mr. Anupam Patnaik, Mr. Somnath Chakraborty,
Mr. Krishanu Bannerjee, Mr. Kamal Agarwal, and other members of Kotak Mutual Fund
Kolkata Office, who had helped us to procure primary data to complete our project.
I would like to thank Dr. Chanchal Chatterjee for helping me completing the project.
Last but not the least I am very grateful to all those who helped us in one way or the other at
every stage of our work.
6
Objective of the Project
Theoretical Knowledge without Practical Experience is of no use. So, without Practical
implementations, theory remains no use. Hence we need to gain the Practical Experience. And
what better would be, then a Project work for the same.
Also as a part of our PGDM curriculum, we need to undergo for the Summer Internship
programmed for minimum of 8 Weeks, in a company.
I selected area of MUTUAL FUND INDUSTRY, which pools the funds & reduces risk by investing in
different diversified assets.Istudied as to how this industry proves to an option for the investors,
by studying the performance of mutual funds for few months considering their Net Asset Values.
Hence this is a project work on a “Debt Portfolio Analysis with special reference to Kotak Bond
Fund”.
Selection of Topic
Generally, when we decide to study the investment options available in today’s complex & risky
scenario, we should thoroughly evaluate the option upon various factors. These factors should
include:
 The Past Performance of the option under study
 Risk adjusted returns from the invested plan
 The Economic Factors
 Fund House
When observed the above parameters for the evolution of The Financial Performance of the
option under study, then immediate concept that clicks our mind is MUTUAL FUNDS. So for this,
I have selected to study Debt Scheme Analysis as investment option.
Study of Debt Fund includes: -
 Study of Debt, Bonds, Securities, etc.
 Risk Measurement & risk diversifications
 Analyzing a Particular Scheme.
7
Objective of the Study
 How to find the RIGHT SCHEME to buy & Redeem at RIGHT TIME, thereby mobilizing the
saving aptly.
 How to get good return on investment
 How to achieve Capital appreciations
 To analyze the performance of Various Schemes of the Fund House.
Methodology of the Project
Defining objective won’t suffice unless & until a proper methodology is to achieve the objectives.
1. The methodology of the project here is to analyze the investments Opportunities
available for the investors & study the returns & risk involved in various investment
opportunities.
2. Study of investment management, risk management & portfolio Diversification.
3. The methodology of the project here is to analyze the Mutual Fund performance based
on: -
 NAV (Net Asset Value): - It tracked the daily NAV’s of the Mutual Funds to compute
the performance.
 Total Return Basis: By taking into account dividends distributed by the funds between
the two NAV s change to arrive at a total return.
 Portfolio turnover Ratio: This means the Amount of Buying & selling done by a fund.
 Study Financial & Legal obligations of Mutual Funds.
Scope of the Study
The study encompasses different aspects from point of view of investors as follows.
1. Investment portfolio selection
2. types of Mutual Funds
3. Expected returns on investment
4. Investment in Tax Saving Schemes.
Despite various problems, India Could still have a lot of profitable opportunities to offer in this
sector. And giventhe fact it is the major emerging market to open up. It is equally important that,
even if its various Fund Investments can harness a small part of the total funds available
internationally, Indian Foreign Exchange reserves will shoot up. According to World Bank Study,
portfolio investment in the emerging markets will rise (Actual figures are yet not published for
the same).
8
Limitations of the Study
 This project is not funded one, hence it gets restricted to a mere in depth study & few
guidelines for investors.
 This study is carried out in pursuance of curriculum MBA, which is mandatory for period
of two months; hence exhaustive data is not available upon which conclusion can be
relied upon.
 NAV are prone to environmental factors 7 which would influencethe value during trading.
Investments in Securities carry risks & Mutual Fund units are no exception.
 Risk being erosion in the Market value of the Investment of decrease in the percentage
dividends declared by the Mutual Fund. The risk factors inherent in a Mutual Fund
Schemes are the schemes, market risk, & the investment experience of the Asset
Management Company.
 Factors affecting the Market Price of Investment may be due to Market forces,
performance of the companies, Govt. Policies, Interest rates & so on.
 Study for all the existing Mutual Fund Schemes is not feasible, Sample schemes of all
Mutual Fund Types are considered for the Study.
Kotak Mahindra Group of Companies
This Group Consists Following Companies: -
 Kotak Mahindra Bank Limited (KMBL)
 Kotak Mahindra Old Mutual Life Insurance Ltd
 Kotak Securities
 Kotak Mahindra General Insurance Company Ltd.
 Kotak Investment Banking (KMCC)
 Kotak Mahindra Prime Ltd(KMPL)
 Kotak International Business
 Kotak Private Equity Group(KPEG)
 Kotak Realty Fund
 Kotak Mahindra Asset Management Company(KMAMC): - Kotak Mahindra Asset
Management Company offers a complete bouquet of asset management products and
services that are designed to suit the diverse risk return profiles of each and every type
of investor. KMAMC and Kotak Mahindra Bank are the sponsors of Kotak Mahindra
Pension Fund Ltd, which has been appointed as one of six fund managers to manage
pension funds under the New Pension Scheme (NPS).
9
Company’s Vision and Mission
To be the most trusted Global Indian Financial Services brand and the most preferred financial
services employer with focus on creating value.
 The Global Indian Financial Services Brand: -Our customers will enjoy the benefits of
dealing with a global Indian brand that best understands their needs and delivers
customized pragmatic solutions across multiple platforms.
 We will be a world class Indian financialservices group. Our technology and best practices
will be bench-marked along international lines while our understanding of customers will
be uniquely Indian.
 We will be more than a repository of our customers' savings. We, the group, will be single
window to every financial service in a customer's universe.
 The Global Indian Financial Service Brand
 The Most Preferred Financial Employer in Financial Services
 The Most Trusted Financial Services Company
 Value Creation
DEBT PORTFOLIO MANAGEMENT
Debt portfolio has to contend with the construction & management of portfolio debt instrument,
the primary objective of generating income. Just as the inquiry fund manager has to go through
a stock selection process, a debt fund manager has to select from whole universe of debt
securities he wants to invest in.
Classification of Debt Securities
Many instruments give regular income. However, in the context of debt mutual funds, manager
invest only in market-trader instrument (not in loans as done by the bank) debt instrument
may be secured by the assets of the borrowers as in case of corporate, or be unsecured as is
the case with Indian Financial Bond.
A Debt is issued by a borrower & is often known by the issuercategory thus giving us Government
security & Corporate Securities or FI Bonds. Debt instrument are also distinguished by their
maturity profile. Thus, instrument issued with short term maturities, typically under one year
maturities are classified as Money Market Securities instrument carrying Long then one year
maturities are generally called Debt Securities.
Most debt securities are interested bearing. However, there are securities that are discounted
securities or zero coupon bonds that are generally fixed that pay interest on a Floating Rate basis.
There are lots of new instruments coming in the debt markets.
10
Instruments in the Indian Debt Market
The objective of a debt is to provide investors with a stable income stream. Hence, a debt fund
invests mainly in instrument that yields a fixed rate of return & where the principal is secured.
The debt market in Indian offers the following instruments for investment for by Mutual Funds.
Certificates of Deposits
Certificates of Deposit (CD) are issued by scheduled commercial banks excluding regional rural
banks. These are unsecured negotiable promissory notes. Banks CDs have a maturity period of
91 days to one year, while those issued by FI s have maturities between one & three years.
Collateralized Borrowing and Lending Obligation (CBLO)
A collateralized borrowing and lending obligation (CBLO) is a money market instrument that
represents an obligation between a borrower and a lender as to the terms and conditions of the
loan. Collateralized borrowing and lending obligations (CBLOs) are used by those who have been
phased out of or heavily restricted in the interbank call money market.
Commercial Paper
Commercial Paper (CP) is a short term, unsecured issued by corporate bodies (Public & Private)
to meet short-term working capital requirement. Maturity varies between 3 months & 1 year.
This instrument can be incorporated in Indian. CP s can be issued to NRI s on non-repairable &
non- transferable basis.
Corporate Debentures
The debentures are usually issued by manufacturing companies with physical assets, as secured
instruments; in the form of certificates they are assigned a credit rating by rating agencies.
Trading in Debentures is generally based on the current yield & market values are based on yield
of maturity. All publicly issued Debentures is listed on exchange.
Floating Rate Bonds
These are short to medium term bearing instruments issued by the financial intermediaries &
corporate. The typicalmaturity of these bonds is 3to 5 years.FRB s issuedby FinancialInstitutions
are generally unsecured while those from private corporate are secured. The FRB s are pegged
to different reference as much as T- bill or bank deposits rates. The FRB s issued by the
Government of Indians are in the form of Stock Certified of issued by credit to SGL accounts
maintained by the RBI.
11
Government Security
These are medium to long term interest bearing obligations issued through the RBI by the
Government of India & State Governments. The RBI decides the cut-off on the basis of bids
received during the auctions. These are issued where the rates are pre-specified & the investor s
only bids for the quality. In most cases, the coupon is paid semiannually with bullet redemption
features.
A large part of the trading is concentrated in those government securities that are eligible for
repost (repurchase) transition, i.e. sale of a security with a parallel agreement to repurchase the
same at a future date. The RBI acts as the depository; its public debt office maintains an SGL
account for various banks & Financial Institution, & issues or transfers the securities in the form
of book entries made in SGL accounts. If a fund does not have an SGL account, it may open a
constitution account with any RBI- registered bank.
Treasury Bills
T- Bills are shortly obligation issued through the RBI by the Government of India at a discount the
RBIIssues T-Bills fordifferent tenures: 14 days, 91 days &364 days.These treasury bills areissued
through an auction procedure. The yield is determined on the basis bids tendered & accepted.
Bank/ FI Bond
Most of the institutional bonds are in the form of promissory notes transferable by endorsement
& delivery. These are negotiable, issued by the Financial Institution such as IDB/ ICICI/ IFCI or by
commercial bank. These instruments have been issued both as regular income bonds & as
discounted long term instruments (deep discount bonds).
Public Sector Undertaking (PSU) Bonds
PSU Bonds are medium & long term obligation issued by Public sector companies in which the
government shareholding is generally greater than 51%. Some PSU Bonds carry tax exemptions.
The maximum maturity is 5 years for Taxable bonds & 7 years for Tax- Free Bonds. PSU bonds are
generally, not guaranteed by the government & are in the form of promissory notes transferable
by endorsement & delivery. PSU bonds in Electronic form (Demat) are eligible report
transactions.
Basic Characteristics of Bonds or Debt Security
A debt fund or a bond fund generally invest a large part of its corpus in longer term fixed income
in debit securities issued by government, companies or Banks/ FI s. A small part is invested in
money market. In Indian context, long dated government securities, corporate debentures & FI
Bonds from the bulk of debt fund portfolios.
12
Bonds have the following four keys characteristics set at the time of issue:
 Par Value: This is the principal amount that investors will be paid upon Maturity of the
bonds, & is also known as the face value.
 Coupon: This is the annual rate of interest paid on the par value of the Bond to the
investor.
 Maturity: This refers to the term of the bond that is, the date on which the Bond that is,
the date on which the issuer has to repay the principle amount of the Bond.
 Call orProvision:Theseareincluded insome bond contracts to allow the issuerthe option
to redeem the bonds before Maturity thereby allowing refinance of debt at lower interest
rates.
Measuring of Bond Yields: Returns on a fixed income security is generally computed in the form
of Current Yield or a Yield to Maturity.
Current Yield: This relates interest on a Bond to its Current Market Price by dividing the annual
coupon interest by the current market price.
 Yield to Maturity (YTM): This is a sophisticated technique of bond analysis. Posen defines
YTM (also known as the bonds IRR) as the annual rate of return & investors would realize
if he a bond at a particular price, & received the principal at maturity. YTM allows
investors to compare bond with different coupons, maturities & price & is quoted for
trading purposes. The relationship between the price & YTM of a bond is expressed by
the following formula:
PRICE= Coupon / (1+ YTM) + Coupon2 / (1+ YTM) 2. +(Coupon Principle) / (1+ YTM) n
The inverse relation between price & YTM is important in bond portfolio management.
 Yield Curve: This is the graph showing yields for bonds various maturities, using a
benchmark group of bond, such as the Government Securities. This is also known as the
Term Structure of Interest Rates (TRIR). This yields curve usually upwards sloping become
longer maturities generally offer higher yields. This is because longer term debt carries
higher risk on account of inflation & other economic factors. The yield curve is important
indicators of expected trends in interest rates.
13
Riskin Investing in Bond
1) Interest Rates-Risk: The price of bond will change in a direction opposite to movement in
interest rates. When interest rates rise bond price will fall, thus an existing bond portfolio losing
valve. A sound analysis of interest rates movement is therefore essential.
2) Reinvestment Risk: A bonds yield to maturity assumes reinvestment of interest received
during the term at a constant rate. This not may be possible if interest rate changes & risk is of
uncertain cash flow being reinvested at a lower rate.
3) Call Risk: If a bond has been issued with a call provision the issuer may call them back & return
the proceeds to the investors whenever interest rates fall, so the borrowing can be replaced with
cheaper debt. The investor thus cannot keep a high yield bond.
4) Default Risk: A bond is a subject to the risk that is assured may default on its obligation to
make timely principle & interest payments. A fund needs to assess this risk based on the bonds
rating & the analysis generated by its research on issuer s cash flows.
5) Inflation Risk: When the inflation rate rises, purchasing power decline. Therefore, the value of
interest payment is reduced. Investors will therefore expect higher yields in bonds. Higher
interest rate will make the existing bond lose value again.
6) Liquidity Risk: This refer to the ease with which investment in a bond can be liquidated (or
sold) at a price near its value. This element is important for a fund because its investments are
made on behalf of unit-holder & market conditions may require the fund to liquidate a part of its
portfolio within a short time.
Investment Policies andRestriction
Investment Policy:
Investment Policies of each scheme are dictated by its investment objective as stated in the offer
document. In practice the board policy guidelines are included in the offer documents while the
day to day policies are laid down by the AMC management for the fund manager to conform to
fund manager do have some flexibility in alerting the strategy in the light of changing market
condition & in
specific selection.
Investment strategy of an equity fund will lay down guideline on which sectors & what kind of
companies to invest in, what percentage will be held in the form of cash or money market
14
securities or how much in debt securities. Usually minimum & maximum allocation of funds to
each class- Equity & Cash is specified.
Investment policies of a debt fund will also lay down guidelines on the portfolio & their average
maturity. Minimum & Maximum percentage of Cash/ money market instruments in the portfolio
has to be specified too.
Investment policy of balanced funds will specify the minimum & maximum asset allocations to
equity & debt / cashbesides the normal guidelines for the equity &debt components. Investment
policies of the money market funds will largely specify the type of instrument preferred & their
profile.
Investment Restrictionby SEBI:
While the AMC management the AMC determines the investment policies & its fund manager
must also comply with the restriction imposed by regulator-mostly SEBI & in case of money
market fund the RBI. SEBI s main objective in laying down restriction on AMC s is to ensure
investor protection. The objective is attained by:
1. Maintaining minimum level of diversification in Mutual Fund Investments.
2. Ensuring that the Investor s funds are used to favor a few or associated invested in
approved securities only. To attain this Regulatory objectives, some major restrictions
imposed by SEBI.
Minimum Portfolio DiversificationNorms
Investment in equity shares or equity related instruments of a single company are restricted to
10% of the NAV as a scheme. However, the limit of 10 % does not apply in case of sector/industry
specified schemes subject to adequate discloser in the offer documents. The basic objective here
is to ensure that a fund a fund has an adequately diversified portfolio unless the specified
objective if the scheme is to limit the investments.
Similarly, for debt schemes, SEBI restricts the investment in rated investment grade debt
instrument issued by a single issuer is not allowed to exceed 10% of the NAV subject to approval
of board of AMC & trustee company?
These restrictions do not apply to & money & government securities. SEBI s restriction on the
investment in unlisted share to a minimum of 10 % of the NAV of a scheme for closed end
scheme. In case of open ended the limits may be made more stringent to 5% of the NAV of the
scheme as there is continuous purchase by investors in such a scheme.
15
INTRODUCTION TO MUTUAL FUNDS
The Concept of Mutual Fund Industry
A Mutual Fund is a common pool money into which investor place their contribution that is to be
investors in accordance with a stated objective. The ownership of the joint or Mutual, the fund
belongs to the contribution make a single investor s ownership of the fund to the total amount
of the fund. A mutual fund is a collective investment that allows many investors, with a common
objective, to pool individual investments and give to a professional manager who in turn would
invest these monies in line with the common objective. A Mutual Fund used the money collected
from investors to buy those assets, which are specifically permitted by its stated investment
objective. Thus an equity fund would buy equity asset- ordinary shares, preferences share,
warrants etc. a bond fund would buy debt instrument such as debentures, bonds, or government
securities. It is these assets, which are owns by the investor in the same proportion as their
contribution bears to the total contribution of all investor put together.
Since each owner is a part owner of a Mutual Fund, it is necessary to establish the value of his
part. In other words, each share or unit that investors hold needs to be assigned a value. Since
the unit held by investors evidence the ownership of the funds asset, the value of total asset of
the fund. When divided by the total number of units issuedby the Mutual Fund gives us the value
of one unit. This is generally called the net asset value (NAV) of the number of unit held.
Emergence of Mutual Fund
Mutual Funds now represent perhaps the most appropriate investment opportunity for most
investor, as financial markets become more sophisticated & complex. Investors need a Financial
Intermediary who provides the required knowledge & professional expertise on successful
investing. It is no wonder then in the birthplace of Mutual Fund the U.S.A. the fund industry has
already overtaken the banking industry more funds being under Mutual Fund Management than
deposited with the bank.
The Indian Mutual Fund Industry is a fast growing segment of the economy. The Industry consists
of 36 Mutual Funds including Unit Trust of India. With 397 schemes spread over variety products
the industry today manages assets close to Rs. 97,000 crores.
The Indian Mutual Fund Industry has already started opening up, of many of exciting investment
opportunity to Indian investors. We have started witnessing the phenomenon of more saving
now being entrusted to the funds than to the banks. Mutual Funds as still a new Financial
Intermediary in India. Hence it is important that the investors should make proper analysis of the
available scheme in the market. The investment advisor & even the fund employees acquire
better knowledge of what Mutual Funds are. What, they can do for investor & what they cannot
16
& how they function differently from other intermediaries such as the banks. The association of
Mutual Funds in India has commissioned a workbook, as the basic compellation of the minimum
knowledge requires by both fund distributors & the employees. The workbook provided by AMFI
can serve as a guide distributors & employees.
History ofMutual Funds in India
The Indian Mutual Fund Industry began with the formation of the Unit Trust of India (UTI) in 1964
by the Government. UTI was formed as a non-profit organization governed under a special
legislation, the Unit Trust of India Act, 1963. It had a monopoly up to 1987 & during this period,
UTI launched a series of equity & debt schemes & established itself as a household name with
assets under management of Rs. 4563 crore & unit holder accounts of slightly under 3 Million by
mid-1987. UTI s growth continued up to 1996 when the strong entry of private sector players saw
its share of the market reducing sharply although UTI continues to be a dominant force in the
Indian Financial Services industry with assets of over Rs. 67,000 crores as of December 31, 1999.
In 1987, the Industry saw the entry of Public Sector Mutual Funds, i.e. funds promoted by public
sector banks & financial institutions, such as SBI, Canara Bank, LIC & IDBI. Predictably they were
given the brand of them promoters such as SBI Mutual Fund, Canara bank Mutual Fund, and LIC
Mutual Fund & IDBI Mutual Fund. Other Public Sector Mutual Funds also entered the market but
UTI continued to remain the dominant player with a share of 84% in 1991-92.
The Government first allowed private sector participation in 1993 & the subsequent entry of a
large number of players has made the industry very competitive. The diagram below shows the
three segments & a few of the players in each segment.
UTI was started, at the initiative of the Reserve Bank of India & the Government of India. The
objective then was to attract the small investors & introduce them to market investment. Since,
then the History of Mutual Funds in India can be broadly divided into three distinct phases.
Phase I: 1964 87 (Unit Trust of India)
This phase spans from 1964 to 1988. In 1963, UTI was establishedby an act of Parliament & given
a monopoly. Operationally, UTI was set up by the Reserve Bank of India, but was later de-linked
from the RBI. The first & still one of the largest schemes, launched by the UTI was Unit Scheme
1964. Over the years, US-64 attracted & probably still has the largest number of investors in any
single investments schemes.
First Phase (1964- 1987): -
17
June 30, 2000
UTI
Bank Sponsored
Institutions
Private Sector
Establishment of UTI in 1963: -In 1978, UTI was delinked from the RBI & the Industrial
Development Bank of India (IDBI) & took over the regulatory & administrative control in place of
RBI. The first scheme launched by UTI was Unit
Scheme in 1964.At the end of 1988 UTI had Rs.6,
700 crores of assets under Mgmt. UTI had grown
large as evidence by the following statistics:
Phase II: 1987-1993 (Entry of Public Sector Funds)
1987, Marked the entry of non-UTI public sector Mutual Funds, bringing in competition. With the
opening of economy, many public sector bank & financial institution was allowed to establish
Mutual Funds. The State Bank of India established the first non-UTI Mutual Fund- SBI Mutual
Fund- in November 1987. This was followed by Can Bank Mutual Fund (launched in December,
1987), LIC Mutual Funds (launched in 1989) & Indian Bank Mutual Funds (launched in 1990)
followed by Bank of India Mutual Fund, GIC Mutual Fund & PNB Mutual Fund.
The private sector players, after an indifferent start in the early years, have made a strong
impression especially in the larger cities, with a high quality of fund management, sales &
customer service. This sector has dented UTI’s dominance resulting in a falling market share
towards the end of the last millennium.
Asset Under Management: -
June 30, 2000 September 31, 2001
UTI 57.09% 53.60%
Bank Sponsored 3.66% 3.78%
Institutions 4.12% 4.46%
Private Sector 35.13% 38.16%
Total 100.00% 100.00%
Total Amount (in crores) 97953 91811
Year: -1987-1988
Amount Mobilized-2175 Crores INR
Asset Under Management-670 Crores
INR
Mobilization as % of GDP-3.1%
September 31, 2001
UTI
Bank Sponsored
Institutions
Private Sector
18
Open End Close End Assured Return Total
Income 85 28 29 142
Growth 96 15 ---- 111
Balanced 31 04 ---- 035
Liquid 28 ---- ---- 028
Gilt 24 ---- ---- 024
ELSS 19 52 ---- 071
Total 283 99 29 411
Second Phase (1987-1993) / Entry of Public Sector Funds: -
1987 marked the entry of Non- UTI, Public Sector Mutual Fund setup by Public Sector Banks &
LIC of India & General Insurance Corporation of India (GIC) SBI Mutual Fund was the First Non-
UTI Mutual Fund established in June 1987 followed by Canara bank Mutual Fund (Dec.1987),
Punjab National Bank Mutual Fund (Aug.1989), Indian Bank Mutual Fund (Nov.1989), Bank of
India (Jan.1990), Bank of Baroda Mutual Fund (Oct.1992). LIC establishedits Mutual Fund in June
1989 while GIC had setup its Mutual Fund in Dec. 1990. At the end of 1993, The Mutual Fund
Industry had assets under Mgmt. Of Rs. 47,004 Crores.
Gilt Funds
1. Next only to money market fund in risk order
2. Gilts- government securities with medium to long term maturities over one year
3. Investment in government paper called dated securities
4. Negligible risk of default
5. Risk arising out of changes in market price of debt securities
6. Debt securities prices fall when interest rate rise.
Debt Funds
1. Invest in debt securities issued not only by government but also Corporate & financial
institutions
2. Target low risk & stable income
3. Higher price fluctuation risk as compared to money market funds due to significantly
higher maturity period exposures
4. Higher credit risk than gilt funds due to corporate profile
5. Do not target capital appreciation; generate high current income & distribution
substantial part of surpluses to investors.
Third Phase (1993-2003) / Entry of Private Sector Funds: -
All Figures are in Crores
(INR)
19
 1993, the entry of Private Sector a new era started in the Indian Mutual Fund Industry,
giving the Indian Investor a wider choice of Fund Family
 Also 1993, was the year in which the First Mutual Fund Regulation came into being, under
which all Mutual Fund expects UTI were to be register & Governed. The Kothari Pioneer
(now merged with Franklin Templeton) was the First Private Sector Mutual Fund
registered in July 1993.
 In 1993 SEBI (MF) Regulations were substituted by a more Comprehensive & revised MF
Regulations in 1996.
 At the end of Jan.2003 there were 33 MF with Total Assets of Rs.1,21,80 5 Crore. The UTI
with Rs.44, 541 Crores of Asset under Mgmt. was way ahead of other MF Industry has
witnessed several Merges & Acquisitions.
Fourth Phase (Since Feb. 2003): -
 In Feb.2003, UTI was bifurcated into two separate entities.
1. One is the specified Undertaking of the UTI with assets under Mgmt. of Rs. 29,835
Crores as at end of Jan.2003, functioning under an administrator & under the rules
framed by Govt. of India & does not come under preview of MF Regulation.
2. The second is UTI MF Ltd. Sponsored by SBI, PNB, BOB & LIC. It is Registered with
SEBI & Functions under the MF Regulations.
 Bifurcation of UTI in Mar.2000 more than Rs.76,000 Crores of assets Under Mgmt. & with
the setting up of a UTI MF conforming to the SEBI MF Regulations.
 At the end of Sept.2004, there were 29 Funds which Manages assets of Rs. 1, 53,108
Crores under 421 Schemes.
Place of Mutual Fund in Financial Market
Indian household started allocating more of their saving to the capital market in 1980 s with the
investment flowing into equity & Debt instrument beside the conventional mode of the bank
deposits.
Until 1992 Primary Market investors were assured good return as the price of the new equity
issues was controlled. After Introduction of free pricing of shares & with greater volatility in the
Stock Markets, many investors who bought overpriced shares lost money & withdrew from the
markets altogether. Even those investors who continued as direct investors in the Stock Market
realized that the key to the successful investing on the capital markets lay in the building a
diversified portfolio that in turn require substantial capital. Besides selecting securities with
growth & income was not possible for all investor. Under similar circumstances in other
countries, Mutual Fund had emerged as Professional Intermediaries.
Besides providing the expertise in stock market, investing these funds allows investing in small
amount& yet holding a diversified portfolio to limit risk. In India, Unit Trust of India occupied this
20
place as the only capital market intermediary Institution is emerging in India, as elsewhere as a
good alternative to direct investing in the Capital Market.
Mutual Funds serves as a link between the saving public & the capital market in that they
mobilized saving from investors & bring them to borrower in the Capital Market. By the Very
nature of their activities &by virtue of being knowledgeable & informed investors, they influence
the Stock Market & play an active role in promoting good corporate governance, investor
protection & the health of capital market. Mutual Fund have imparted much needed liquidity
into the financial system & challenged the hitherto dominant role of banking & financial
institution in the Capital Markets.
Mutual Fund OperationFlow Chart:
Mutual Fund Framework- INDIA
21
The Advantages of Mutual Fund
 Portfolio Diversification: Each Investor in a Fund is a part of the funds entire asset, thus
enabling him to hold a diversified investment Portfolio even with a small amount of
investment, which would otherwise require big capital.
 Professional Management: Even if an investor has a big amount of Capital available to
him, he benefits from the professional management Skill brought in by the fund in the
management of the investor s portfolio. The investment management skills, along with
the needed research into available investment option, ensure a much better return than
what an Investor can manage on his own. Few investors have the skill & resource of their
own to success in today s fast moving, global & sophisticated markets.
 Reduction / Diversification of Risk: When an investor invests directly, all the risk of
Potential loss is his own, weather he places deposits with a company or bank, or buys a
share debenture on his own or in any other instrument benefits of acollective investment
vehicle are from the Mutual Fund.
22
Tax Benefits
Professional
Management
Diversification
 Reduction of Transaction Costs: What is true of risk is also the transaction costs. The
investors bear all the cost of investing such as brokerage or custody of securities. When
through a fund, he has the benefit of economic of scale; the fund pays lesser costs
because of large volume, a benefit passed on to is investor.
 Liquidity: Often, investors hold share or bonds they cannot directly, easily & quickly sell.
When they invest in the units of a fund, they can generally, case their investment any
time, by selling their units to the fund if open-ended, or selling them in the market if the
fund is closed end. Liquidity of investment is clearly a big benefit.
Open-ended
-Assures liquidity
-As liquid as the banks.
Close-ended
-Buying and selling can be done through the stock exchange
 Conventional & Flexibility: Mutual Fund Management companies offer many investors
services that a direct market investor cannot get. Investors can easily transfer their
holding form one scheme to the other, get updated market information, easy to Invest,
Reduces excessive Paperwork etc.
 Safety: SEBI & RBI have a control over Mutual Fund Making investment in Mutual Fund a
safeinvestment. A very good example here quoted can be of Government of India coming
to rescue of UTI s US- 64 Schemes.
 Affordability:
-Provides an opportunity for a small investor
-Invest as less as an amount of
 Wide Choice:
-Offers a Varieties of Schemes
-Meet the investment needs of all Investors
Mutual Fund- A Packaged Product
23
The Disadvantages of Mutual Fund
No Control Over Costs: An investor in a Mutual Fund has no control Over the overall cost of
investing. He pays investment management fees as long as he remains with the funds, in return
for the professional management & research. Fees are payable even while the value of his
investment may be declining. A mutual fund investor also pays fund distribution costs, which he
would not incur in direct investing.
No Tailor-made Portfolios: Investors who invest on their own can build their own portfolios of
shares, bonds & other securities. Investing through Funds means he delegates this decision to
the fund manager. The very high -net-worth individuals or large corporate investors may find this
to be a constraint in achieving their objectives.
Managing a Portfolio of Funds: Availability of a large number of funds can actually mean too
much choice for the investor. He may again need advice on how to select a fund achieve his
objectives, quite similar to the situation when he has to selectindividual shares or bonds to invest
in.
Developing a Model Portfolio
 Work with Investor to develop long-term goals
 Determine Asset Allocation of the investment
 Determine the sector distribution
 Select specific Fund Manager & their schemes
 Model Portfolio
 Creativity & forecasting
24
Classification of Mutual Fund
Types of Mutual Fund
By Constitution
OPEN-END: No fixed maturity
Variable Corpus
Not Listed
Buy from and sell to the Fund
Entry/Exit at NAV related prices
CLOSED-END: Fixed Maturity
Fixed Corpus
Generally Listed
Buy and sell in the Stock Exchanges
Entry/Exit at the market prices
 Load or Non-Load Funds
 Tax Exempt or Non-Tax Exempt
By Nature of Investments
Financial Assets (Equity/Debt/Money Market)
Physical Assets (Metal/ Real Estate)
Diversified Growth Funds: Diversified Debt Funds
Focused Debt Funds: Sector / Specialized / Offshore
Municipal bonds/ infrastructure cost bond fund
Mortgaged backed
High yield debt funds: Assured Return Funds - Indian variety
Liquid Funds
By Investment objective / patterns
1. Growth – Equity
2. Income – Debt
3. Balanced - Equity and Debt
4. Money Market - Liquid Debt
5. Tax Saving – Equity
25
6. Specialized – Equity
7. Assured Return - Equity and Debt
8. Mutual Fund can also be classified as open/ closed ended Mutual Fund
Open Ended Mutual Fund Close Ended Mutual Fund
Units available for the sale & repurchase Unavailable
Investor can buy or redeem units from the
Mutual Fund itself
Investors can buy units from fund only at IPO
subsequently buying & selling at the Stock
Exchange
Unit Capital is variable Unit capital is fixed
Pricing at NAV +/- depending on load charges Prices may be quoted at premium or discount
on the exchange depending on perception
about fund’s future performance
Investors rights and Obligations: -Investors Rights
1. Proportionate right to beneficial ownership of scheme s assets
2. Right to obtain information from trustees
3. Entitled to receive divided warrants within 30 days of declaration of Dividend.
4. Inspect major documents of the funds
5. Appointment of the AMC can be terminated by 75% of the unit holders of the scheme
present & voting
6. Right to approve of changes in fundamental attributes of a close ended schemes so that
they can redeem
7. Receive Annual Reports & A/C Statements
Legal limitations to Investors Rights
1. Unit holders cannot use the Trust.
2. Can imitate legal proceeding against trustees.
3. Buyers beware.
4. Sponsor of Mutual Funds have no obligation to meet any shortfall in the assured return-
unless explicitly guaranteed in the offer document.
5. No rights to a prospective investor.
Minimum portfolio diversification
1. Equity schemes- single company under 10% of NAV, not applicable to index & sector
funds.
26
2. Debts funds- singleissuernot more than 15% of NAV, can be relaxed to 20% with approval
of trustees % AMC.
3. Unrated as well as rated but below investment grade, not more than 10% of NAV per
issuer.
4. All such issuers put together not more than 25% of NAV.
Investors Obligations
1. Carefully study the offer document before investing
2. Monitor his investment in a scheme by referring Financial statements, performance
updates & research report sent by the AMC
3. Complaints readdress
4. SEBI entertains complaints Required sponsor to appoint compliance officewho has to give
due diligencecertificate can remove AMC with 75% vote to this effect. No recourse to any
company law.
Offer Documents by Mutual Fund Houses
Contents of an offer document
 Summary information- at a glance
 Type of scheme growth / income / balanced
 Name of AMC
 Price of units
 If assured return-name of guarantor
 Opening & Closing dates of the schemes
 Disclaimer clause of SEBI
 Details of the sponsor & the AMC
 Description of the scheme & the investment philosophy
 Terms of issue
 Historical statistics
 Investors rights & services
 Abridged offer document/key information memorandum with application form.
Significance
 Legal document that protects and governs the right of the investor to information
 Is the primary vehicle for the investment decision?
27
 Is the operating document and describes the fundamental attributes of schemes?
 One of the most important sources of information for the prospective investor
 Is a reference document for the investor to look for relevant information at any time?
Mandatory Information
 Details of the Sponsor
 Description of the scheme and investment objective/strategy
 Terms of issue
 Historical statistics
 Investors Rights and Services
Key Information Memorandum that is distributed with the application form
is an abridged version of the offer documents.
Investment Options & Features
 Options
-Growth
-Dividend and Dividend Reinvestment
 Plans
-Systematic Investment Plan - SIP
-Value Averaging Plan - VAP
-Systematic Withdrawal Plan - SWP
-Systematic Transfer Plan - STP
 Other
-Nomination facility
Accounting for Mutual Fund
Balance Sheet of a Mutual Fund is different from that of a bank. All the Funds belong to the
investors & are held in fiduciary capacity for them.
 NAV: Investor s subscriptions are unit capital rather than deposits or liability.
 Investments made on behalf of investors are reflected on assets side
 There are liabilities but of strictly short term nature.
NAV= (Market value of investment + Receivables + Other Accrued income + Other
Assets) (Accrued Expense + Other Payables + Other Liabilities) / No: of Units Outstanding
as at NAV date.
28
 NAV of all schemes to be calculated & published daily. Close- Ended schemes that are not
mandatory required to be listed on Stock Exchange may declare NAV once in a month or
quarter as permitted by SEBI.
 Mutual Fund NAV is affected by four set of factors
-Purchase & sale of investment securities
-Valuation of all investment securities held
-Others assets & liabilities
-Units sold or redeemed
 Other assets include any income due to the fund but not actual received as on the
valuation date. Other liabilities include similar liabilities include similar liabilities. These
are to be accounted for on an accrual basis. Major expenses like Management fee to be
accrued on a daily basis. If non-accrual does not affect the NAV by more than 1% then it
may not be accrued for that valuation date.
 Non-recording of addition /sales of investments transaction or Sales/purchase of units
can be postponed to the next valuation date in case such non-recording is not impacting
the NAV by more than 2%.
 NAV = Net assets of scheme / No of units Outstanding
(I.e. Market value of investments+ Receivables+ Other accrued income+ Other assets- accrued
expenses- Other Payables- Other liabilities/No. of units outstanding as at the NAV date)
How is NAV Computed
 Market value of Equities - Rs.100 crores - Asset
 Market value of Debentures - Rs.50 crores - Asset
 Dividends Accrued - Rs.1 crore - Income
 Interest Accrued - Rs.2 crores - Income
 Ongoing Fee payable - Rs.0.5 crore - Liability
 Amount payable on shares purchased -Rs.4.5 crore - Liability
 No. of units held in the Fund: 10 crore units
NAV per unit = [(100+50+1+2) -(0.5+4.5)]/10
= [153-5]/10
= Rs. 14.80
NAV- Other Information
 Open end funds to declare NAV daily
 NAV to be published at least weekly
29
 Close end Schemes (which are not listed) may publish NAV monthly/quarterly with prior
approval from SEBI (MIP)
 NAV has to consider up to date transactions
 Non - recorded transactions not to affect NAV calculation by more than 2%
NAV is influenced by-
1. Purchase and sale of Investment
2. Valuation of Investment
3. Other assets and Liabilities
4. Units sold or redeemed.
Change in NAV-
For NAV Change in absolute term= (NAV at end of the Period-NAV at Beginning of Period)
*100/NAV at Beginning of Period
NAV Change in annualized terms= (NAV Change in %age in absolute terms) *365/No. of Days.
Loads-
 Entry Loads or Front Ended Load (Now Discontinued)
Paid at the time of Purchase.
Sale Price =NAV/1-Sales Load (if any)
 Exit Load or Back Ended Load
Paid at the time of Exit
Redemption Price =NAV/ (1+Exit Load)
 Contingent Deferred Sales Load
Deferred Exit Load depends on the Time Period
Also Known as Deferred Load
Sale Price
 Sale price is the price at which units are sold to the Investors.
 Sale Price =NAV +Entry Load
 Computation of Sale Price =NAV/(1-Load)
For Example: -
 Market value of Equities - Rs.100 crores - Asset
 Market value of Debentures - Rs.50 crores - Asset
30
 Dividends Accrued - Rs.1 crore - Income
 Interest Accrued - Rs.2 crores - Income
 Ongoing Fee payable - Rs.0.5 crore - Liability
 Amount payable on shares purchased -Rs.4.5 crore - Liability
 No. of units held in the Fund: 10 crore units
NAV per unit
= [(100+50+1+2) -(0.5+4.5)]/10
= [153-5]/10
= Rs. 14.80
Measuring and Evaluating Funds Performance
Necessary for Measuring Mutual Fund Performance
When an investing entrusts his saving to Mutual Fund naturally he hopes to increase wealth by
seeing the value of his investment grow. Having understood the conceptual & operation aspects
of Mutual Funds it is important to analyze the issues involved in the evaluation of Fund
performance.
The Investor Perspective: - The investor would naturally be interested in tracking through the
value of as investment whether invests directly in the markets or indirectly through Mutual
Funds. He would have to make intelligent decisions on whether he gets an acceptable return on
his investment in the funds selectedby him. Or ifhe needs to switch to another fund, he therefore
needs to understand the basis of appropriate performance measurement for the fund & acquire
the basic knowledge of the different measures of evaluating the performance well or not, &
make the right decisions.
The Adviser’s Perspective: - If you were an intermediary recommend A Mutual Fund to a
potential investor he would accept you to give him proper advice on which funds have a
performance track record. If you want to be an effective investment adviser, then you too have
to know how to measure & evaluate the performance of the different funds that are available to
the investor. The need to compare different fund’s performance required the advisor to have the
knowledge of the correct & appropriate measure of evolution the fund performance.
Performance Measures
 Peer Group Companies
 The Income Ratio Industry Exposure & Concentration NPA s
Assuming an Entry Load of 2% in
NAV Computation
Sale Price=14.80/ (1-0.02)
=15.10
31
 Besides NAV Growth
 Expenses Ratio
 Concepts of benchmarking for performance evolution
 Performance benchmarking in the Indian Contest
 Active Fund Performance against market indices as bench Mark
 Debt Fund-interest rate on alternative investment as bench Mark.
 Total Return Index
 Money Market Funds Short Term Govt. Instrument Interest rates as benchmarks.
 Tracking a fund’s performance Newspaper, Periodicals, Research, Annual Report,
Prospectus, Reports from Tracking agencies, Internet & Interpretation of Data.
Other Parameters
 Expense ratios - indicates fund efficiency and cost effectiveness
 Portfolio Turnover ratio - measures amount of buying and selling done by the fund
 Transaction cost
 Fund size
 Cash holdings
Working of Mutual Fund and their Performance
It needs to be certified that MF invest their funds in Capital market instruments such as Shares,
Debentures, Bonds, & Money Market Instruments & therefore the NAV of such investments will
reflect the market values of underlying assets. These
Market values fluctuate & therefore the NAV of the MF Schemes also fluctuate. All the capital
market instruments have varying degrees of risk, the Degree of risk being the highest in equities
& the risk factor is highlighted in the respective offer documents as well as in the abridged offer
documents.
The investors therefore are in the full knowledge & understanding of the risks involved in various
schemes. As per SEBI Regulation all MF disclose their portfolio periodically & all open-ended
Funds offer exit option to investors at NAV based price.
Risk, Tolerance,
Return Expected Focus
Suitable Products Benefits Offered
by Mutual Fund
Low Debt Bank/Company
FD, Debt Funds
Liquidity, Better
Post-Tax Return
32
Medium Partially Debt,
Partially Equity
Diversified Funds
Balanced Funds,
FD’s, Shares, etc.
Liquidity, Better
Management
Diversification
High Equity Equity Funds
(Sector as well as
Diversified)
Diversification,
Expertise in Stock
Picking, Liquidity
Tax Free Dividend
The Risk Return Tradeoff
Introduction to Bond Fund
Bond market which is also known as debt market or credit market is a financial market where
participant can issue new debt known as primary market or buy and sell debt securities known
as secondary market. This is usually in the form of bonds but it may include notes, bills, etc. and
the primary goal of the bond market is to provide funding for public and private Expenditures.
The various types of bond Markets includes corporates, Government Agency, Municipal,
Mortgage backed, Asset backed and Funding.
The participant of the bond market is considered to be very similar to the participants in most of
the financial market and are either buyers of the funds or the sellers of the funds and often both
the participants include Institutional Investors, Government, Traders, Individual.
Just becausethe specificityof individual bond issueand the lackof liquidity in many smaller issue,
the majority of outstanding bonds are held by the institutions like pension fund, Banks and
Mutual Funds.
Ris
k
Potentialfor
Return
Debt Funds
Hedge
Funds
Growth
Funds
Sectoral
funds
Balanced
Funds
Liquid
Funds
33
Indian Debt Market as on April 29, 2016
Security Type No. of Securities Market Capitalization(Cr) % of Total
Government Securities 113 26825814.81 45.15
PSU Bonds 1105 4984682.3 8.39
State Loans 1965 15554381.14 26.18
Treasury bills 49 3580939.34 6.03
Local bodies 17 29750 0.05
Financial Institutions 208 997859.23 1.68
Bank Bonds 559 2990407.87 5.03
Corporate bonds 3140 4441718.86 7.48
Supranational Bonds 10 4997.44 0.01
Mutual Funds 6 7502 0.01
Preference shares 1 1250 0
Debt Market Review for the Month till April, 2016
In comparison to the last year Data It has been noticed that there has been seen a huge increase
(49.45%) in the issue size of Supra Institutional Bonds (A supra institutional Entity is formed by
two or more central Governments with the purpose of promoting Economic development for the
member Countries and those institutions finance their activities by issuing supra Institutional
Bonds) Because of the tie ups with other Countries for the economic Growth.
The Corporate Debt has also got increased by 21.34% which shows that the investors are
increasing their investment in the “CORPORATIONS”. Also there has been slight decrease in the
Government bonds (-7.85%) which has happened due to the change in the interest rates by the
Reserve Bank of India. Also there has been increase in the investment in the state Government
Government
Securities
45%
PSU Bonds
8%
State Loans
26%
Treasury bills
6%
Local bodies
0%
Financial
Institutions
2%
Bank Bonds
5%
Corporate bonds
8%
Supranational Bonds
0%
Preference shares
0%
Market Share of DifferentSecurities
Government Securities
PSU Bonds
State Loans
Treasury bills
Local bodies
Financial Institutions
Bank Bonds
Corporate bonds
Supranational Bonds
34
Bonds (20.09%) which will happen only if the return is high or Fresh issue of Securities has been
made by the Government.
About Kotak Bond Fund
Kotak Bond is an open ended debt scheme which was launched on 25th November 1999, with an
investment objective to create a portfolio of debt and money market instruments of different
maturities so as to spread the risk across a wide maturity horizon and different kinds of issuers
in the debt market. The investment objective of the Kotak Bond Fund is to create a portfolio of
Debt and money market instrument of different Maturities so as to spread the risk across a wide
maturity horizon and different kind of issuers in the debt market. The scheme offers a play on
interests rates by managing duration actively. Duration is increased if the view is that of falling
interests rates and vice-versa. The scheme also seeks to provide stable returns in the long term
by managing credit risk actively. The Portfolio is well diversified with a mix of good credit quality
debentures, bonds and government securities. It is suitable for investors who seek the high
accrual offered by long term Papers, have a view on interest rates and have a long term
Investment horizon.
Fund Overview
Kotak Bond fund has been ranked 3rd in debt long term by CRISIL for the quarter ended March,
2016. This Fund is an open ended debt scheme which was launched on November 25th,1999 with
the aim to create a portfolio of debt and the money market instruments. This fund is suitable for
the investor who are seeking income over a long investment horizon and investment in debt and
money market securities. This scheme is being managed by Mr. Abhishek Bisen. He is also
managing other debt schemes such as Kotak Balance Fund (April 15, 2008); Kotak Monthly
Income Plan (April 15, 2008); Kotak Bond (Plan A) (April 15, 2008); Kotak Gilt Investment (Regular
and PF Trust) (April 15, 2008); Kotak Global Emerging Market Fund (April 15, 2008); Kotak Multi
Asset Allocation Fund (January 21, 2011); Kotak Equity Savings Fund (October 13, 2014); Kotak
Gold ETF (July 27, 2007); Kotak Gold Fund (March 25, 2011).
The Asset Under Management of Kotak bond Fund as on April 30th, 2016 is Rs. 4164.57 Crores
and the AAUM as on April 30th, 2016 is RS. 4294.17 Crores. The benchmark for this scheme is
“CRISIL COMPOSITE BOND FUND INDEX”. There is no Entry or the Exit Load for this fund but the
units issued on the Reinvestment of dividend shall not be subject to Exit Load. The minimum
investment for his plan is Rs. 5000 and the Additional Investment of Rs. 1000 in multiples of Re.1.
The Standard deviation for this scheme is 4.38% which shows that the risk is moderate in this
scheme and make this scheme less risky as compared to other debt Scheme Provided by Kotak
Mahindra Asset Management Company Limited. Coming to the yield on Maturity, The YTM of
this scheme is 8.09%. The Portfolio Modified duration for this scheme is 8.19 years and Average
35
Maturity is 16.17 Years which means that the securities which the company is holding has average
maturity time of 16.17 Years.
Investment Objective
The Investment aims to create a portfolio of debt instrument of different maturities so as to
spread the risk across a wide maturity horizon and different kind of issuers in the debt market.
The wholesale plan is targeted at big ticket investors and corporates.
Investment Strategy
In the figure, Matrix shows the risk associated with the scheme and the tenure of the scheme
after which the maturity will arrive.
Kotak Bond fund comprises of the
mixture of all the debt instruments
available in the debt market as it is
considered to be the debt fund with
high standard deviation which
carries low risk. Investors prefer
debt funds because: -
1. No TDS on Debt Fund
Earnings
2. Returns are associated with the markets
3. SWP, SIP, STP instead of Lump Sum
4. Look out for lower Expense ratio payment
5. Consider Exit Load
0.2
4.7 4.4
7.2
9.4
6.3
9.1
0.4
3
3.6
6.6
8.6
6.2 6.5
0
2
4
6
8
10
1 Month 3 Month 6 Month 1 Year 2 year 3 Year 5 year
Fund Return vs Category average (Debt long Term)
Fund return Category Avg.
36
Kotak bond fund comprises of the various debt fund such as debt instruments, Debentures and
bonds, Corporate Debt/Financial Institutions, PSU’s, Government dated Securities, Commercial
Papers/Certificate of Deposits.
On an average more than 80% of the allocation of the funds is done using Government securities
which carries a fixed amount of interest and these are the long term papers with a maturity
period of 15-20 years. Next comes the Debentures, CP’s, CD’s and bonds which account for 13%-
15% of the portfolio. Then comes the term deposits, reverse repo and Net Current Assets which
accounts for the rest of the investment in the Portfolio.
Asset Allocation
The major part of assets is being allocated in the Debt securities which account for nearly 97% of
assets (April 2015 -April 2016) and other assets account for 3% of the allocation.
Top 5 instruments of Kotak Bond Plan
Instrument % Allocation Valuation (INR Crores)
GOI Securities 54.29% 2651.17
Central Government loan 14.34% 700.27
State Development loan 13.03% 636.30
Non-Convertible Debenture 7.83% 382.37
Debenture 4.24% 207.05
The allocation of the debt fund consists of Government securities which account for more than
50% of share in the Portfolio just because it is considered to be the safest security in the money
market because of the nature suchas the holder willbe exempted from tax and all.Second comes
Scheme Facts
Launch Date 25-Nov-1999
Structure An Open Ended Debt Scheme
Benchmark CRISIL Composite Bond Fund Index
Minimum initial investment Rs.5000 and in multiple of 1 for purchase and .01 for switches
Additional Investment Rs.1000 and in multiples of Rs. 1
Standard Deviation 4.11%(as on June 30, 2015) Source: Value Research
YTM 8.29%
Portfolio Modified Duration 8.29 Years
Average Maturity 17.97 Years
37
the central government loan and State Development Loan who raise the capital from the market
by issuing the commercial papers and Certificate of deposits and giving them a fixed amount of
interest on such instruments
Scheme Return vs. Benchmark Return
November 25, 1999 (since inception)
Here, Kotak Bond fund since its inception (25th November 1999) has given positive and higher
YTM (Yield to Maturity) when compared to the benchmark (CRISIL Composite Bond Fund) and
the additional benchmark (CRISIL 10-year Gilt). During the period “March 31st, 2013 to March
31st, 2014”, CRISIL 10 Years Gilt has shown a negative return of (0.96%) but here despite of
negative return shown by the benchmark, Kotak bond has shown a positive YTM of 1.71% which
shows that fund and Fund Manager is doing wellkeeping in mind the market Performance. During
the year 2015-2016 due to change in the interest rates by the federal reserves, the performance
has gone down and Kotak has underperformed in comparison to the benchmark and additional
benchmark because maximum allocation of the securities in this scheme is done in the
government securities and Government debentures and bonds. So, the change in the interest
rates has affected the performance and YTM has come down when the return has been
compared to its benchmark. But during the next Financial year, Kotak Bond Fund has
outperformed with his benchmark and additional Benchmark because of the changes in the
allocation of the securities by the fund Managers in the existing portfolio of the scheme.
Return Analysis
9.18
5.32
15.87
1.71
0
8.24
14.59
4.39
0
7.97
14.57
-0.96-2
0
2
4
6
8
10
12
14
16
18
25-Nov-99 Mar 31, 2015 to 2016 Mar 31, 2014 to 2015 Mar 31, 2013 to 2014
Scheme vs Benchmark
Scheme Returns crisil Composite bond fund crisil 10 year gilt
11.065675 11.065675
10.9851
38
10.681175
11.065675
10.9851
11.08854
FY 2011-2012 FY 2012-2013 FY 2013-2014 FY 2014-2015
Quarterly Dividend Linear (Quarterly Dividend)
11.065675
10.9851
11.08854
10.9496
FY 2012-2013 Fy 2013-2014 FY 2014-2015 FY 2015-2016
Quarterly Dividend Linear (Quarterly Dividend)
Quarterly Dividend during each Financial Year
39
The above graphs show the Average quarterly dividend provided to the investors during each
financial year of Kotak Bond Fund. The data shows the increase in the amount of dividend
provided by the scheme year on year. The straight line depicts the rise in the dividend yield by
the fund and the half straight line depicts the standard deviation which means the standard error
taking place will lie on that half straight line. If the dividend lies below or above the line, then it
will be called the abnormal return provided by the scheme.
Here, during the financial year 2010-201, the scheme has given an abnormal return on the
investment made by the investors that is Rs. 10.49055 which lies below the line of standard
deviation (also known as standard error line).
Again, during the financial year 2014-2015, the scheme has given an abnormal return of Rs.
11.08854 which lies above the standard error line. Also during the financialyear 2012-2013 Kotak
Bond fund has given abnormal return, that is return more than average.
So, here the conclusion derived is that an average return by the scheme helps the industry to
grow and manage the assets in a better way.
10.843975
10.49055
10.681175
11.065675
10.9851
11.08854
10.9496
FY 2009-
2010
FY 2010-
2011
FY 2011-
2012
FY 2012-
2013
FY 2013-
2014
FY 2014-
2015
FY 2015-
2016
Return (Dividend) 2009-2016 Linear (Return (Dividend) 2009-2016)
40
7% 3%
86%
1%3%
PortfolioComposition as on March 30th, 2015
Corporate Debt/Financial
Institutions
Public Sector Undertakings
Government Dated securities
Collateral borrowings and Lending
Obligations
Net Current Assets/Liabilities
Portfolio Action as on June 30th, 2015
Portfolio Action as on 30th June 2015
 Bond scheme works on an asset allocation model of 70:30 where Fund Managers take
active duration call through Gilt Investment. The Balance is invested in corporate bonds
segment in order to provide yield cushion to guard the fund against the volatilities.
 As the long bond yield also rose during the month of June, they increased the weight on
30 years SOA Bonds marginally maintaining the gilt exposure at around 83% and the
balance continues in the bond. Consequently, the duration also went to 17.97 Years,
Modified duration 8.29 Years and the YTM of 8.29%
 They continue to stay overweight in 14-30 Years segment in gilts and 7-10 Years in the
corporate bonds. They believe that these are the optimal points on the yield curve.
Top 10 Companies as on June 30th, 2015
8.30% Central Government SOV 29.12%
8.17% Central Government SOV 11.55%
9.20% Central Government SOV 11.19%
8.15% Central government SOV 9.21%
8.24% Central Government SOV 6.50%
8.28% Central Government SOV 5.88%
1.44% Central Government SOV 3.75%
7.95% Central Government SOV 3.41%
HPCL Mittal Energy Limited ICRA AA- 2.84%
7.88% Central Government SOV 2.61%
41
The fund is suitablefor the investors who seeks the high accrual offered by long term debt
securities. It is also viable for those who have a view on the interest rates and have an
investment horizon of 12 months and above.
Quarterly AAUM and NAV
(For the month of April 2015 – June 2015)
Deposit Plan: Rs. 68.29 Crores
Plan A: Rs. 4048.45 Crores
Direct Plan: Rs. 1027.44Crores
Quarterly Dividend: Rs. 10.6616
Quarterly Dividend direct: Rs. 11.2360
Half yearly Dividend Direct: Rs. 40.0962
Annual Dividend: Rs. 24.1540
Annual Dividend direct: Rs. 20.9515
Plan A bonus plan: Rs. 26.2802
Growth: Rs. 39.425
Growth Direct: Rs. 40.0962
42
Portfolio Action as on September 30th, 2015
 Bond scheme works on asset allocation model of 70:30 where Fund Managers take active
duration call through Gilt investment. The balance is invested in corporate bond segment
in order to provide yield cushion to guard the fund against the volatilities.
 The month of September was full with suspense and volatilities but the difference was
this time yields fell sharply on the back of favorable FOMC and 50bps repo rate cut which
was more than expected and RBI kept the room for more cuts open. However, since our
portfolio was being made with this kind of outcome for a long period of time, however
they increased the duration marginally much during this month. Consequently, the
duration also went to 17.88 years, Modified duration 8.50 and YTM of 7.92%.
 They continue to stay overweight in the 14-30 years’ segment in Gilt and 7-10 years in the
corporate bonds. We believe that these are the optimal points on the yield curve.
 Due to 50bps cut in the repo rate by RBI the value of the existing paper in the market has
gone up, which is the reason giving extra weight to the Government securities in the
portfolio.
5%3%
88%
3%1%
PortfolioComposition as on September 30th,
2015
Corporate Debt/Financial
Institutions
Public Sector Undertakings
Government Dated securities
Collateral borrowings and Lending
Obligations
Net Current Assets/Liabilities
43
Deposit Plan: Rs. 62.71 Crores
Plan A: Rs. 3963.05 Crores
Direct Plan: Rs. 1100.15Crores
Quarterly Dividend: Rs. 10.9396
Quarterly Dividend direct: Rs. 11.5315
Half yearly Dividend Direct: N/A
Annual Dividend: Rs. 25.2363
Annual Dividend direct: Rs. 21.9328
Plan A bonus-plan A: Rs. 27.4578
Growth Plan A: Rs. 41.1911
Growth Direct Plan A: Rs. 41.9743
Top 10 Companies as on September 30th, 2015
7.88% Central Government SOV 29.12%
8.30% Central Government SOV 11.55%
8.24% Central Government SOV 11.19%
8.17% Central government SOV 9.21%
9.20% Central Government SOV 6.50%
1.44% Central Government SOV 5.88%
8.13% Central Government SOV 3.75%
HPCL Mittal Pipeline Limited ICRA AA- 3.41%
HPCL Mittal Energy Limited ICRA AA- 2.84%
Bank of India Brickwork BWR AA+ 2.61%
Quarterly AAUM and NAV
(For the month of June 2015 – September 2015)
44
Portfolio Action as on December 31st, 2015
 Bond scheme works on assetallocationmodel of 70:30, where Fund Managers take active
call through Gilt investment. The balance is invested in corporate bonds segment in order
to provide yeild cushion to protect the fund against the volatilities.
 The month of december was a volatilemonth and market was grappling with concerns on
fiscal slippage and power bonds the 10 year G-secs yeild remain flat month on month
while the less than 10 years yeild came down and more than 10 years went up. However,
since our portfolio was overweight on the long bonds it was hurt adversly.
 They reduce the risk from the portfolio it was in time probably we should have been more
aggressive but we believe that that as absolute levels are high and therefore it’s a risky
bet to stay out given such a strong macro.
 We were able to sell in time but believe we covered it too soon.
 We took the Average maturity duration down to 14.65 years, modified duration 7.25
years and YTM of 8.12%
Top 10 Companies as on December 31st, 2015
7.73% Central Government SOV 29.12%
8.24% Central Government SOV 11.55%
8.17% Central Government SOV 11.19%
4%2%
78%
8%
8%
PortfolioComposition as on December 31st,
2015
Corporate Debt/Financial
Institutions
Public Sector Undertakings
Government Dated securities
Collateral borrowings and Lending
Obligations
Net Current Assets/Liabilities
45
7.59% Central government SOV 9.21%
7.78% Central Government SOV 6.50%
1.44% Central Government SOV 5.88%
HPCL Mittal Energy limited SOV 3.75%
Bank of India ICRA AA- 3.41%
8.13% Central Government ICRA AA- 2.84%
8.83% Central Government Brickwork BWR AA+ 2.61%
Quarterly AAUM and NAV
(For the month of September 2015 – December 2015)
Plan A: Rs. 5053.53 Crores
Direct Plan: Rs. 5076.33 Crores
Quarterly Dividend Plan A: Rs. 10.8203
Quarterly Dividend Direct Plan A: Rs. 11.4092
Annual Dividend Plan A: Rs. 24.9920
Annual Dividend Direct Plan A: Rs. 21.7654
Bonus Plan - Plan A: Rs. 21.9328
Growth - plan A: Rs. 27.4578
Growth Direct Plan A: Rs. 41.6535
46
Portfolio Action as on March 31st, 2015
 Bond scheme works on an asset allocation model of 90:10, where Fund managers take
active duration call through gilt investment and the balance is invested in corporate bond
segment.
 This is done in order to provide yield cushion to protect the fund against the volatilities
while also position the funds to capture duration-related gains. We increase our
allocation to G-sec to take advantage of market sell off as we believe that negatives are
priced in.
 The month of march begin with bullish tone and sustained due to series of events which
occurred during the month and led to marvelous rally in the G-sec and bond market.
 The curve entered in a bull flattening mode in 10-30 years’ segment as we were
anticipating and were positioned to gain therefore we booked some profit ahead of
monetary policy and switched in SDL to the tune of 20% of the scheme that not only gave
profits but also increase YTM of the fund.
 They took at the SDL at 75 bps spread over G-sec and we expect it to compress to 50 bps.
This activity led to reduction in duration of the fund.
 The fund duration is at 13.43 years, Modified Duration 6.85 Years, and YTM of 8.26%.
13%
10%
66%
0%-5%4%1%1%
PortfolioComposition as on March 31st, 2016
Corporate Debt/Financial
Institutions
Public Sector Undertakings
Government Dated securities
Collateral borrowings and Lending
Obligations
Net Current Assets/Liabilities
Futures
Reverse Repo
47
Quarterly Dividend Plan A: Rs. 11.0420
Quarterly Dividend Direct Plan A: Rs. 11.6430
Annual Dividend Plan A: Rs. 25.7611
Annual Dividend Direct Plan A: Rs. 21.6871
Bonus Plan - Plan A: Rs. 28.0284
Growth - plan A: Rs. 42.0471
Growth Direct Plan A: Rs. 43.0226
Top 10 Companies as on March 31st, 2015
7.73% Central Government SOV 33.37%
8.17% Central Government SOV 9.80%
8.24% Central Government SOV 9.70%
Bharti Enterprises (Holding) Pvt. Ltd. Crisil A1+ 7.59%
8.50% State Government SOV 4.78%
Bank of Maharashtra Crisil A1+ 3.73%
8.45% State Government SOV 2.83%
8.22% State Government SOV 2.61%
8.65% State Government SOV 2.61%
8.62% State Government SOV 2.39%
Quarterly AAUM and NAV
(For the month of December 2015 – March 2016)
48
Monthly Dividend for the Financial Year 2015-2016
The above graph shows the monthly dividend received by the individual investors and the other
investors (other investors includes the indirect clients, HUF’s, etc.) The linear dividend per unit is
following the downtrend and is decreasing slowly and steadily, But Because the dividend is lying
within the standard error bar, there is a low probability that the investors will pull off their
investments because of the very low risk associated by the debt fund and that too the dividend
is lying within the standard error. The other investors are considered to be the indirect clients
who use to make their investment with the help of any other individual such as IFA’s
(Independent Financial Advisor), ND’s (National Distributors), etc. and the person use to take a
certain amount of commission to service them. This is the main reason why direct dividend use
to be higher than indirect dividend.
5.1822
2.923
3.8653
6.2894
7.2844
4.5169
1.4333
5.705
2.4429
4.4278
4.8012
2.7081
3.5811
5.827
6.7489
4.1848
1.3279
5.2856
2.2633
4.1023
Individual (Per unit) Others (Per unit) Linear (Individual (Per unit))
Dividend for the month of September and October has not been Declared
49
Glossary
 Asset Allocation Fund- A Fund that spreads its portfolio among a wide variety of
investments, including domestic & foreign Stocks & Bonds some of these funds keep the
proportions allocatedbetween different Sectors relativelyconstant, while others alter the
mix to market conditions.
 Adjusted NAV- The Net Asset Value of a unit adjusting for all changes caused due to
divided declaration, bonus, etc. assuming reinvestment of distributions made to the
investors at the prevailing NAV.
 AlphaCo-efficient-It is the excess return of fund above risk adjusted market return, given
its level of risk as measured by Beta. An Investment with a positive indicates that the fund
has underperformed, for the level of risk taken by it.
 Annual Report- It is yearly record of a MF Performance in a Current Year. Under SEBI s
guidelines, it is distributed to investors &/or Share Holders.
 Asset Allocation- It is a means of diversifying the risk associated with a Fund & refers to
the distribution of total funds available with the fund into instruments of various types
such as Stocks, Bonds etc. based on the Fund’s investments objectives.
 Asset-Backed Securities- Securities that represent a participation in, or are secured by &
payable from, payments generated by Credit Cards, Motor Vehicle or trade receivables &
the like.
 Asset Mgmt. Company (AMC)- It is the Investment Manager for a MF. It is a Company set
up primarily for managing the investment of MF & makes investment decisions in
accordance with the Schemes Objectives, deed of Trust & Other provisions of the
Investment Mgmt. Agreement.
 Automatic Investment Plan- A Plan introduced in MF that enables the Investor to give
the mandate of allotting fresh units at specified intervals (Monthly, Quarterly) against
which the investor provide postdated Cheque On the specified dates, the Cheque are
realized by the MF & on realization Additional Units are allotted to the investor at the
prevailing NAV.
 Balanced Funds- A Class of MF that aims at allocating the total assets with it in the
portfolio mix of debt as well as equity instruments.
 Basis Point- Most often used relating to changes in interest rates. One Basis Point in 1/
100 of a percentage point; therefore 1000 Basis Points make 1%. A phrase used to
describe the difference in Bond Yields. Ex. If Bond a Yields 7.5 & Bond B Yields 7.25. Then
the difference is 0.25 is a Basis Point.
 Benchmark- It is the platform or the parameter with which a scheme can be compared.
For e.g. the performance of anindex fund canBenchmarked againstthe appropriate index
specified by it.
50
 Beta - It is the measure of a Relative Sensitivity of a Stock or MF to a Market. The market
is assigned an of 1. The higher the, more sensitive the Stock or fund is considered to be
Relative to the market as a whole. In other words, funds with more than 1 will react more
to any fluctuations (whether upward or downward) in Market than funds with B less than
1.
 Bond Fund- A MF whose portfolio consists primarily of corporate, Municipal or Govt.
Bonds. These funds generally emphasize income rather than growth.
 Capital Appreciation Fund- A MF that seeks maximum Capital Appreciation by investing
in Companies that do not pay dividends. These Funds may use techniques involving
greater than ordinary risk, such as borrowing money in order to provide leverage, short
selling & high portfolio turnover.
 Consumer Price Index (CPI)- An inflation tracker, much followed by the mainstream
media. It is the measure of the price change in consumer goods & services.
 Contingent Deferred Sales Charge (CDSC)- It is the sales load charged by funds in the
event of redemption made within a pre-specified period of purchase.
 Cut off Time- In respect of all MF regulated by SEBI, fresh subscriptions & redemptions
are processed at a particular NAV. Every fund specifies a cut off time in respect of fresh
subscription & redemption of units. All requests received before the cut off times are
processed at that day s NAV & thereafter at the next day s NAV.
 Cyclical Stock- Stock of a company whose performance is generally related (or thought to
be related) to the performance of an economy as a whole. Paper, steel & the automotive
stocks are thought to be Cyclical because their earnings tend to be hurt when the
economy slows & are strong when the economy turns up. Food & Drug Stocks, on the
other hand, are not considered Cyclical, as consumers pretty much need to eat & care for
their Health regardless of the performance of the economy.
 Derivative- A Financial Contract whose value is derived from another underlying asset,
such as Stocks,Bonds, Commodities, or a Market Index such as NSE 5O.The most common
type of Derivatives is option, future & mortgage-backed Securities.
 Diversification- Spreading a risk; MF spread investments among a No. of different
Securities to reduce the risk inherent in investing.
 Dividend Distribution Tax - A Tax payable by a debt oriented MF (a MF that invests more
than 50% of its portfolio in a debt Market) before Dividend is distributed to the unit
Holders. The Current Dividend Distribution Tax is 10% plus the 10% surcharge. There is no
such Tax Applicable on Open-End Equity Schemes.
 Duration- A Calculation of the Average Life of a Bond (or Portfolio of Bonds) i.e. a useful
measures of a Bond s Price Sensitivity to interest rate changes. The higher duration No.
the greater the risk & reward potential of the Bond.
51
 Dollar- Cost Averaging- The Technique of investing a fixed sum at a regular intervals
regardless of Stock Market movements. This reduces average Share Cost to the investor,
who acquires more Shares in period of lower Security prices & fewer Shares in period of
High prices. In this way, investment risk is spread overtime.
 Entry Load - It is the Load Charged by Fund when one invests into other Fund. It increases
the price of units to more than the NAV & is expressed as a percentage of NAV.
 Equity Linked Savings Scheme (ELSS)- A special product offered by MF. These Schemes
invest in equity i.e. Shares & generally have a lock-in period of 3 Yrs. The basic features of
ELSS Schemes are: Taxrebate of 20% under Section 88 of the Income Tax Act on an (Maxi.)
investment of Rs.10, 000/.
 Exit Load - It is the load charged by the Fund, when one redeems the unit from the Fund.
It reduces the price of the units to less than the NAV & is expressed as a % of NAV.
 Exchange Traded Funds- Exchange traded funds are a hybrid of MF & Stock which track
an underlying index. These funds have the flexibility of Trading throughout the day like a
Security & also offers benefits like Diversification Professional Mgmt., low expense ratio,
etc.
 Fixed Income Securities-Bonds & other securities that are used by issuers to borrow
money from investors. Typically, the issuer pays the investor a fixed, variable or floating
rate of interest must repay the borrowed amount at a specified time in the future
(Maturity).
 Fund Manager- Appointed by the AMC, he/she is the person who makes all the Final
Decisions regarding investments of a Scheme.
 Govt. Securities These are medium to long-term obligations issued by RBI on behalf of
Govt. of India& various State Govt. The RBI decides the cut-off coupon on the basis of the
bids received. These Securities are issued by auction process on certain issues.
 Gilt Funds- Funds that invest only in Govt. Securities of different Mature They offer lower
returns as the credit risk is virtually absent & there are No chances of Govt. defaulting on
its payment obligations.
 Growth Style Investing- An investing approach that involves buying Stocks of Companies
i.e. generally industry leaders with above average, sustainable growth rates. Typically,
Growth Stocks are the Stocks of the fastest growing Companies in the most rapidly
growing sector of the Economy Growth Stock valuation level (e.g.Price-to-earnings Ratio)
will generally be higher than value Stocks.
 Indexation - The Central Govt. specifies an index linked to the wholesale Price Index. The
indices of 2 yrs. (Yrs. Of purchase & the yr. of sale) are used for the purpose Price is
multiplied by the Index of the yr. of purpose.
52
 Large- Cap Stocks- Stocks issued by large companies. Unless otherwise defined by Fund
Manager or an Advisor, a Large-Cap Company is defined as one with a Market
Capitalization of $5 Billion or more. Typically, large -cap companies are est. well-known
Companies; some may be MNC s.
 Mid-cap Stocks- Stocks issued by mid-sized companies, unless otherwise defined by a
Fund Manager or the Advisor, a mid-cap company is defined as one with a Market
Capitalization between $1.5 Billion & $5 Billion, this is similar to the range of the Std. &
poor Mid-Cap 400 Index (S&P 400).
 Money Market-It refer to Market for very Short- Term Securities. Money Market
instruments are forms of Debt that mature in less than a yr. & are very liquid in nature.
Securities such as Treasury bill & call Money makes up the Bulk of trading in Money
Market.
 Money Market Instruments- Treasury bill, GOI Securities Etc. with an unexpired Maturity
less than or up to one yr. Call Money, Certificates of Deposits & any other instrument
specified by the RBI.
 Mortgage Backed Securities- Certificate backed by pooled Mortgages (e.g. Freddie Mac
or Gennie Mae). Issuing agencies buy Mortgages from lending institutions & repackage
them as Securities which they sell to investors. Yields, which stem from interest &
principal on underlying.
 Open-Ended Fund - Funds that do not have any fixed Maturity & are continuously open
for subscription & redemption. The key features are Liquidity. One can convenient Buy &
Sell the units held at NAV Price.
 Statement of Additional Information (SAI) - It conveys information about an open
/closed-end fund that is not necessarily needed by investors to make informed
investment decision.
 Yield to Maturity- Used to determine the Rate of Return on Investor such as a Bond is
held to its Maturity date, takes into account purchase price, redemption value, time to
Maturity, coupon yield & a time between Interest Payments.
 Zero Coupon Bond- A Bond where no Periodic Interest payments are made. The Investor
purchase the Bond at a discount price & receives one payment at Maturity. The Maturity
value an Investor receives is equal to the Principal invested plus Interest earned
Compound Semi-Annually at the Income from Zero-Coupon on Bonds is subject to Taxes
annually even though no payments will be made.
53
Bibliography
 NISM Work Book
 EconomicTimes
 Kotak AMC Fact Sheet
 Kotak AMC OnePagers
 NSE Manuals
 ComplaintRedressalreport
Websites: -
 www.mutualfundindia.com
 www.amfindia.com
 www.moneycontrol.com
 www.assetmanagement.kotak.com
 www.valueresearchonline.com
 www.investopedia.com
 www.rediff.com
 www.articles.economictimes.indiatimes.com
 www.thehindubusinessline.com
 www.capitalmarket.com
 www.fintotal.com
 www.fundsupermart.co.in
 www.nseindia.com
 www.morningstar.in
 www.icra.in
 www.investmentguruindia.com
 www.business-standard.com
 www.managementparadise.com

Weitere ähnliche Inhalte

Was ist angesagt?

Comparative analysis on investment in mutual fund
Comparative analysis on investment in mutual fundComparative analysis on investment in mutual fund
Comparative analysis on investment in mutual fund
vaibhav belkhude
 
A project report on awareness of mutual funds 1
A project report on awareness of mutual funds 1A project report on awareness of mutual funds 1
A project report on awareness of mutual funds 1
Nirali Nayi
 
comparative Analysis of mutual fund
comparative Analysis of mutual fundcomparative Analysis of mutual fund
comparative Analysis of mutual fund
Parneet Walia
 
Project Report On Mutual fund
Project Report On Mutual fund Project Report On Mutual fund
Project Report On Mutual fund
Amit Dazz
 

Was ist angesagt? (20)

Comparative analysis on investment in mutual fund
Comparative analysis on investment in mutual fundComparative analysis on investment in mutual fund
Comparative analysis on investment in mutual fund
 
Comparitive study of_mutual_fund
Comparitive study of_mutual_fundComparitive study of_mutual_fund
Comparitive study of_mutual_fund
 
A project report on awareness regarding mutual fund with special reference to...
A project report on awareness regarding mutual fund with special reference to...A project report on awareness regarding mutual fund with special reference to...
A project report on awareness regarding mutual fund with special reference to...
 
Performance and Analysis of Mutual Funds in India
Performance and Analysis of Mutual Funds in IndiaPerformance and Analysis of Mutual Funds in India
Performance and Analysis of Mutual Funds in India
 
NJ India Invest Pvt.Ltd
NJ India Invest Pvt.LtdNJ India Invest Pvt.Ltd
NJ India Invest Pvt.Ltd
 
A project report on awareness of mutual funds 1
A project report on awareness of mutual funds 1A project report on awareness of mutual funds 1
A project report on awareness of mutual funds 1
 
sbi mutual fund
sbi mutual fundsbi mutual fund
sbi mutual fund
 
comparative Analysis of mutual fund
comparative Analysis of mutual fundcomparative Analysis of mutual fund
comparative Analysis of mutual fund
 
Study on Mutual fund in India
Study on Mutual fund in IndiaStudy on Mutual fund in India
Study on Mutual fund in India
 
Rahul Gupta MBA Finance IVth SEMESTER Project
Rahul Gupta MBA Finance IVth SEMESTER ProjectRahul Gupta MBA Finance IVth SEMESTER Project
Rahul Gupta MBA Finance IVth SEMESTER Project
 
Comparative study of mutual funds in india
Comparative study of mutual funds in india Comparative study of mutual funds in india
Comparative study of mutual funds in india
 
A project report on comparative study of mutual funds in india
A project report on comparative study of mutual funds in indiaA project report on comparative study of mutual funds in india
A project report on comparative study of mutual funds in india
 
A Study of Mutual Funds in India- Report
A Study of Mutual Funds in India- ReportA Study of Mutual Funds in India- Report
A Study of Mutual Funds in India- Report
 
Project on mutual funds study and survey
Project on mutual funds study and surveyProject on mutual funds study and survey
Project on mutual funds study and survey
 
Mutual fund project sbi mutual funds
Mutual fund project  sbi mutual fundsMutual fund project  sbi mutual funds
Mutual fund project sbi mutual funds
 
Comparative Analysis On Mutual Fund Scheme
Comparative Analysis On Mutual Fund SchemeComparative Analysis On Mutual Fund Scheme
Comparative Analysis On Mutual Fund Scheme
 
Study of Mutual Fund Investment
Study of Mutual Fund InvestmentStudy of Mutual Fund Investment
Study of Mutual Fund Investment
 
Project Report On Mutual fund
Project Report On Mutual fund Project Report On Mutual fund
Project Report On Mutual fund
 
A study on investors’ awareness level on mutual fund & promotion of sip plan
A study on investors’ awareness level on mutual fund & promotion of sip planA study on investors’ awareness level on mutual fund & promotion of sip plan
A study on investors’ awareness level on mutual fund & promotion of sip plan
 
A PERFORMANCE EVALUATION OF MUTUAL FUND
A PERFORMANCE EVALUATION OF MUTUAL FUND A PERFORMANCE EVALUATION OF MUTUAL FUND
A PERFORMANCE EVALUATION OF MUTUAL FUND
 

Andere mochten auch

A comparative study on direct equity investing and mutual fund investing
A comparative study on direct equity investing and mutual fund investingA comparative study on direct equity investing and mutual fund investing
A comparative study on direct equity investing and mutual fund investing
Akash Jeevan
 
Project report-mbahotspot
Project report-mbahotspotProject report-mbahotspot
Project report-mbahotspot
nikith naresh
 
30838403 comparative-analysis-of-mutual-funds
30838403 comparative-analysis-of-mutual-funds30838403 comparative-analysis-of-mutual-funds
30838403 comparative-analysis-of-mutual-funds
Nagesh Halgonde
 
FT Quant presentation eng
FT Quant presentation engFT Quant presentation eng
FT Quant presentation eng
Luka Gubo
 
report on kotak mutual fund
report on kotak mutual fundreport on kotak mutual fund
report on kotak mutual fund
hiten1986
 
Differences in Venture Capital Financing of U.S., UK, German and French IT St...
Differences in Venture Capital Financing of U.S., UK, German and French IT St...Differences in Venture Capital Financing of U.S., UK, German and French IT St...
Differences in Venture Capital Financing of U.S., UK, German and French IT St...
Mj Mjg
 

Andere mochten auch (19)

A comparative study on direct equity investing and mutual fund investing
A comparative study on direct equity investing and mutual fund investingA comparative study on direct equity investing and mutual fund investing
A comparative study on direct equity investing and mutual fund investing
 
Project report-mbahotspot
Project report-mbahotspotProject report-mbahotspot
Project report-mbahotspot
 
30838403 comparative-analysis-of-mutual-funds
30838403 comparative-analysis-of-mutual-funds30838403 comparative-analysis-of-mutual-funds
30838403 comparative-analysis-of-mutual-funds
 
How to choose a debt fund
How to choose a debt fundHow to choose a debt fund
How to choose a debt fund
 
FT Quant presentation eng
FT Quant presentation engFT Quant presentation eng
FT Quant presentation eng
 
report on kotak mutual fund
report on kotak mutual fundreport on kotak mutual fund
report on kotak mutual fund
 
Research methododlogy
Research methododlogyResearch methododlogy
Research methododlogy
 
Mutual fund Simplified- To study the Perception Towards Mutual Fund Services ...
Mutual fund Simplified- To study the Perception Towards Mutual Fund Services ...Mutual fund Simplified- To study the Perception Towards Mutual Fund Services ...
Mutual fund Simplified- To study the Perception Towards Mutual Fund Services ...
 
Cma ashish dhandre
Cma ashish dhandreCma ashish dhandre
Cma ashish dhandre
 
Brm ppt balanced funds
Brm ppt balanced fundsBrm ppt balanced funds
Brm ppt balanced funds
 
Intencionalidad power point 2
Intencionalidad power point 2Intencionalidad power point 2
Intencionalidad power point 2
 
Boost sales
Boost salesBoost sales
Boost sales
 
Guia empleo fmp97
Guia empleo fmp97Guia empleo fmp97
Guia empleo fmp97
 
[Altibase] 3-3 directory contents
[Altibase] 3-3 directory contents[Altibase] 3-3 directory contents
[Altibase] 3-3 directory contents
 
Running Docker clusters on AWS (June 2016)
Running Docker clusters on AWS (June 2016)Running Docker clusters on AWS (June 2016)
Running Docker clusters on AWS (June 2016)
 
Samuel Almeida - Plano investigação
Samuel Almeida - Plano investigaçãoSamuel Almeida - Plano investigação
Samuel Almeida - Plano investigação
 
12853150 comparative-analysis-of-mutual-funds
12853150 comparative-analysis-of-mutual-funds12853150 comparative-analysis-of-mutual-funds
12853150 comparative-analysis-of-mutual-funds
 
Report on construction of mutual fund portfolio
Report on construction of mutual fund portfolioReport on construction of mutual fund portfolio
Report on construction of mutual fund portfolio
 
Differences in Venture Capital Financing of U.S., UK, German and French IT St...
Differences in Venture Capital Financing of U.S., UK, German and French IT St...Differences in Venture Capital Financing of U.S., UK, German and French IT St...
Differences in Venture Capital Financing of U.S., UK, German and French IT St...
 

Ähnlich wie Mutual fund analysis on debt schemes with special reference to kotak bond fund

Research report on affect of investment style on mutual fund performance
Research report on affect of investment style on mutual fund performanceResearch report on affect of investment style on mutual fund performance
Research report on affect of investment style on mutual fund performance
Pratap Kumar
 
Capstone project_Pratim Roy PGDM_1838(1)
Capstone project_Pratim Roy PGDM_1838(1)Capstone project_Pratim Roy PGDM_1838(1)
Capstone project_Pratim Roy PGDM_1838(1)
pratim roy
 
Mutual und analysis & portfolio managemaent
Mutual und analysis & portfolio managemaentMutual und analysis & portfolio managemaent
Mutual und analysis & portfolio managemaent
Ravi Chaurasiya
 
Adityakashyap 140620064428-phpapp01
Adityakashyap 140620064428-phpapp01Adityakashyap 140620064428-phpapp01
Adityakashyap 140620064428-phpapp01
Nagpur home
 
Summer Internship Project Report
Summer Internship Project ReportSummer Internship Project Report
Summer Internship Project Report
dhaval patel
 
kotak securities summer intership project report
kotak securities summer intership project reportkotak securities summer intership project report
kotak securities summer intership project report
CS Akshay Goyal
 
CUSTOMER AWARENESS ON MUTUAL FUNDS
CUSTOMER AWARENESS ON MUTUAL FUNDSCUSTOMER AWARENESS ON MUTUAL FUNDS
CUSTOMER AWARENESS ON MUTUAL FUNDS
sandeep kumar
 
Ankit winter project report
Ankit winter project reportAnkit winter project report
Ankit winter project report
sakthi22
 

Ähnlich wie Mutual fund analysis on debt schemes with special reference to kotak bond fund (20)

Research report on affect of investment style on mutual fund performance
Research report on affect of investment style on mutual fund performanceResearch report on affect of investment style on mutual fund performance
Research report on affect of investment style on mutual fund performance
 
Company analysis in sugar sector
Company analysis in sugar sectorCompany analysis in sugar sector
Company analysis in sugar sector
 
Capstone project_Pratim Roy PGDM_1838(1)
Capstone project_Pratim Roy PGDM_1838(1)Capstone project_Pratim Roy PGDM_1838(1)
Capstone project_Pratim Roy PGDM_1838(1)
 
Mutual und analysis & portfolio managemaent
Mutual und analysis & portfolio managemaentMutual und analysis & portfolio managemaent
Mutual und analysis & portfolio managemaent
 
Market research on penetration of kotak mutual fund
Market research on penetration of kotak mutual fundMarket research on penetration of kotak mutual fund
Market research on penetration of kotak mutual fund
 
Adityakashyap 140620064428-phpapp01
Adityakashyap 140620064428-phpapp01Adityakashyap 140620064428-phpapp01
Adityakashyap 140620064428-phpapp01
 
MUKESH MAURYA BRP REPORT.pdf
MUKESH MAURYA BRP REPORT.pdfMUKESH MAURYA BRP REPORT.pdf
MUKESH MAURYA BRP REPORT.pdf
 
Summer Internship Project Report
Summer Internship Project ReportSummer Internship Project Report
Summer Internship Project Report
 
SIP Report - Equity Research (Fundamental and Technical Analysis).docx
SIP Report - Equity Research (Fundamental and Technical Analysis).docxSIP Report - Equity Research (Fundamental and Technical Analysis).docx
SIP Report - Equity Research (Fundamental and Technical Analysis).docx
 
Scope for mutual fund advisory business in Jamnagar
Scope for mutual fund advisory business in JamnagarScope for mutual fund advisory business in Jamnagar
Scope for mutual fund advisory business in Jamnagar
 
kotak securities summer intership project report
kotak securities summer intership project reportkotak securities summer intership project report
kotak securities summer intership project report
 
1NZ18MBA47.pdf
1NZ18MBA47.pdf1NZ18MBA47.pdf
1NZ18MBA47.pdf
 
CUSTOMER AWARENESS ON MUTUAL FUNDS
CUSTOMER AWARENESS ON MUTUAL FUNDSCUSTOMER AWARENESS ON MUTUAL FUNDS
CUSTOMER AWARENESS ON MUTUAL FUNDS
 
Working capital management on kotak mahindra group
Working capital management on kotak mahindra groupWorking capital management on kotak mahindra group
Working capital management on kotak mahindra group
 
project
projectproject
project
 
merged_document
merged_documentmerged_document
merged_document
 
Mutual fund perception
Mutual fund perceptionMutual fund perception
Mutual fund perception
 
Ankit winter project report
Ankit winter project reportAnkit winter project report
Ankit winter project report
 
summer internship project on ICICI MF
summer internship project on ICICI MF summer internship project on ICICI MF
summer internship project on ICICI MF
 
summer project of ICICI on MF
summer project of ICICI on MFsummer project of ICICI on MF
summer project of ICICI on MF
 

Kürzlich hochgeladen

原版定制(UWIC毕业证书)英国卡迪夫城市大学毕业证原件一模一样
原版定制(UWIC毕业证书)英国卡迪夫城市大学毕业证原件一模一样原版定制(UWIC毕业证书)英国卡迪夫城市大学毕业证原件一模一样
原版定制(UWIC毕业证书)英国卡迪夫城市大学毕业证原件一模一样
gfhdsfr
 
100^%)( KATLEHONG))(*((+27838792658))*))௹ )Abortion Pills for Sale in Alexand...
100^%)( KATLEHONG))(*((+27838792658))*))௹ )Abortion Pills for Sale in Alexand...100^%)( KATLEHONG))(*((+27838792658))*))௹ )Abortion Pills for Sale in Alexand...
100^%)( KATLEHONG))(*((+27838792658))*))௹ )Abortion Pills for Sale in Alexand...
itumechris15
 
原件一样(USC毕业证)南加州大学毕业证成绩单留信学历认证可查
原件一样(USC毕业证)南加州大学毕业证成绩单留信学历认证可查原件一样(USC毕业证)南加州大学毕业证成绩单留信学历认证可查
原件一样(USC毕业证)南加州大学毕业证成绩单留信学历认证可查
lezegu21r
 

Kürzlich hochgeladen (10)

Li-Cycle-Investor-Presentation-February-2021.pdf
Li-Cycle-Investor-Presentation-February-2021.pdfLi-Cycle-Investor-Presentation-February-2021.pdf
Li-Cycle-Investor-Presentation-February-2021.pdf
 
原版定制(UWIC毕业证书)英国卡迪夫城市大学毕业证原件一模一样
原版定制(UWIC毕业证书)英国卡迪夫城市大学毕业证原件一模一样原版定制(UWIC毕业证书)英国卡迪夫城市大学毕业证原件一模一样
原版定制(UWIC毕业证书)英国卡迪夫城市大学毕业证原件一模一样
 
100^%)( KATLEHONG))(*((+27838792658))*))௹ )Abortion Pills for Sale in Alexand...
100^%)( KATLEHONG))(*((+27838792658))*))௹ )Abortion Pills for Sale in Alexand...100^%)( KATLEHONG))(*((+27838792658))*))௹ )Abortion Pills for Sale in Alexand...
100^%)( KATLEHONG))(*((+27838792658))*))௹ )Abortion Pills for Sale in Alexand...
 
Dehradun ℂall Girl 9315791090 ℂall ✂️ Girl Serviℂe Vip Top Model Safe
Dehradun ℂall Girl 9315791090 ℂall ✂️ Girl Serviℂe Vip Top Model SafeDehradun ℂall Girl 9315791090 ℂall ✂️ Girl Serviℂe Vip Top Model Safe
Dehradun ℂall Girl 9315791090 ℂall ✂️ Girl Serviℂe Vip Top Model Safe
 
原件一样(USC毕业证)南加州大学毕业证成绩单留信学历认证可查
原件一样(USC毕业证)南加州大学毕业证成绩单留信学历认证可查原件一样(USC毕业证)南加州大学毕业证成绩单留信学历认证可查
原件一样(USC毕业证)南加州大学毕业证成绩单留信学历认证可查
 
ℂall Girls Dehradun Just ℂall 9315791090 Top ℂlass ℂall Girl Serviℂe Available
ℂall Girls Dehradun Just ℂall 9315791090 Top ℂlass  ℂall Girl Serviℂe Availableℂall Girls Dehradun Just ℂall 9315791090 Top ℂlass  ℂall Girl Serviℂe Available
ℂall Girls Dehradun Just ℂall 9315791090 Top ℂlass ℂall Girl Serviℂe Available
 
Binance crypto market report Q1 2024 You should read to understand the trend
Binance crypto market report Q1 2024 You should read to understand the trendBinance crypto market report Q1 2024 You should read to understand the trend
Binance crypto market report Q1 2024 You should read to understand the trend
 
Camil Institutional Presentation_Mai24.pdf
Camil Institutional Presentation_Mai24.pdfCamil Institutional Presentation_Mai24.pdf
Camil Institutional Presentation_Mai24.pdf
 
Collective Mining | Corporate Presentation - May 2024
Collective Mining | Corporate Presentation - May 2024Collective Mining | Corporate Presentation - May 2024
Collective Mining | Corporate Presentation - May 2024
 
Investor Day 2024 Presentation Sysco 2024
Investor Day 2024 Presentation Sysco 2024Investor Day 2024 Presentation Sysco 2024
Investor Day 2024 Presentation Sysco 2024
 

Mutual fund analysis on debt schemes with special reference to kotak bond fund

  • 1. 1 International Management Institute Kolkata Summer Internship Report On Analyzing the Debt Schemes of Kotak Asset management company limited with Special Reference to Kotak Bond Fund Name: Sourav Kumar Mahato PGDM 2015-17 Kotak Mahindra Asset Management Company Limited Corporate Internship Mentor Name: Deepak Kumar Kaushik IMI-K Faculty Mentor Name: Chanchal Chatterjee Start Date for internship: 01st April 2016 End Date Internship: 10th June 206 Report Submission Date: 25th June 2016
  • 2. 2 Serial Number Contents Page number 1 Certificate by the Mentor 3 2 Declaration Certificate 4 3 Acknowledgement 5 4 Objective of the Report 6 5 Selection of Topic 6 6 Objective of the Study 7 7 Methodology of the Project 7 8 Scope of the Study 7 9 Limitation of the study 8 10 Kotak Mahindra Group of Companies 8 11 Vision and mission 9 12 About Debt Portfolio Management 9 13 Classification of Debt Securities 9 14 Debt Market Instruments 10-11 15 Basic Characteristics of Debt Securities 11-12 16 Risk in Investing in Bonds 13 17 Investment Policies and Restrictions 13 18 Minimum Portfolio Diversification Norms 14 19 Introduction to Mutual Fund 15 20 Emergence of Mutual Fund 15 21 History of Mutual Fund 15-20 22 Mutual Fund Framework 21 23 Disadvantage of Mutual Fund 23 24 Classification of Mutual Fund 24 25 Offer document by Fund Houses 26 26 Accounting for Mutual Fund 27 27 Measuring and Evaluating Funds Performance 30 28 The Risk-Return Tradeoff 32 29 Debt market review 33 30 About Kotak Bond Fund 34 31 Fund Overview 34 32 Investment objective and Strategy 35 33 Asset allocation and 36 34 Return Matrix 37 35 Return Analysis 38 36 Portfolio action (FY2015-2016) 40-47 37 Monthly dividend (FY2015-2016) 48 38 Glossary 49-52 39 Bibliography 53
  • 3. 3 Certificate by Mentor This is to certify that the contents of this report entitled “Mutual Fund Analysis on Debt Schemes with Special Reference to Kotak Bond Fund” by ______________________________________ submitted to International Management Institute Kolkata for the Partial fulfilment of the requirement of the Degree “Post Graduate Diploma in Management (PGDM)” is the original Work which has been carried out under my supervision. I hereby certify the authenticity of the Data and Facts mentioned in the report. Deepak Kumar Kaushik Date: - ………………………. (Manager) Kotak Mahindra Asset Management Company Limited 235/2A, A. J. C. Bose Road, 3rd Floor, the Millennium Kolkata – 700020. +91 - 33 - 2282 2411/14 +91 - 33 - 2282 1102 Mobile- 9007977767/9830988500, Email-deepak.kaushik@kotak.com
  • 4. 4 Declaration I, Sourav Kumar Mahato (15PGDM074), to the best of our knowledge hereby declare that the project report entitled “Mutual Fund Analysis on Debt Schemes with Special Reference to Kotak Bond Fund” submitted to the International Management Institute, Kolkata is a record of an Original work done by us under the guidance of Dr. Chanchal Chatterjee. This Project work is submitted in the partial fulfilment of the academic requirement. The project report has been submitted to Kotak Mutual Fund and International Management Institute Kolkata. Date: -……………......... Sourav Kumar Mahato (15PGDM074)
  • 5. 5 Acknowledgement It is a matter of great pleasure for us in submitting the project report on “Mutual Fund Analysis on Debt Schemes with Special Reference to Kotak Bond Fund” for the fulfilment of the requirement of the academic course. This successful project report has been made possible through the direct cooperation and guidance of various people for whom we wish to express our appreciation and deep gratitude. Words seemto be inadequate to express our thanks to Mr. Deepak Kaushik for his valuable guidance, untiring efforts and immense encouragement during the entire course of the study. We are highly obliged to Mr. Sachin Sood, Mr. Anupam Patnaik, Mr. Somnath Chakraborty, Mr. Krishanu Bannerjee, Mr. Kamal Agarwal, and other members of Kotak Mutual Fund Kolkata Office, who had helped us to procure primary data to complete our project. I would like to thank Dr. Chanchal Chatterjee for helping me completing the project. Last but not the least I am very grateful to all those who helped us in one way or the other at every stage of our work.
  • 6. 6 Objective of the Project Theoretical Knowledge without Practical Experience is of no use. So, without Practical implementations, theory remains no use. Hence we need to gain the Practical Experience. And what better would be, then a Project work for the same. Also as a part of our PGDM curriculum, we need to undergo for the Summer Internship programmed for minimum of 8 Weeks, in a company. I selected area of MUTUAL FUND INDUSTRY, which pools the funds & reduces risk by investing in different diversified assets.Istudied as to how this industry proves to an option for the investors, by studying the performance of mutual funds for few months considering their Net Asset Values. Hence this is a project work on a “Debt Portfolio Analysis with special reference to Kotak Bond Fund”. Selection of Topic Generally, when we decide to study the investment options available in today’s complex & risky scenario, we should thoroughly evaluate the option upon various factors. These factors should include:  The Past Performance of the option under study  Risk adjusted returns from the invested plan  The Economic Factors  Fund House When observed the above parameters for the evolution of The Financial Performance of the option under study, then immediate concept that clicks our mind is MUTUAL FUNDS. So for this, I have selected to study Debt Scheme Analysis as investment option. Study of Debt Fund includes: -  Study of Debt, Bonds, Securities, etc.  Risk Measurement & risk diversifications  Analyzing a Particular Scheme.
  • 7. 7 Objective of the Study  How to find the RIGHT SCHEME to buy & Redeem at RIGHT TIME, thereby mobilizing the saving aptly.  How to get good return on investment  How to achieve Capital appreciations  To analyze the performance of Various Schemes of the Fund House. Methodology of the Project Defining objective won’t suffice unless & until a proper methodology is to achieve the objectives. 1. The methodology of the project here is to analyze the investments Opportunities available for the investors & study the returns & risk involved in various investment opportunities. 2. Study of investment management, risk management & portfolio Diversification. 3. The methodology of the project here is to analyze the Mutual Fund performance based on: -  NAV (Net Asset Value): - It tracked the daily NAV’s of the Mutual Funds to compute the performance.  Total Return Basis: By taking into account dividends distributed by the funds between the two NAV s change to arrive at a total return.  Portfolio turnover Ratio: This means the Amount of Buying & selling done by a fund.  Study Financial & Legal obligations of Mutual Funds. Scope of the Study The study encompasses different aspects from point of view of investors as follows. 1. Investment portfolio selection 2. types of Mutual Funds 3. Expected returns on investment 4. Investment in Tax Saving Schemes. Despite various problems, India Could still have a lot of profitable opportunities to offer in this sector. And giventhe fact it is the major emerging market to open up. It is equally important that, even if its various Fund Investments can harness a small part of the total funds available internationally, Indian Foreign Exchange reserves will shoot up. According to World Bank Study, portfolio investment in the emerging markets will rise (Actual figures are yet not published for the same).
  • 8. 8 Limitations of the Study  This project is not funded one, hence it gets restricted to a mere in depth study & few guidelines for investors.  This study is carried out in pursuance of curriculum MBA, which is mandatory for period of two months; hence exhaustive data is not available upon which conclusion can be relied upon.  NAV are prone to environmental factors 7 which would influencethe value during trading. Investments in Securities carry risks & Mutual Fund units are no exception.  Risk being erosion in the Market value of the Investment of decrease in the percentage dividends declared by the Mutual Fund. The risk factors inherent in a Mutual Fund Schemes are the schemes, market risk, & the investment experience of the Asset Management Company.  Factors affecting the Market Price of Investment may be due to Market forces, performance of the companies, Govt. Policies, Interest rates & so on.  Study for all the existing Mutual Fund Schemes is not feasible, Sample schemes of all Mutual Fund Types are considered for the Study. Kotak Mahindra Group of Companies This Group Consists Following Companies: -  Kotak Mahindra Bank Limited (KMBL)  Kotak Mahindra Old Mutual Life Insurance Ltd  Kotak Securities  Kotak Mahindra General Insurance Company Ltd.  Kotak Investment Banking (KMCC)  Kotak Mahindra Prime Ltd(KMPL)  Kotak International Business  Kotak Private Equity Group(KPEG)  Kotak Realty Fund  Kotak Mahindra Asset Management Company(KMAMC): - Kotak Mahindra Asset Management Company offers a complete bouquet of asset management products and services that are designed to suit the diverse risk return profiles of each and every type of investor. KMAMC and Kotak Mahindra Bank are the sponsors of Kotak Mahindra Pension Fund Ltd, which has been appointed as one of six fund managers to manage pension funds under the New Pension Scheme (NPS).
  • 9. 9 Company’s Vision and Mission To be the most trusted Global Indian Financial Services brand and the most preferred financial services employer with focus on creating value.  The Global Indian Financial Services Brand: -Our customers will enjoy the benefits of dealing with a global Indian brand that best understands their needs and delivers customized pragmatic solutions across multiple platforms.  We will be a world class Indian financialservices group. Our technology and best practices will be bench-marked along international lines while our understanding of customers will be uniquely Indian.  We will be more than a repository of our customers' savings. We, the group, will be single window to every financial service in a customer's universe.  The Global Indian Financial Service Brand  The Most Preferred Financial Employer in Financial Services  The Most Trusted Financial Services Company  Value Creation DEBT PORTFOLIO MANAGEMENT Debt portfolio has to contend with the construction & management of portfolio debt instrument, the primary objective of generating income. Just as the inquiry fund manager has to go through a stock selection process, a debt fund manager has to select from whole universe of debt securities he wants to invest in. Classification of Debt Securities Many instruments give regular income. However, in the context of debt mutual funds, manager invest only in market-trader instrument (not in loans as done by the bank) debt instrument may be secured by the assets of the borrowers as in case of corporate, or be unsecured as is the case with Indian Financial Bond. A Debt is issued by a borrower & is often known by the issuercategory thus giving us Government security & Corporate Securities or FI Bonds. Debt instrument are also distinguished by their maturity profile. Thus, instrument issued with short term maturities, typically under one year maturities are classified as Money Market Securities instrument carrying Long then one year maturities are generally called Debt Securities. Most debt securities are interested bearing. However, there are securities that are discounted securities or zero coupon bonds that are generally fixed that pay interest on a Floating Rate basis. There are lots of new instruments coming in the debt markets.
  • 10. 10 Instruments in the Indian Debt Market The objective of a debt is to provide investors with a stable income stream. Hence, a debt fund invests mainly in instrument that yields a fixed rate of return & where the principal is secured. The debt market in Indian offers the following instruments for investment for by Mutual Funds. Certificates of Deposits Certificates of Deposit (CD) are issued by scheduled commercial banks excluding regional rural banks. These are unsecured negotiable promissory notes. Banks CDs have a maturity period of 91 days to one year, while those issued by FI s have maturities between one & three years. Collateralized Borrowing and Lending Obligation (CBLO) A collateralized borrowing and lending obligation (CBLO) is a money market instrument that represents an obligation between a borrower and a lender as to the terms and conditions of the loan. Collateralized borrowing and lending obligations (CBLOs) are used by those who have been phased out of or heavily restricted in the interbank call money market. Commercial Paper Commercial Paper (CP) is a short term, unsecured issued by corporate bodies (Public & Private) to meet short-term working capital requirement. Maturity varies between 3 months & 1 year. This instrument can be incorporated in Indian. CP s can be issued to NRI s on non-repairable & non- transferable basis. Corporate Debentures The debentures are usually issued by manufacturing companies with physical assets, as secured instruments; in the form of certificates they are assigned a credit rating by rating agencies. Trading in Debentures is generally based on the current yield & market values are based on yield of maturity. All publicly issued Debentures is listed on exchange. Floating Rate Bonds These are short to medium term bearing instruments issued by the financial intermediaries & corporate. The typicalmaturity of these bonds is 3to 5 years.FRB s issuedby FinancialInstitutions are generally unsecured while those from private corporate are secured. The FRB s are pegged to different reference as much as T- bill or bank deposits rates. The FRB s issued by the Government of Indians are in the form of Stock Certified of issued by credit to SGL accounts maintained by the RBI.
  • 11. 11 Government Security These are medium to long term interest bearing obligations issued through the RBI by the Government of India & State Governments. The RBI decides the cut-off on the basis of bids received during the auctions. These are issued where the rates are pre-specified & the investor s only bids for the quality. In most cases, the coupon is paid semiannually with bullet redemption features. A large part of the trading is concentrated in those government securities that are eligible for repost (repurchase) transition, i.e. sale of a security with a parallel agreement to repurchase the same at a future date. The RBI acts as the depository; its public debt office maintains an SGL account for various banks & Financial Institution, & issues or transfers the securities in the form of book entries made in SGL accounts. If a fund does not have an SGL account, it may open a constitution account with any RBI- registered bank. Treasury Bills T- Bills are shortly obligation issued through the RBI by the Government of India at a discount the RBIIssues T-Bills fordifferent tenures: 14 days, 91 days &364 days.These treasury bills areissued through an auction procedure. The yield is determined on the basis bids tendered & accepted. Bank/ FI Bond Most of the institutional bonds are in the form of promissory notes transferable by endorsement & delivery. These are negotiable, issued by the Financial Institution such as IDB/ ICICI/ IFCI or by commercial bank. These instruments have been issued both as regular income bonds & as discounted long term instruments (deep discount bonds). Public Sector Undertaking (PSU) Bonds PSU Bonds are medium & long term obligation issued by Public sector companies in which the government shareholding is generally greater than 51%. Some PSU Bonds carry tax exemptions. The maximum maturity is 5 years for Taxable bonds & 7 years for Tax- Free Bonds. PSU bonds are generally, not guaranteed by the government & are in the form of promissory notes transferable by endorsement & delivery. PSU bonds in Electronic form (Demat) are eligible report transactions. Basic Characteristics of Bonds or Debt Security A debt fund or a bond fund generally invest a large part of its corpus in longer term fixed income in debit securities issued by government, companies or Banks/ FI s. A small part is invested in money market. In Indian context, long dated government securities, corporate debentures & FI Bonds from the bulk of debt fund portfolios.
  • 12. 12 Bonds have the following four keys characteristics set at the time of issue:  Par Value: This is the principal amount that investors will be paid upon Maturity of the bonds, & is also known as the face value.  Coupon: This is the annual rate of interest paid on the par value of the Bond to the investor.  Maturity: This refers to the term of the bond that is, the date on which the Bond that is, the date on which the issuer has to repay the principle amount of the Bond.  Call orProvision:Theseareincluded insome bond contracts to allow the issuerthe option to redeem the bonds before Maturity thereby allowing refinance of debt at lower interest rates. Measuring of Bond Yields: Returns on a fixed income security is generally computed in the form of Current Yield or a Yield to Maturity. Current Yield: This relates interest on a Bond to its Current Market Price by dividing the annual coupon interest by the current market price.  Yield to Maturity (YTM): This is a sophisticated technique of bond analysis. Posen defines YTM (also known as the bonds IRR) as the annual rate of return & investors would realize if he a bond at a particular price, & received the principal at maturity. YTM allows investors to compare bond with different coupons, maturities & price & is quoted for trading purposes. The relationship between the price & YTM of a bond is expressed by the following formula: PRICE= Coupon / (1+ YTM) + Coupon2 / (1+ YTM) 2. +(Coupon Principle) / (1+ YTM) n The inverse relation between price & YTM is important in bond portfolio management.  Yield Curve: This is the graph showing yields for bonds various maturities, using a benchmark group of bond, such as the Government Securities. This is also known as the Term Structure of Interest Rates (TRIR). This yields curve usually upwards sloping become longer maturities generally offer higher yields. This is because longer term debt carries higher risk on account of inflation & other economic factors. The yield curve is important indicators of expected trends in interest rates.
  • 13. 13 Riskin Investing in Bond 1) Interest Rates-Risk: The price of bond will change in a direction opposite to movement in interest rates. When interest rates rise bond price will fall, thus an existing bond portfolio losing valve. A sound analysis of interest rates movement is therefore essential. 2) Reinvestment Risk: A bonds yield to maturity assumes reinvestment of interest received during the term at a constant rate. This not may be possible if interest rate changes & risk is of uncertain cash flow being reinvested at a lower rate. 3) Call Risk: If a bond has been issued with a call provision the issuer may call them back & return the proceeds to the investors whenever interest rates fall, so the borrowing can be replaced with cheaper debt. The investor thus cannot keep a high yield bond. 4) Default Risk: A bond is a subject to the risk that is assured may default on its obligation to make timely principle & interest payments. A fund needs to assess this risk based on the bonds rating & the analysis generated by its research on issuer s cash flows. 5) Inflation Risk: When the inflation rate rises, purchasing power decline. Therefore, the value of interest payment is reduced. Investors will therefore expect higher yields in bonds. Higher interest rate will make the existing bond lose value again. 6) Liquidity Risk: This refer to the ease with which investment in a bond can be liquidated (or sold) at a price near its value. This element is important for a fund because its investments are made on behalf of unit-holder & market conditions may require the fund to liquidate a part of its portfolio within a short time. Investment Policies andRestriction Investment Policy: Investment Policies of each scheme are dictated by its investment objective as stated in the offer document. In practice the board policy guidelines are included in the offer documents while the day to day policies are laid down by the AMC management for the fund manager to conform to fund manager do have some flexibility in alerting the strategy in the light of changing market condition & in specific selection. Investment strategy of an equity fund will lay down guideline on which sectors & what kind of companies to invest in, what percentage will be held in the form of cash or money market
  • 14. 14 securities or how much in debt securities. Usually minimum & maximum allocation of funds to each class- Equity & Cash is specified. Investment policies of a debt fund will also lay down guidelines on the portfolio & their average maturity. Minimum & Maximum percentage of Cash/ money market instruments in the portfolio has to be specified too. Investment policy of balanced funds will specify the minimum & maximum asset allocations to equity & debt / cashbesides the normal guidelines for the equity &debt components. Investment policies of the money market funds will largely specify the type of instrument preferred & their profile. Investment Restrictionby SEBI: While the AMC management the AMC determines the investment policies & its fund manager must also comply with the restriction imposed by regulator-mostly SEBI & in case of money market fund the RBI. SEBI s main objective in laying down restriction on AMC s is to ensure investor protection. The objective is attained by: 1. Maintaining minimum level of diversification in Mutual Fund Investments. 2. Ensuring that the Investor s funds are used to favor a few or associated invested in approved securities only. To attain this Regulatory objectives, some major restrictions imposed by SEBI. Minimum Portfolio DiversificationNorms Investment in equity shares or equity related instruments of a single company are restricted to 10% of the NAV as a scheme. However, the limit of 10 % does not apply in case of sector/industry specified schemes subject to adequate discloser in the offer documents. The basic objective here is to ensure that a fund a fund has an adequately diversified portfolio unless the specified objective if the scheme is to limit the investments. Similarly, for debt schemes, SEBI restricts the investment in rated investment grade debt instrument issued by a single issuer is not allowed to exceed 10% of the NAV subject to approval of board of AMC & trustee company? These restrictions do not apply to & money & government securities. SEBI s restriction on the investment in unlisted share to a minimum of 10 % of the NAV of a scheme for closed end scheme. In case of open ended the limits may be made more stringent to 5% of the NAV of the scheme as there is continuous purchase by investors in such a scheme.
  • 15. 15 INTRODUCTION TO MUTUAL FUNDS The Concept of Mutual Fund Industry A Mutual Fund is a common pool money into which investor place their contribution that is to be investors in accordance with a stated objective. The ownership of the joint or Mutual, the fund belongs to the contribution make a single investor s ownership of the fund to the total amount of the fund. A mutual fund is a collective investment that allows many investors, with a common objective, to pool individual investments and give to a professional manager who in turn would invest these monies in line with the common objective. A Mutual Fund used the money collected from investors to buy those assets, which are specifically permitted by its stated investment objective. Thus an equity fund would buy equity asset- ordinary shares, preferences share, warrants etc. a bond fund would buy debt instrument such as debentures, bonds, or government securities. It is these assets, which are owns by the investor in the same proportion as their contribution bears to the total contribution of all investor put together. Since each owner is a part owner of a Mutual Fund, it is necessary to establish the value of his part. In other words, each share or unit that investors hold needs to be assigned a value. Since the unit held by investors evidence the ownership of the funds asset, the value of total asset of the fund. When divided by the total number of units issuedby the Mutual Fund gives us the value of one unit. This is generally called the net asset value (NAV) of the number of unit held. Emergence of Mutual Fund Mutual Funds now represent perhaps the most appropriate investment opportunity for most investor, as financial markets become more sophisticated & complex. Investors need a Financial Intermediary who provides the required knowledge & professional expertise on successful investing. It is no wonder then in the birthplace of Mutual Fund the U.S.A. the fund industry has already overtaken the banking industry more funds being under Mutual Fund Management than deposited with the bank. The Indian Mutual Fund Industry is a fast growing segment of the economy. The Industry consists of 36 Mutual Funds including Unit Trust of India. With 397 schemes spread over variety products the industry today manages assets close to Rs. 97,000 crores. The Indian Mutual Fund Industry has already started opening up, of many of exciting investment opportunity to Indian investors. We have started witnessing the phenomenon of more saving now being entrusted to the funds than to the banks. Mutual Funds as still a new Financial Intermediary in India. Hence it is important that the investors should make proper analysis of the available scheme in the market. The investment advisor & even the fund employees acquire better knowledge of what Mutual Funds are. What, they can do for investor & what they cannot
  • 16. 16 & how they function differently from other intermediaries such as the banks. The association of Mutual Funds in India has commissioned a workbook, as the basic compellation of the minimum knowledge requires by both fund distributors & the employees. The workbook provided by AMFI can serve as a guide distributors & employees. History ofMutual Funds in India The Indian Mutual Fund Industry began with the formation of the Unit Trust of India (UTI) in 1964 by the Government. UTI was formed as a non-profit organization governed under a special legislation, the Unit Trust of India Act, 1963. It had a monopoly up to 1987 & during this period, UTI launched a series of equity & debt schemes & established itself as a household name with assets under management of Rs. 4563 crore & unit holder accounts of slightly under 3 Million by mid-1987. UTI s growth continued up to 1996 when the strong entry of private sector players saw its share of the market reducing sharply although UTI continues to be a dominant force in the Indian Financial Services industry with assets of over Rs. 67,000 crores as of December 31, 1999. In 1987, the Industry saw the entry of Public Sector Mutual Funds, i.e. funds promoted by public sector banks & financial institutions, such as SBI, Canara Bank, LIC & IDBI. Predictably they were given the brand of them promoters such as SBI Mutual Fund, Canara bank Mutual Fund, and LIC Mutual Fund & IDBI Mutual Fund. Other Public Sector Mutual Funds also entered the market but UTI continued to remain the dominant player with a share of 84% in 1991-92. The Government first allowed private sector participation in 1993 & the subsequent entry of a large number of players has made the industry very competitive. The diagram below shows the three segments & a few of the players in each segment. UTI was started, at the initiative of the Reserve Bank of India & the Government of India. The objective then was to attract the small investors & introduce them to market investment. Since, then the History of Mutual Funds in India can be broadly divided into three distinct phases. Phase I: 1964 87 (Unit Trust of India) This phase spans from 1964 to 1988. In 1963, UTI was establishedby an act of Parliament & given a monopoly. Operationally, UTI was set up by the Reserve Bank of India, but was later de-linked from the RBI. The first & still one of the largest schemes, launched by the UTI was Unit Scheme 1964. Over the years, US-64 attracted & probably still has the largest number of investors in any single investments schemes. First Phase (1964- 1987): -
  • 17. 17 June 30, 2000 UTI Bank Sponsored Institutions Private Sector Establishment of UTI in 1963: -In 1978, UTI was delinked from the RBI & the Industrial Development Bank of India (IDBI) & took over the regulatory & administrative control in place of RBI. The first scheme launched by UTI was Unit Scheme in 1964.At the end of 1988 UTI had Rs.6, 700 crores of assets under Mgmt. UTI had grown large as evidence by the following statistics: Phase II: 1987-1993 (Entry of Public Sector Funds) 1987, Marked the entry of non-UTI public sector Mutual Funds, bringing in competition. With the opening of economy, many public sector bank & financial institution was allowed to establish Mutual Funds. The State Bank of India established the first non-UTI Mutual Fund- SBI Mutual Fund- in November 1987. This was followed by Can Bank Mutual Fund (launched in December, 1987), LIC Mutual Funds (launched in 1989) & Indian Bank Mutual Funds (launched in 1990) followed by Bank of India Mutual Fund, GIC Mutual Fund & PNB Mutual Fund. The private sector players, after an indifferent start in the early years, have made a strong impression especially in the larger cities, with a high quality of fund management, sales & customer service. This sector has dented UTI’s dominance resulting in a falling market share towards the end of the last millennium. Asset Under Management: - June 30, 2000 September 31, 2001 UTI 57.09% 53.60% Bank Sponsored 3.66% 3.78% Institutions 4.12% 4.46% Private Sector 35.13% 38.16% Total 100.00% 100.00% Total Amount (in crores) 97953 91811 Year: -1987-1988 Amount Mobilized-2175 Crores INR Asset Under Management-670 Crores INR Mobilization as % of GDP-3.1% September 31, 2001 UTI Bank Sponsored Institutions Private Sector
  • 18. 18 Open End Close End Assured Return Total Income 85 28 29 142 Growth 96 15 ---- 111 Balanced 31 04 ---- 035 Liquid 28 ---- ---- 028 Gilt 24 ---- ---- 024 ELSS 19 52 ---- 071 Total 283 99 29 411 Second Phase (1987-1993) / Entry of Public Sector Funds: - 1987 marked the entry of Non- UTI, Public Sector Mutual Fund setup by Public Sector Banks & LIC of India & General Insurance Corporation of India (GIC) SBI Mutual Fund was the First Non- UTI Mutual Fund established in June 1987 followed by Canara bank Mutual Fund (Dec.1987), Punjab National Bank Mutual Fund (Aug.1989), Indian Bank Mutual Fund (Nov.1989), Bank of India (Jan.1990), Bank of Baroda Mutual Fund (Oct.1992). LIC establishedits Mutual Fund in June 1989 while GIC had setup its Mutual Fund in Dec. 1990. At the end of 1993, The Mutual Fund Industry had assets under Mgmt. Of Rs. 47,004 Crores. Gilt Funds 1. Next only to money market fund in risk order 2. Gilts- government securities with medium to long term maturities over one year 3. Investment in government paper called dated securities 4. Negligible risk of default 5. Risk arising out of changes in market price of debt securities 6. Debt securities prices fall when interest rate rise. Debt Funds 1. Invest in debt securities issued not only by government but also Corporate & financial institutions 2. Target low risk & stable income 3. Higher price fluctuation risk as compared to money market funds due to significantly higher maturity period exposures 4. Higher credit risk than gilt funds due to corporate profile 5. Do not target capital appreciation; generate high current income & distribution substantial part of surpluses to investors. Third Phase (1993-2003) / Entry of Private Sector Funds: - All Figures are in Crores (INR)
  • 19. 19  1993, the entry of Private Sector a new era started in the Indian Mutual Fund Industry, giving the Indian Investor a wider choice of Fund Family  Also 1993, was the year in which the First Mutual Fund Regulation came into being, under which all Mutual Fund expects UTI were to be register & Governed. The Kothari Pioneer (now merged with Franklin Templeton) was the First Private Sector Mutual Fund registered in July 1993.  In 1993 SEBI (MF) Regulations were substituted by a more Comprehensive & revised MF Regulations in 1996.  At the end of Jan.2003 there were 33 MF with Total Assets of Rs.1,21,80 5 Crore. The UTI with Rs.44, 541 Crores of Asset under Mgmt. was way ahead of other MF Industry has witnessed several Merges & Acquisitions. Fourth Phase (Since Feb. 2003): -  In Feb.2003, UTI was bifurcated into two separate entities. 1. One is the specified Undertaking of the UTI with assets under Mgmt. of Rs. 29,835 Crores as at end of Jan.2003, functioning under an administrator & under the rules framed by Govt. of India & does not come under preview of MF Regulation. 2. The second is UTI MF Ltd. Sponsored by SBI, PNB, BOB & LIC. It is Registered with SEBI & Functions under the MF Regulations.  Bifurcation of UTI in Mar.2000 more than Rs.76,000 Crores of assets Under Mgmt. & with the setting up of a UTI MF conforming to the SEBI MF Regulations.  At the end of Sept.2004, there were 29 Funds which Manages assets of Rs. 1, 53,108 Crores under 421 Schemes. Place of Mutual Fund in Financial Market Indian household started allocating more of their saving to the capital market in 1980 s with the investment flowing into equity & Debt instrument beside the conventional mode of the bank deposits. Until 1992 Primary Market investors were assured good return as the price of the new equity issues was controlled. After Introduction of free pricing of shares & with greater volatility in the Stock Markets, many investors who bought overpriced shares lost money & withdrew from the markets altogether. Even those investors who continued as direct investors in the Stock Market realized that the key to the successful investing on the capital markets lay in the building a diversified portfolio that in turn require substantial capital. Besides selecting securities with growth & income was not possible for all investor. Under similar circumstances in other countries, Mutual Fund had emerged as Professional Intermediaries. Besides providing the expertise in stock market, investing these funds allows investing in small amount& yet holding a diversified portfolio to limit risk. In India, Unit Trust of India occupied this
  • 20. 20 place as the only capital market intermediary Institution is emerging in India, as elsewhere as a good alternative to direct investing in the Capital Market. Mutual Funds serves as a link between the saving public & the capital market in that they mobilized saving from investors & bring them to borrower in the Capital Market. By the Very nature of their activities &by virtue of being knowledgeable & informed investors, they influence the Stock Market & play an active role in promoting good corporate governance, investor protection & the health of capital market. Mutual Fund have imparted much needed liquidity into the financial system & challenged the hitherto dominant role of banking & financial institution in the Capital Markets. Mutual Fund OperationFlow Chart: Mutual Fund Framework- INDIA
  • 21. 21 The Advantages of Mutual Fund  Portfolio Diversification: Each Investor in a Fund is a part of the funds entire asset, thus enabling him to hold a diversified investment Portfolio even with a small amount of investment, which would otherwise require big capital.  Professional Management: Even if an investor has a big amount of Capital available to him, he benefits from the professional management Skill brought in by the fund in the management of the investor s portfolio. The investment management skills, along with the needed research into available investment option, ensure a much better return than what an Investor can manage on his own. Few investors have the skill & resource of their own to success in today s fast moving, global & sophisticated markets.  Reduction / Diversification of Risk: When an investor invests directly, all the risk of Potential loss is his own, weather he places deposits with a company or bank, or buys a share debenture on his own or in any other instrument benefits of acollective investment vehicle are from the Mutual Fund.
  • 22. 22 Tax Benefits Professional Management Diversification  Reduction of Transaction Costs: What is true of risk is also the transaction costs. The investors bear all the cost of investing such as brokerage or custody of securities. When through a fund, he has the benefit of economic of scale; the fund pays lesser costs because of large volume, a benefit passed on to is investor.  Liquidity: Often, investors hold share or bonds they cannot directly, easily & quickly sell. When they invest in the units of a fund, they can generally, case their investment any time, by selling their units to the fund if open-ended, or selling them in the market if the fund is closed end. Liquidity of investment is clearly a big benefit. Open-ended -Assures liquidity -As liquid as the banks. Close-ended -Buying and selling can be done through the stock exchange  Conventional & Flexibility: Mutual Fund Management companies offer many investors services that a direct market investor cannot get. Investors can easily transfer their holding form one scheme to the other, get updated market information, easy to Invest, Reduces excessive Paperwork etc.  Safety: SEBI & RBI have a control over Mutual Fund Making investment in Mutual Fund a safeinvestment. A very good example here quoted can be of Government of India coming to rescue of UTI s US- 64 Schemes.  Affordability: -Provides an opportunity for a small investor -Invest as less as an amount of  Wide Choice: -Offers a Varieties of Schemes -Meet the investment needs of all Investors Mutual Fund- A Packaged Product
  • 23. 23 The Disadvantages of Mutual Fund No Control Over Costs: An investor in a Mutual Fund has no control Over the overall cost of investing. He pays investment management fees as long as he remains with the funds, in return for the professional management & research. Fees are payable even while the value of his investment may be declining. A mutual fund investor also pays fund distribution costs, which he would not incur in direct investing. No Tailor-made Portfolios: Investors who invest on their own can build their own portfolios of shares, bonds & other securities. Investing through Funds means he delegates this decision to the fund manager. The very high -net-worth individuals or large corporate investors may find this to be a constraint in achieving their objectives. Managing a Portfolio of Funds: Availability of a large number of funds can actually mean too much choice for the investor. He may again need advice on how to select a fund achieve his objectives, quite similar to the situation when he has to selectindividual shares or bonds to invest in. Developing a Model Portfolio  Work with Investor to develop long-term goals  Determine Asset Allocation of the investment  Determine the sector distribution  Select specific Fund Manager & their schemes  Model Portfolio  Creativity & forecasting
  • 24. 24 Classification of Mutual Fund Types of Mutual Fund By Constitution OPEN-END: No fixed maturity Variable Corpus Not Listed Buy from and sell to the Fund Entry/Exit at NAV related prices CLOSED-END: Fixed Maturity Fixed Corpus Generally Listed Buy and sell in the Stock Exchanges Entry/Exit at the market prices  Load or Non-Load Funds  Tax Exempt or Non-Tax Exempt By Nature of Investments Financial Assets (Equity/Debt/Money Market) Physical Assets (Metal/ Real Estate) Diversified Growth Funds: Diversified Debt Funds Focused Debt Funds: Sector / Specialized / Offshore Municipal bonds/ infrastructure cost bond fund Mortgaged backed High yield debt funds: Assured Return Funds - Indian variety Liquid Funds By Investment objective / patterns 1. Growth – Equity 2. Income – Debt 3. Balanced - Equity and Debt 4. Money Market - Liquid Debt 5. Tax Saving – Equity
  • 25. 25 6. Specialized – Equity 7. Assured Return - Equity and Debt 8. Mutual Fund can also be classified as open/ closed ended Mutual Fund Open Ended Mutual Fund Close Ended Mutual Fund Units available for the sale & repurchase Unavailable Investor can buy or redeem units from the Mutual Fund itself Investors can buy units from fund only at IPO subsequently buying & selling at the Stock Exchange Unit Capital is variable Unit capital is fixed Pricing at NAV +/- depending on load charges Prices may be quoted at premium or discount on the exchange depending on perception about fund’s future performance Investors rights and Obligations: -Investors Rights 1. Proportionate right to beneficial ownership of scheme s assets 2. Right to obtain information from trustees 3. Entitled to receive divided warrants within 30 days of declaration of Dividend. 4. Inspect major documents of the funds 5. Appointment of the AMC can be terminated by 75% of the unit holders of the scheme present & voting 6. Right to approve of changes in fundamental attributes of a close ended schemes so that they can redeem 7. Receive Annual Reports & A/C Statements Legal limitations to Investors Rights 1. Unit holders cannot use the Trust. 2. Can imitate legal proceeding against trustees. 3. Buyers beware. 4. Sponsor of Mutual Funds have no obligation to meet any shortfall in the assured return- unless explicitly guaranteed in the offer document. 5. No rights to a prospective investor. Minimum portfolio diversification 1. Equity schemes- single company under 10% of NAV, not applicable to index & sector funds.
  • 26. 26 2. Debts funds- singleissuernot more than 15% of NAV, can be relaxed to 20% with approval of trustees % AMC. 3. Unrated as well as rated but below investment grade, not more than 10% of NAV per issuer. 4. All such issuers put together not more than 25% of NAV. Investors Obligations 1. Carefully study the offer document before investing 2. Monitor his investment in a scheme by referring Financial statements, performance updates & research report sent by the AMC 3. Complaints readdress 4. SEBI entertains complaints Required sponsor to appoint compliance officewho has to give due diligencecertificate can remove AMC with 75% vote to this effect. No recourse to any company law. Offer Documents by Mutual Fund Houses Contents of an offer document  Summary information- at a glance  Type of scheme growth / income / balanced  Name of AMC  Price of units  If assured return-name of guarantor  Opening & Closing dates of the schemes  Disclaimer clause of SEBI  Details of the sponsor & the AMC  Description of the scheme & the investment philosophy  Terms of issue  Historical statistics  Investors rights & services  Abridged offer document/key information memorandum with application form. Significance  Legal document that protects and governs the right of the investor to information  Is the primary vehicle for the investment decision?
  • 27. 27  Is the operating document and describes the fundamental attributes of schemes?  One of the most important sources of information for the prospective investor  Is a reference document for the investor to look for relevant information at any time? Mandatory Information  Details of the Sponsor  Description of the scheme and investment objective/strategy  Terms of issue  Historical statistics  Investors Rights and Services Key Information Memorandum that is distributed with the application form is an abridged version of the offer documents. Investment Options & Features  Options -Growth -Dividend and Dividend Reinvestment  Plans -Systematic Investment Plan - SIP -Value Averaging Plan - VAP -Systematic Withdrawal Plan - SWP -Systematic Transfer Plan - STP  Other -Nomination facility Accounting for Mutual Fund Balance Sheet of a Mutual Fund is different from that of a bank. All the Funds belong to the investors & are held in fiduciary capacity for them.  NAV: Investor s subscriptions are unit capital rather than deposits or liability.  Investments made on behalf of investors are reflected on assets side  There are liabilities but of strictly short term nature. NAV= (Market value of investment + Receivables + Other Accrued income + Other Assets) (Accrued Expense + Other Payables + Other Liabilities) / No: of Units Outstanding as at NAV date.
  • 28. 28  NAV of all schemes to be calculated & published daily. Close- Ended schemes that are not mandatory required to be listed on Stock Exchange may declare NAV once in a month or quarter as permitted by SEBI.  Mutual Fund NAV is affected by four set of factors -Purchase & sale of investment securities -Valuation of all investment securities held -Others assets & liabilities -Units sold or redeemed  Other assets include any income due to the fund but not actual received as on the valuation date. Other liabilities include similar liabilities include similar liabilities. These are to be accounted for on an accrual basis. Major expenses like Management fee to be accrued on a daily basis. If non-accrual does not affect the NAV by more than 1% then it may not be accrued for that valuation date.  Non-recording of addition /sales of investments transaction or Sales/purchase of units can be postponed to the next valuation date in case such non-recording is not impacting the NAV by more than 2%.  NAV = Net assets of scheme / No of units Outstanding (I.e. Market value of investments+ Receivables+ Other accrued income+ Other assets- accrued expenses- Other Payables- Other liabilities/No. of units outstanding as at the NAV date) How is NAV Computed  Market value of Equities - Rs.100 crores - Asset  Market value of Debentures - Rs.50 crores - Asset  Dividends Accrued - Rs.1 crore - Income  Interest Accrued - Rs.2 crores - Income  Ongoing Fee payable - Rs.0.5 crore - Liability  Amount payable on shares purchased -Rs.4.5 crore - Liability  No. of units held in the Fund: 10 crore units NAV per unit = [(100+50+1+2) -(0.5+4.5)]/10 = [153-5]/10 = Rs. 14.80 NAV- Other Information  Open end funds to declare NAV daily  NAV to be published at least weekly
  • 29. 29  Close end Schemes (which are not listed) may publish NAV monthly/quarterly with prior approval from SEBI (MIP)  NAV has to consider up to date transactions  Non - recorded transactions not to affect NAV calculation by more than 2% NAV is influenced by- 1. Purchase and sale of Investment 2. Valuation of Investment 3. Other assets and Liabilities 4. Units sold or redeemed. Change in NAV- For NAV Change in absolute term= (NAV at end of the Period-NAV at Beginning of Period) *100/NAV at Beginning of Period NAV Change in annualized terms= (NAV Change in %age in absolute terms) *365/No. of Days. Loads-  Entry Loads or Front Ended Load (Now Discontinued) Paid at the time of Purchase. Sale Price =NAV/1-Sales Load (if any)  Exit Load or Back Ended Load Paid at the time of Exit Redemption Price =NAV/ (1+Exit Load)  Contingent Deferred Sales Load Deferred Exit Load depends on the Time Period Also Known as Deferred Load Sale Price  Sale price is the price at which units are sold to the Investors.  Sale Price =NAV +Entry Load  Computation of Sale Price =NAV/(1-Load) For Example: -  Market value of Equities - Rs.100 crores - Asset  Market value of Debentures - Rs.50 crores - Asset
  • 30. 30  Dividends Accrued - Rs.1 crore - Income  Interest Accrued - Rs.2 crores - Income  Ongoing Fee payable - Rs.0.5 crore - Liability  Amount payable on shares purchased -Rs.4.5 crore - Liability  No. of units held in the Fund: 10 crore units NAV per unit = [(100+50+1+2) -(0.5+4.5)]/10 = [153-5]/10 = Rs. 14.80 Measuring and Evaluating Funds Performance Necessary for Measuring Mutual Fund Performance When an investing entrusts his saving to Mutual Fund naturally he hopes to increase wealth by seeing the value of his investment grow. Having understood the conceptual & operation aspects of Mutual Funds it is important to analyze the issues involved in the evaluation of Fund performance. The Investor Perspective: - The investor would naturally be interested in tracking through the value of as investment whether invests directly in the markets or indirectly through Mutual Funds. He would have to make intelligent decisions on whether he gets an acceptable return on his investment in the funds selectedby him. Or ifhe needs to switch to another fund, he therefore needs to understand the basis of appropriate performance measurement for the fund & acquire the basic knowledge of the different measures of evaluating the performance well or not, & make the right decisions. The Adviser’s Perspective: - If you were an intermediary recommend A Mutual Fund to a potential investor he would accept you to give him proper advice on which funds have a performance track record. If you want to be an effective investment adviser, then you too have to know how to measure & evaluate the performance of the different funds that are available to the investor. The need to compare different fund’s performance required the advisor to have the knowledge of the correct & appropriate measure of evolution the fund performance. Performance Measures  Peer Group Companies  The Income Ratio Industry Exposure & Concentration NPA s Assuming an Entry Load of 2% in NAV Computation Sale Price=14.80/ (1-0.02) =15.10
  • 31. 31  Besides NAV Growth  Expenses Ratio  Concepts of benchmarking for performance evolution  Performance benchmarking in the Indian Contest  Active Fund Performance against market indices as bench Mark  Debt Fund-interest rate on alternative investment as bench Mark.  Total Return Index  Money Market Funds Short Term Govt. Instrument Interest rates as benchmarks.  Tracking a fund’s performance Newspaper, Periodicals, Research, Annual Report, Prospectus, Reports from Tracking agencies, Internet & Interpretation of Data. Other Parameters  Expense ratios - indicates fund efficiency and cost effectiveness  Portfolio Turnover ratio - measures amount of buying and selling done by the fund  Transaction cost  Fund size  Cash holdings Working of Mutual Fund and their Performance It needs to be certified that MF invest their funds in Capital market instruments such as Shares, Debentures, Bonds, & Money Market Instruments & therefore the NAV of such investments will reflect the market values of underlying assets. These Market values fluctuate & therefore the NAV of the MF Schemes also fluctuate. All the capital market instruments have varying degrees of risk, the Degree of risk being the highest in equities & the risk factor is highlighted in the respective offer documents as well as in the abridged offer documents. The investors therefore are in the full knowledge & understanding of the risks involved in various schemes. As per SEBI Regulation all MF disclose their portfolio periodically & all open-ended Funds offer exit option to investors at NAV based price. Risk, Tolerance, Return Expected Focus Suitable Products Benefits Offered by Mutual Fund Low Debt Bank/Company FD, Debt Funds Liquidity, Better Post-Tax Return
  • 32. 32 Medium Partially Debt, Partially Equity Diversified Funds Balanced Funds, FD’s, Shares, etc. Liquidity, Better Management Diversification High Equity Equity Funds (Sector as well as Diversified) Diversification, Expertise in Stock Picking, Liquidity Tax Free Dividend The Risk Return Tradeoff Introduction to Bond Fund Bond market which is also known as debt market or credit market is a financial market where participant can issue new debt known as primary market or buy and sell debt securities known as secondary market. This is usually in the form of bonds but it may include notes, bills, etc. and the primary goal of the bond market is to provide funding for public and private Expenditures. The various types of bond Markets includes corporates, Government Agency, Municipal, Mortgage backed, Asset backed and Funding. The participant of the bond market is considered to be very similar to the participants in most of the financial market and are either buyers of the funds or the sellers of the funds and often both the participants include Institutional Investors, Government, Traders, Individual. Just becausethe specificityof individual bond issueand the lackof liquidity in many smaller issue, the majority of outstanding bonds are held by the institutions like pension fund, Banks and Mutual Funds. Ris k Potentialfor Return Debt Funds Hedge Funds Growth Funds Sectoral funds Balanced Funds Liquid Funds
  • 33. 33 Indian Debt Market as on April 29, 2016 Security Type No. of Securities Market Capitalization(Cr) % of Total Government Securities 113 26825814.81 45.15 PSU Bonds 1105 4984682.3 8.39 State Loans 1965 15554381.14 26.18 Treasury bills 49 3580939.34 6.03 Local bodies 17 29750 0.05 Financial Institutions 208 997859.23 1.68 Bank Bonds 559 2990407.87 5.03 Corporate bonds 3140 4441718.86 7.48 Supranational Bonds 10 4997.44 0.01 Mutual Funds 6 7502 0.01 Preference shares 1 1250 0 Debt Market Review for the Month till April, 2016 In comparison to the last year Data It has been noticed that there has been seen a huge increase (49.45%) in the issue size of Supra Institutional Bonds (A supra institutional Entity is formed by two or more central Governments with the purpose of promoting Economic development for the member Countries and those institutions finance their activities by issuing supra Institutional Bonds) Because of the tie ups with other Countries for the economic Growth. The Corporate Debt has also got increased by 21.34% which shows that the investors are increasing their investment in the “CORPORATIONS”. Also there has been slight decrease in the Government bonds (-7.85%) which has happened due to the change in the interest rates by the Reserve Bank of India. Also there has been increase in the investment in the state Government Government Securities 45% PSU Bonds 8% State Loans 26% Treasury bills 6% Local bodies 0% Financial Institutions 2% Bank Bonds 5% Corporate bonds 8% Supranational Bonds 0% Preference shares 0% Market Share of DifferentSecurities Government Securities PSU Bonds State Loans Treasury bills Local bodies Financial Institutions Bank Bonds Corporate bonds Supranational Bonds
  • 34. 34 Bonds (20.09%) which will happen only if the return is high or Fresh issue of Securities has been made by the Government. About Kotak Bond Fund Kotak Bond is an open ended debt scheme which was launched on 25th November 1999, with an investment objective to create a portfolio of debt and money market instruments of different maturities so as to spread the risk across a wide maturity horizon and different kinds of issuers in the debt market. The investment objective of the Kotak Bond Fund is to create a portfolio of Debt and money market instrument of different Maturities so as to spread the risk across a wide maturity horizon and different kind of issuers in the debt market. The scheme offers a play on interests rates by managing duration actively. Duration is increased if the view is that of falling interests rates and vice-versa. The scheme also seeks to provide stable returns in the long term by managing credit risk actively. The Portfolio is well diversified with a mix of good credit quality debentures, bonds and government securities. It is suitable for investors who seek the high accrual offered by long term Papers, have a view on interest rates and have a long term Investment horizon. Fund Overview Kotak Bond fund has been ranked 3rd in debt long term by CRISIL for the quarter ended March, 2016. This Fund is an open ended debt scheme which was launched on November 25th,1999 with the aim to create a portfolio of debt and the money market instruments. This fund is suitable for the investor who are seeking income over a long investment horizon and investment in debt and money market securities. This scheme is being managed by Mr. Abhishek Bisen. He is also managing other debt schemes such as Kotak Balance Fund (April 15, 2008); Kotak Monthly Income Plan (April 15, 2008); Kotak Bond (Plan A) (April 15, 2008); Kotak Gilt Investment (Regular and PF Trust) (April 15, 2008); Kotak Global Emerging Market Fund (April 15, 2008); Kotak Multi Asset Allocation Fund (January 21, 2011); Kotak Equity Savings Fund (October 13, 2014); Kotak Gold ETF (July 27, 2007); Kotak Gold Fund (March 25, 2011). The Asset Under Management of Kotak bond Fund as on April 30th, 2016 is Rs. 4164.57 Crores and the AAUM as on April 30th, 2016 is RS. 4294.17 Crores. The benchmark for this scheme is “CRISIL COMPOSITE BOND FUND INDEX”. There is no Entry or the Exit Load for this fund but the units issued on the Reinvestment of dividend shall not be subject to Exit Load. The minimum investment for his plan is Rs. 5000 and the Additional Investment of Rs. 1000 in multiples of Re.1. The Standard deviation for this scheme is 4.38% which shows that the risk is moderate in this scheme and make this scheme less risky as compared to other debt Scheme Provided by Kotak Mahindra Asset Management Company Limited. Coming to the yield on Maturity, The YTM of this scheme is 8.09%. The Portfolio Modified duration for this scheme is 8.19 years and Average
  • 35. 35 Maturity is 16.17 Years which means that the securities which the company is holding has average maturity time of 16.17 Years. Investment Objective The Investment aims to create a portfolio of debt instrument of different maturities so as to spread the risk across a wide maturity horizon and different kind of issuers in the debt market. The wholesale plan is targeted at big ticket investors and corporates. Investment Strategy In the figure, Matrix shows the risk associated with the scheme and the tenure of the scheme after which the maturity will arrive. Kotak Bond fund comprises of the mixture of all the debt instruments available in the debt market as it is considered to be the debt fund with high standard deviation which carries low risk. Investors prefer debt funds because: - 1. No TDS on Debt Fund Earnings 2. Returns are associated with the markets 3. SWP, SIP, STP instead of Lump Sum 4. Look out for lower Expense ratio payment 5. Consider Exit Load 0.2 4.7 4.4 7.2 9.4 6.3 9.1 0.4 3 3.6 6.6 8.6 6.2 6.5 0 2 4 6 8 10 1 Month 3 Month 6 Month 1 Year 2 year 3 Year 5 year Fund Return vs Category average (Debt long Term) Fund return Category Avg.
  • 36. 36 Kotak bond fund comprises of the various debt fund such as debt instruments, Debentures and bonds, Corporate Debt/Financial Institutions, PSU’s, Government dated Securities, Commercial Papers/Certificate of Deposits. On an average more than 80% of the allocation of the funds is done using Government securities which carries a fixed amount of interest and these are the long term papers with a maturity period of 15-20 years. Next comes the Debentures, CP’s, CD’s and bonds which account for 13%- 15% of the portfolio. Then comes the term deposits, reverse repo and Net Current Assets which accounts for the rest of the investment in the Portfolio. Asset Allocation The major part of assets is being allocated in the Debt securities which account for nearly 97% of assets (April 2015 -April 2016) and other assets account for 3% of the allocation. Top 5 instruments of Kotak Bond Plan Instrument % Allocation Valuation (INR Crores) GOI Securities 54.29% 2651.17 Central Government loan 14.34% 700.27 State Development loan 13.03% 636.30 Non-Convertible Debenture 7.83% 382.37 Debenture 4.24% 207.05 The allocation of the debt fund consists of Government securities which account for more than 50% of share in the Portfolio just because it is considered to be the safest security in the money market because of the nature suchas the holder willbe exempted from tax and all.Second comes Scheme Facts Launch Date 25-Nov-1999 Structure An Open Ended Debt Scheme Benchmark CRISIL Composite Bond Fund Index Minimum initial investment Rs.5000 and in multiple of 1 for purchase and .01 for switches Additional Investment Rs.1000 and in multiples of Rs. 1 Standard Deviation 4.11%(as on June 30, 2015) Source: Value Research YTM 8.29% Portfolio Modified Duration 8.29 Years Average Maturity 17.97 Years
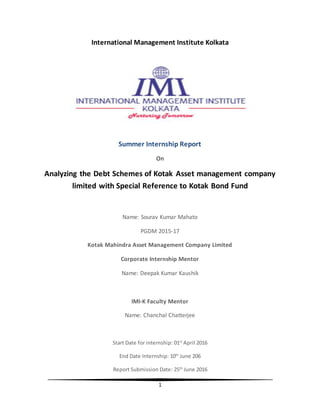
  • 37. 37 the central government loan and State Development Loan who raise the capital from the market by issuing the commercial papers and Certificate of deposits and giving them a fixed amount of interest on such instruments Scheme Return vs. Benchmark Return November 25, 1999 (since inception) Here, Kotak Bond fund since its inception (25th November 1999) has given positive and higher YTM (Yield to Maturity) when compared to the benchmark (CRISIL Composite Bond Fund) and the additional benchmark (CRISIL 10-year Gilt). During the period “March 31st, 2013 to March 31st, 2014”, CRISIL 10 Years Gilt has shown a negative return of (0.96%) but here despite of negative return shown by the benchmark, Kotak bond has shown a positive YTM of 1.71% which shows that fund and Fund Manager is doing wellkeeping in mind the market Performance. During the year 2015-2016 due to change in the interest rates by the federal reserves, the performance has gone down and Kotak has underperformed in comparison to the benchmark and additional benchmark because maximum allocation of the securities in this scheme is done in the government securities and Government debentures and bonds. So, the change in the interest rates has affected the performance and YTM has come down when the return has been compared to its benchmark. But during the next Financial year, Kotak Bond Fund has outperformed with his benchmark and additional Benchmark because of the changes in the allocation of the securities by the fund Managers in the existing portfolio of the scheme. Return Analysis 9.18 5.32 15.87 1.71 0 8.24 14.59 4.39 0 7.97 14.57 -0.96-2 0 2 4 6 8 10 12 14 16 18 25-Nov-99 Mar 31, 2015 to 2016 Mar 31, 2014 to 2015 Mar 31, 2013 to 2014 Scheme vs Benchmark Scheme Returns crisil Composite bond fund crisil 10 year gilt 11.065675 11.065675 10.9851
  • 38. 38 10.681175 11.065675 10.9851 11.08854 FY 2011-2012 FY 2012-2013 FY 2013-2014 FY 2014-2015 Quarterly Dividend Linear (Quarterly Dividend) 11.065675 10.9851 11.08854 10.9496 FY 2012-2013 Fy 2013-2014 FY 2014-2015 FY 2015-2016 Quarterly Dividend Linear (Quarterly Dividend) Quarterly Dividend during each Financial Year
  • 39. 39 The above graphs show the Average quarterly dividend provided to the investors during each financial year of Kotak Bond Fund. The data shows the increase in the amount of dividend provided by the scheme year on year. The straight line depicts the rise in the dividend yield by the fund and the half straight line depicts the standard deviation which means the standard error taking place will lie on that half straight line. If the dividend lies below or above the line, then it will be called the abnormal return provided by the scheme. Here, during the financial year 2010-201, the scheme has given an abnormal return on the investment made by the investors that is Rs. 10.49055 which lies below the line of standard deviation (also known as standard error line). Again, during the financial year 2014-2015, the scheme has given an abnormal return of Rs. 11.08854 which lies above the standard error line. Also during the financialyear 2012-2013 Kotak Bond fund has given abnormal return, that is return more than average. So, here the conclusion derived is that an average return by the scheme helps the industry to grow and manage the assets in a better way. 10.843975 10.49055 10.681175 11.065675 10.9851 11.08854 10.9496 FY 2009- 2010 FY 2010- 2011 FY 2011- 2012 FY 2012- 2013 FY 2013- 2014 FY 2014- 2015 FY 2015- 2016 Return (Dividend) 2009-2016 Linear (Return (Dividend) 2009-2016)
  • 40. 40 7% 3% 86% 1%3% PortfolioComposition as on March 30th, 2015 Corporate Debt/Financial Institutions Public Sector Undertakings Government Dated securities Collateral borrowings and Lending Obligations Net Current Assets/Liabilities Portfolio Action as on June 30th, 2015 Portfolio Action as on 30th June 2015  Bond scheme works on an asset allocation model of 70:30 where Fund Managers take active duration call through Gilt Investment. The Balance is invested in corporate bonds segment in order to provide yield cushion to guard the fund against the volatilities.  As the long bond yield also rose during the month of June, they increased the weight on 30 years SOA Bonds marginally maintaining the gilt exposure at around 83% and the balance continues in the bond. Consequently, the duration also went to 17.97 Years, Modified duration 8.29 Years and the YTM of 8.29%  They continue to stay overweight in 14-30 Years segment in gilts and 7-10 Years in the corporate bonds. They believe that these are the optimal points on the yield curve. Top 10 Companies as on June 30th, 2015 8.30% Central Government SOV 29.12% 8.17% Central Government SOV 11.55% 9.20% Central Government SOV 11.19% 8.15% Central government SOV 9.21% 8.24% Central Government SOV 6.50% 8.28% Central Government SOV 5.88% 1.44% Central Government SOV 3.75% 7.95% Central Government SOV 3.41% HPCL Mittal Energy Limited ICRA AA- 2.84% 7.88% Central Government SOV 2.61%
  • 41. 41 The fund is suitablefor the investors who seeks the high accrual offered by long term debt securities. It is also viable for those who have a view on the interest rates and have an investment horizon of 12 months and above. Quarterly AAUM and NAV (For the month of April 2015 – June 2015) Deposit Plan: Rs. 68.29 Crores Plan A: Rs. 4048.45 Crores Direct Plan: Rs. 1027.44Crores Quarterly Dividend: Rs. 10.6616 Quarterly Dividend direct: Rs. 11.2360 Half yearly Dividend Direct: Rs. 40.0962 Annual Dividend: Rs. 24.1540 Annual Dividend direct: Rs. 20.9515 Plan A bonus plan: Rs. 26.2802 Growth: Rs. 39.425 Growth Direct: Rs. 40.0962
  • 42. 42 Portfolio Action as on September 30th, 2015  Bond scheme works on asset allocation model of 70:30 where Fund Managers take active duration call through Gilt investment. The balance is invested in corporate bond segment in order to provide yield cushion to guard the fund against the volatilities.  The month of September was full with suspense and volatilities but the difference was this time yields fell sharply on the back of favorable FOMC and 50bps repo rate cut which was more than expected and RBI kept the room for more cuts open. However, since our portfolio was being made with this kind of outcome for a long period of time, however they increased the duration marginally much during this month. Consequently, the duration also went to 17.88 years, Modified duration 8.50 and YTM of 7.92%.  They continue to stay overweight in the 14-30 years’ segment in Gilt and 7-10 years in the corporate bonds. We believe that these are the optimal points on the yield curve.  Due to 50bps cut in the repo rate by RBI the value of the existing paper in the market has gone up, which is the reason giving extra weight to the Government securities in the portfolio. 5%3% 88% 3%1% PortfolioComposition as on September 30th, 2015 Corporate Debt/Financial Institutions Public Sector Undertakings Government Dated securities Collateral borrowings and Lending Obligations Net Current Assets/Liabilities
  • 43. 43 Deposit Plan: Rs. 62.71 Crores Plan A: Rs. 3963.05 Crores Direct Plan: Rs. 1100.15Crores Quarterly Dividend: Rs. 10.9396 Quarterly Dividend direct: Rs. 11.5315 Half yearly Dividend Direct: N/A Annual Dividend: Rs. 25.2363 Annual Dividend direct: Rs. 21.9328 Plan A bonus-plan A: Rs. 27.4578 Growth Plan A: Rs. 41.1911 Growth Direct Plan A: Rs. 41.9743 Top 10 Companies as on September 30th, 2015 7.88% Central Government SOV 29.12% 8.30% Central Government SOV 11.55% 8.24% Central Government SOV 11.19% 8.17% Central government SOV 9.21% 9.20% Central Government SOV 6.50% 1.44% Central Government SOV 5.88% 8.13% Central Government SOV 3.75% HPCL Mittal Pipeline Limited ICRA AA- 3.41% HPCL Mittal Energy Limited ICRA AA- 2.84% Bank of India Brickwork BWR AA+ 2.61% Quarterly AAUM and NAV (For the month of June 2015 – September 2015)
  • 44. 44 Portfolio Action as on December 31st, 2015  Bond scheme works on assetallocationmodel of 70:30, where Fund Managers take active call through Gilt investment. The balance is invested in corporate bonds segment in order to provide yeild cushion to protect the fund against the volatilities.  The month of december was a volatilemonth and market was grappling with concerns on fiscal slippage and power bonds the 10 year G-secs yeild remain flat month on month while the less than 10 years yeild came down and more than 10 years went up. However, since our portfolio was overweight on the long bonds it was hurt adversly.  They reduce the risk from the portfolio it was in time probably we should have been more aggressive but we believe that that as absolute levels are high and therefore it’s a risky bet to stay out given such a strong macro.  We were able to sell in time but believe we covered it too soon.  We took the Average maturity duration down to 14.65 years, modified duration 7.25 years and YTM of 8.12% Top 10 Companies as on December 31st, 2015 7.73% Central Government SOV 29.12% 8.24% Central Government SOV 11.55% 8.17% Central Government SOV 11.19% 4%2% 78% 8% 8% PortfolioComposition as on December 31st, 2015 Corporate Debt/Financial Institutions Public Sector Undertakings Government Dated securities Collateral borrowings and Lending Obligations Net Current Assets/Liabilities
  • 45. 45 7.59% Central government SOV 9.21% 7.78% Central Government SOV 6.50% 1.44% Central Government SOV 5.88% HPCL Mittal Energy limited SOV 3.75% Bank of India ICRA AA- 3.41% 8.13% Central Government ICRA AA- 2.84% 8.83% Central Government Brickwork BWR AA+ 2.61% Quarterly AAUM and NAV (For the month of September 2015 – December 2015) Plan A: Rs. 5053.53 Crores Direct Plan: Rs. 5076.33 Crores Quarterly Dividend Plan A: Rs. 10.8203 Quarterly Dividend Direct Plan A: Rs. 11.4092 Annual Dividend Plan A: Rs. 24.9920 Annual Dividend Direct Plan A: Rs. 21.7654 Bonus Plan - Plan A: Rs. 21.9328 Growth - plan A: Rs. 27.4578 Growth Direct Plan A: Rs. 41.6535
  • 46. 46 Portfolio Action as on March 31st, 2015  Bond scheme works on an asset allocation model of 90:10, where Fund managers take active duration call through gilt investment and the balance is invested in corporate bond segment.  This is done in order to provide yield cushion to protect the fund against the volatilities while also position the funds to capture duration-related gains. We increase our allocation to G-sec to take advantage of market sell off as we believe that negatives are priced in.  The month of march begin with bullish tone and sustained due to series of events which occurred during the month and led to marvelous rally in the G-sec and bond market.  The curve entered in a bull flattening mode in 10-30 years’ segment as we were anticipating and were positioned to gain therefore we booked some profit ahead of monetary policy and switched in SDL to the tune of 20% of the scheme that not only gave profits but also increase YTM of the fund.  They took at the SDL at 75 bps spread over G-sec and we expect it to compress to 50 bps. This activity led to reduction in duration of the fund.  The fund duration is at 13.43 years, Modified Duration 6.85 Years, and YTM of 8.26%. 13% 10% 66% 0%-5%4%1%1% PortfolioComposition as on March 31st, 2016 Corporate Debt/Financial Institutions Public Sector Undertakings Government Dated securities Collateral borrowings and Lending Obligations Net Current Assets/Liabilities Futures Reverse Repo
  • 47. 47 Quarterly Dividend Plan A: Rs. 11.0420 Quarterly Dividend Direct Plan A: Rs. 11.6430 Annual Dividend Plan A: Rs. 25.7611 Annual Dividend Direct Plan A: Rs. 21.6871 Bonus Plan - Plan A: Rs. 28.0284 Growth - plan A: Rs. 42.0471 Growth Direct Plan A: Rs. 43.0226 Top 10 Companies as on March 31st, 2015 7.73% Central Government SOV 33.37% 8.17% Central Government SOV 9.80% 8.24% Central Government SOV 9.70% Bharti Enterprises (Holding) Pvt. Ltd. Crisil A1+ 7.59% 8.50% State Government SOV 4.78% Bank of Maharashtra Crisil A1+ 3.73% 8.45% State Government SOV 2.83% 8.22% State Government SOV 2.61% 8.65% State Government SOV 2.61% 8.62% State Government SOV 2.39% Quarterly AAUM and NAV (For the month of December 2015 – March 2016)
  • 48. 48 Monthly Dividend for the Financial Year 2015-2016 The above graph shows the monthly dividend received by the individual investors and the other investors (other investors includes the indirect clients, HUF’s, etc.) The linear dividend per unit is following the downtrend and is decreasing slowly and steadily, But Because the dividend is lying within the standard error bar, there is a low probability that the investors will pull off their investments because of the very low risk associated by the debt fund and that too the dividend is lying within the standard error. The other investors are considered to be the indirect clients who use to make their investment with the help of any other individual such as IFA’s (Independent Financial Advisor), ND’s (National Distributors), etc. and the person use to take a certain amount of commission to service them. This is the main reason why direct dividend use to be higher than indirect dividend. 5.1822 2.923 3.8653 6.2894 7.2844 4.5169 1.4333 5.705 2.4429 4.4278 4.8012 2.7081 3.5811 5.827 6.7489 4.1848 1.3279 5.2856 2.2633 4.1023 Individual (Per unit) Others (Per unit) Linear (Individual (Per unit)) Dividend for the month of September and October has not been Declared
  • 49. 49 Glossary  Asset Allocation Fund- A Fund that spreads its portfolio among a wide variety of investments, including domestic & foreign Stocks & Bonds some of these funds keep the proportions allocatedbetween different Sectors relativelyconstant, while others alter the mix to market conditions.  Adjusted NAV- The Net Asset Value of a unit adjusting for all changes caused due to divided declaration, bonus, etc. assuming reinvestment of distributions made to the investors at the prevailing NAV.  AlphaCo-efficient-It is the excess return of fund above risk adjusted market return, given its level of risk as measured by Beta. An Investment with a positive indicates that the fund has underperformed, for the level of risk taken by it.  Annual Report- It is yearly record of a MF Performance in a Current Year. Under SEBI s guidelines, it is distributed to investors &/or Share Holders.  Asset Allocation- It is a means of diversifying the risk associated with a Fund & refers to the distribution of total funds available with the fund into instruments of various types such as Stocks, Bonds etc. based on the Fund’s investments objectives.  Asset-Backed Securities- Securities that represent a participation in, or are secured by & payable from, payments generated by Credit Cards, Motor Vehicle or trade receivables & the like.  Asset Mgmt. Company (AMC)- It is the Investment Manager for a MF. It is a Company set up primarily for managing the investment of MF & makes investment decisions in accordance with the Schemes Objectives, deed of Trust & Other provisions of the Investment Mgmt. Agreement.  Automatic Investment Plan- A Plan introduced in MF that enables the Investor to give the mandate of allotting fresh units at specified intervals (Monthly, Quarterly) against which the investor provide postdated Cheque On the specified dates, the Cheque are realized by the MF & on realization Additional Units are allotted to the investor at the prevailing NAV.  Balanced Funds- A Class of MF that aims at allocating the total assets with it in the portfolio mix of debt as well as equity instruments.  Basis Point- Most often used relating to changes in interest rates. One Basis Point in 1/ 100 of a percentage point; therefore 1000 Basis Points make 1%. A phrase used to describe the difference in Bond Yields. Ex. If Bond a Yields 7.5 & Bond B Yields 7.25. Then the difference is 0.25 is a Basis Point.  Benchmark- It is the platform or the parameter with which a scheme can be compared. For e.g. the performance of anindex fund canBenchmarked againstthe appropriate index specified by it.
  • 50. 50  Beta - It is the measure of a Relative Sensitivity of a Stock or MF to a Market. The market is assigned an of 1. The higher the, more sensitive the Stock or fund is considered to be Relative to the market as a whole. In other words, funds with more than 1 will react more to any fluctuations (whether upward or downward) in Market than funds with B less than 1.  Bond Fund- A MF whose portfolio consists primarily of corporate, Municipal or Govt. Bonds. These funds generally emphasize income rather than growth.  Capital Appreciation Fund- A MF that seeks maximum Capital Appreciation by investing in Companies that do not pay dividends. These Funds may use techniques involving greater than ordinary risk, such as borrowing money in order to provide leverage, short selling & high portfolio turnover.  Consumer Price Index (CPI)- An inflation tracker, much followed by the mainstream media. It is the measure of the price change in consumer goods & services.  Contingent Deferred Sales Charge (CDSC)- It is the sales load charged by funds in the event of redemption made within a pre-specified period of purchase.  Cut off Time- In respect of all MF regulated by SEBI, fresh subscriptions & redemptions are processed at a particular NAV. Every fund specifies a cut off time in respect of fresh subscription & redemption of units. All requests received before the cut off times are processed at that day s NAV & thereafter at the next day s NAV.  Cyclical Stock- Stock of a company whose performance is generally related (or thought to be related) to the performance of an economy as a whole. Paper, steel & the automotive stocks are thought to be Cyclical because their earnings tend to be hurt when the economy slows & are strong when the economy turns up. Food & Drug Stocks, on the other hand, are not considered Cyclical, as consumers pretty much need to eat & care for their Health regardless of the performance of the economy.  Derivative- A Financial Contract whose value is derived from another underlying asset, such as Stocks,Bonds, Commodities, or a Market Index such as NSE 5O.The most common type of Derivatives is option, future & mortgage-backed Securities.  Diversification- Spreading a risk; MF spread investments among a No. of different Securities to reduce the risk inherent in investing.  Dividend Distribution Tax - A Tax payable by a debt oriented MF (a MF that invests more than 50% of its portfolio in a debt Market) before Dividend is distributed to the unit Holders. The Current Dividend Distribution Tax is 10% plus the 10% surcharge. There is no such Tax Applicable on Open-End Equity Schemes.  Duration- A Calculation of the Average Life of a Bond (or Portfolio of Bonds) i.e. a useful measures of a Bond s Price Sensitivity to interest rate changes. The higher duration No. the greater the risk & reward potential of the Bond.
  • 51. 51  Dollar- Cost Averaging- The Technique of investing a fixed sum at a regular intervals regardless of Stock Market movements. This reduces average Share Cost to the investor, who acquires more Shares in period of lower Security prices & fewer Shares in period of High prices. In this way, investment risk is spread overtime.  Entry Load - It is the Load Charged by Fund when one invests into other Fund. It increases the price of units to more than the NAV & is expressed as a percentage of NAV.  Equity Linked Savings Scheme (ELSS)- A special product offered by MF. These Schemes invest in equity i.e. Shares & generally have a lock-in period of 3 Yrs. The basic features of ELSS Schemes are: Taxrebate of 20% under Section 88 of the Income Tax Act on an (Maxi.) investment of Rs.10, 000/.  Exit Load - It is the load charged by the Fund, when one redeems the unit from the Fund. It reduces the price of the units to less than the NAV & is expressed as a % of NAV.  Exchange Traded Funds- Exchange traded funds are a hybrid of MF & Stock which track an underlying index. These funds have the flexibility of Trading throughout the day like a Security & also offers benefits like Diversification Professional Mgmt., low expense ratio, etc.  Fixed Income Securities-Bonds & other securities that are used by issuers to borrow money from investors. Typically, the issuer pays the investor a fixed, variable or floating rate of interest must repay the borrowed amount at a specified time in the future (Maturity).  Fund Manager- Appointed by the AMC, he/she is the person who makes all the Final Decisions regarding investments of a Scheme.  Govt. Securities These are medium to long-term obligations issued by RBI on behalf of Govt. of India& various State Govt. The RBI decides the cut-off coupon on the basis of the bids received. These Securities are issued by auction process on certain issues.  Gilt Funds- Funds that invest only in Govt. Securities of different Mature They offer lower returns as the credit risk is virtually absent & there are No chances of Govt. defaulting on its payment obligations.  Growth Style Investing- An investing approach that involves buying Stocks of Companies i.e. generally industry leaders with above average, sustainable growth rates. Typically, Growth Stocks are the Stocks of the fastest growing Companies in the most rapidly growing sector of the Economy Growth Stock valuation level (e.g.Price-to-earnings Ratio) will generally be higher than value Stocks.  Indexation - The Central Govt. specifies an index linked to the wholesale Price Index. The indices of 2 yrs. (Yrs. Of purchase & the yr. of sale) are used for the purpose Price is multiplied by the Index of the yr. of purpose.
  • 52. 52  Large- Cap Stocks- Stocks issued by large companies. Unless otherwise defined by Fund Manager or an Advisor, a Large-Cap Company is defined as one with a Market Capitalization of $5 Billion or more. Typically, large -cap companies are est. well-known Companies; some may be MNC s.  Mid-cap Stocks- Stocks issued by mid-sized companies, unless otherwise defined by a Fund Manager or the Advisor, a mid-cap company is defined as one with a Market Capitalization between $1.5 Billion & $5 Billion, this is similar to the range of the Std. & poor Mid-Cap 400 Index (S&P 400).  Money Market-It refer to Market for very Short- Term Securities. Money Market instruments are forms of Debt that mature in less than a yr. & are very liquid in nature. Securities such as Treasury bill & call Money makes up the Bulk of trading in Money Market.  Money Market Instruments- Treasury bill, GOI Securities Etc. with an unexpired Maturity less than or up to one yr. Call Money, Certificates of Deposits & any other instrument specified by the RBI.  Mortgage Backed Securities- Certificate backed by pooled Mortgages (e.g. Freddie Mac or Gennie Mae). Issuing agencies buy Mortgages from lending institutions & repackage them as Securities which they sell to investors. Yields, which stem from interest & principal on underlying.  Open-Ended Fund - Funds that do not have any fixed Maturity & are continuously open for subscription & redemption. The key features are Liquidity. One can convenient Buy & Sell the units held at NAV Price.  Statement of Additional Information (SAI) - It conveys information about an open /closed-end fund that is not necessarily needed by investors to make informed investment decision.  Yield to Maturity- Used to determine the Rate of Return on Investor such as a Bond is held to its Maturity date, takes into account purchase price, redemption value, time to Maturity, coupon yield & a time between Interest Payments.  Zero Coupon Bond- A Bond where no Periodic Interest payments are made. The Investor purchase the Bond at a discount price & receives one payment at Maturity. The Maturity value an Investor receives is equal to the Principal invested plus Interest earned Compound Semi-Annually at the Income from Zero-Coupon on Bonds is subject to Taxes annually even though no payments will be made.
  • 53. 53 Bibliography  NISM Work Book  EconomicTimes  Kotak AMC Fact Sheet  Kotak AMC OnePagers  NSE Manuals  ComplaintRedressalreport Websites: -  www.mutualfundindia.com  www.amfindia.com  www.moneycontrol.com  www.assetmanagement.kotak.com  www.valueresearchonline.com  www.investopedia.com  www.rediff.com  www.articles.economictimes.indiatimes.com  www.thehindubusinessline.com  www.capitalmarket.com  www.fintotal.com  www.fundsupermart.co.in  www.nseindia.com  www.morningstar.in  www.icra.in  www.investmentguruindia.com  www.business-standard.com  www.managementparadise.com