

Empfohlen
Weitere ähnliche Inhalte
Was ist angesagt?
Was ist angesagt? (17)
Ähnlich wie Final exam 2012 spring
Ähnlich wie Final exam 2012 spring (20)
Mehr von Sou Tibon
Mehr von Sou Tibon (16)
Kürzlich hochgeladen
Kürzlich hochgeladen (20)
Final exam 2012 spring
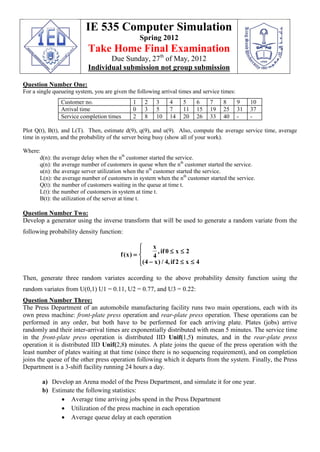
- 1. IE 535 Computer Simulation Spring 2012 Take Home Final Examination Due Sunday, 27th of May, 2012 Individual submission not group submission Question Number One: For a single queueing system, you are given the following arrival times and service times: Customer no. 1 2 3 4 5 6 7 8 9 10 Arrival time 0 3 5 7 11 15 19 25 31 37 Service completion times 2 8 10 14 20 26 33 40 - - Plot Q(t), B(t), and L(T). Then, estimate d(9), q(9), and u(9). Also, compute the average service time, average time in system, and the probability of the server being busy (show all of your work). Where: d(n): the average delay when the nth customer started the service. q(n): the average number of customers in queue when the nth customer started the service. u(n): the average server utilization when the nth customer started the service. L(n): the average number of customers in system when the nth customer started the service. Q(t): the number of customers waiting in the queue at time t. L(t): the number of customers in system at time t. B(t): the utilization of the server at time t. Question Number Two: Develop a generator using the inverse transform that will be used to generate a random variate from the following probability density function: f x x if x x if x ( ) , ( ) / , 4 0 2 4 4 2 4 Then, generate three random variates according to the above probability density function using the random variates from U(0,1) U1 = 0.11, U2 = 0.77, and U3 = 0.22: Question Number Three: The Press Department of an automobile manufacturing facility runs two main operations, each with its own press machine: front-plate press operation and rear-plate press operation. These operations can be performed in any order, but both have to be performed for each arriving plate. Plates (jobs) arrive randomly and their inter-arrival times are exponentially distributed with mean 5 minutes. The service time in the front-plate press operation is distributed IID Unif(1,5) minutes, and in the rear-plate press operation it is distributed IID Unif(2,8) minutes. A plate joins the queue of the press operation with the least number of plates waiting at that time (since there is no sequencing requirement), and on completion joins the queue of the other press operation following which it departs from the system. Finally, the Press Department is a 3-shift facility running 24 hours a day. a) Develop an Arena model of the Press Department, and simulate it for one year. b) Estimate the following statistics: Average time arriving jobs spend in the Press Department Utilization of the press machine in each operation Average queue delay at each operation
- 2. IE 535 Computer Simulation Spring 2012 Take Home Final Examination Due Sunday, 27th of May, 2012 Individual submission not group submission Average time in the Press Department of those arriving plates that join first the rear- plate press operation, and then proceed to the front-plate press operation Question Number Four: A computer store maintains a maximal inventory of 30 fax machines (units). On average, one unit is sold per day, but some days experience a burst of customers. A marketing survey suggests that customer interarrival times are IID exponentially distributed with rate 1 per day. When the inventory drops down to 10 units on-hand, an order of 20 units is placed to the supplier, and the order arrives in 5 to 10 days, uniformly distributed. Unsatisfied customers check back with the store and wait for the order to arrive (backordering case). Develop and Arena model of the computer store, and simulate it for six month (9:00 AM to 5:00 PM), and answer the following questions. a) What is the average stock-on hand? b) What is the average backorder level? c) What percentage of the time the store runs out of stock? Note that this is the probability that a customer’s order is not satisfied and is backordered (due to the Poisson arrival process). d) What is the percentage of time the stock on-hand is between 10 and 30 units? e) Does the inventory ever reach 30 units? If it does, for what percentage of time? Question Number Five: The bank opens at 8 AM and closes at 4 PM on weekdays. Customers arrive at the bank according to IID exponentially distributed inter-arrival times with the following time-dependent rates. 20 per hour between 8 AM and 11 AM 35 per hour between 11 AM and 1 PM 25 per hour between 1 PM and 4 PM Customers come to the bank for various reasons. Data collection shows that 50% of the customers come to withdraw money, 30% come to deposit money, and 20% come for other bank services. Histograms of the empirical data suggest the following service-dependent distributions of customer service times: Money withdrawal: Unif(3, 5) minutes Money deposit: Unif(4, 6) Other Services: Tria(5,13,18) minutes All service times are IID. There are 2 tellers serving a single queue for both withdrawal and deposit services, and 2 bank officers serving another single queue for all other services. a) Develop an Arena model for the bank, run it for one day, and estimate customer mean waiting times. b) Run 10 replications of the model, and obtain point estimates and 95% confidence intervals (manually) for the waiting times in each of the two queues. Repeat the estimation procedure using 20 replications, and compare the results to those of (a). c) Using the Arena Output Analyzer, test the hypothesis that the waits in the two queues have the same means.
- 3. IE 535 Computer Simulation Spring 2012 Take Home Final Examination Due Sunday, 27th of May, 2012 Individual submission not group submission Question Number Six: Consider the following production system, producing printed circuit boards. Units arrive with IID exponential inter-arrival times of mean 2.2 hours. Arriving boards have two parts: Part 1 and Part 2. Upon arrival, parts separate and proceed to their respective processes separately, in two branches. Part-1 units proceed along the first branch to a chemical disintegration process followed by a circuit layout 1 process, which are separated by a buffer of 3-unit capacity, and all processing times are IID uniform between 1 and 2 hours. Part-2 units proceed along the second branch to an electromechanical cleaning process followed by a circuit layout 2 process, which are separated by a buffer of 3-unit capacity, and the corresponding processing times are IID exponentially distributed with means 1.4 and 1.5 hours, respectively. An assembly workstation then picks one unit from each branch and assembles them together in an operation that lasts precisely 1.5 hours. Assembled units proceed to a testing station where batches of 5 units are tested simultaneously. Testing times are IID triangularly distributed with parameters 6, 8, and 10 hours. After testing, batches are split into individual units, which then depart from the system. After every 8-hour period, all processes shut down for a 1-hour maintenance operation. The following random stoppages are observed in each process. Station Name Failure Type Time between Failure (in hours) Time to Repair (in hours) Disintegration Random Expo(1/20) Unif(1,2) Cleaning Random Expo(1/30) Beta(5,1) Layout 1 Random Expo(1/25) Unif(2,5) Layout 2 Random Expo(1/25) Beta(5,1) Testing Adjustment Adjustment Every 200 units Tria (1,3,4) Recall that in Arena, the parameters of the beta distribution are in reverse order, and the parameter of the exponential distribution is the mean (not the rate). a) Develop an Arena model for the production system, and simulate it for one year of operation. b) Estimate the following statistics a. Utilization for each process b. Average delay at each process c. Blocking probabilities at the disintegration and cleaning workstations d. Average system flow time of assembled units e. Distribution of the number of jobs in the two layout buffers f. Distribution of the system flow time of assembled units g. Probability that the system is in maintenance h. State probabilities of each process (blocked, idle, busy, failed, and maintenance) Question Number Seven: The production of various metal kitchen pots and utensils calls for metal sheet processing. KitchenWare Inc. (KWI) is a company producing a number of metal kitchen products. KWI’s shop floor has 3 major sheet processing areas. These are shearing, press brake forming, and deep drawing. Shearing is a process
- 4. IE 535 Computer Simulation Spring 2012 Take Home Final Examination Due Sunday, 27th of May, 2012 Individual submission not group submission where roughly sized metal sheet pieces are cut from rolls of sheet metal. The company uses various sizes of sheet metal rolls. Press brake forming is a type of bending and forming operation. Also, deep drawing is an operation that makes a suitably deep sheet metal piece to make pots, pans, and food and beverage containers. The shop floor houses 2 shear press machines, 2 press forming machines, and 1 deep drawing machine. KWI’s products are categorized as (1) pots and plates, and (2) pitchers. These 2 categories of products have individual process plans and processing times as shown below. Product Category Process Plan Unit Processing Times (in Seconds) Pots and Plates Shearing Press Forming Deep Drawing 10 18 30 Pitchers Shearing Press Forming 12 24 The distances between workstations (in feet) are given in the diagram below (distances are the same in each direction). Part transportation among workstations is handled by 2 fork trucks, which run at a speed of 5 feet/second. Each truck can carry a batch of 10 items. When a job is completed at Shearing or Press Forming workstations, it is placed into an output buffer. As soon as 10 units of the same type accumulate in the output buffer, they are batched, and a request is made for a fork truck. Once a batch is taken to the Press Forming station, it is split into its original items, and each item is placed into an input buffer. In contrast, in the Deep Drawing workstation, batches are not split into individual units, but rather are processed in batches of 10 units at a time. After their last operation (Press Forming or Deep Drawing), batches of 10 items are taken to the shop exit whence they leave the shop floor in batches. The shearing and press forming processes are subject to random failures, with uptime and downtime statistics given in the following table. ARRIVAL PRESSING Shop EXIT DRAWING SHEARING 400 400 400 400 200 30 500 250
- 5. IE 535 Computer Simulation Spring 2012 Take Home Final Examination Due Sunday, 27th of May, 2012 Individual submission not group submission Process Name Up Time (in minutes) Down Time (in minutes) Press Forming Expo(1/4800) Unif(2,4) Deep Drawing Expo(1/600) Unif(1,3) Recall that in Arena, the parameter of the exponential distribution is the mean (not the rate). a) Develop an Arena model of the shop floor of KWI and simulate it for a period of 5 days of continual operation b) Estimate the following statistics at each station: i. Job flow times per type through the shop floor ii. Machine utilization and down times iii. Job delays in the queue of each process Question Number Eight: Answer the following questions: c) What is the difference between analytical solution and simulation? d) What is the danger in not using the right probability distribution? Support you answer with an example. e) Define the following: i. Scale parameter (). ii. Shape parameter (). f) What is the basic tool to generate random variates? g) List at least five well-known simulation languages. h) What is the difference between terminating and non-terminating simulations? i) What is the difference between transient and steady states? Demonstrate the difference with an example? j) In terminating and non-terminating simulations, How do determine the initial conditions for both? Support your answer with examples.
- 6. IE 535 Computer Simulation Spring 2012 Take Home Final Examination Due Sunday, 27th of May, 2012 Individual submission not group submission Report Format for network modeling for Arena problems Reports Format for Arena problems should follow the following format: 1. PROBLEM STATEMENT (in your own words) including objectives. This section should be understandable by someone who is not familiar with Arena, and hence you should minimize the amount of technical details relating to the problem. Any assumptions about the situation should be listed. A diagram might be worthwhile in this section. 2. MODEL DESCRIPTION. This section reviews the techniques that you used to model the situation and lists all technical modeling assumptions. This section should include the following: a. NETWORK DIAGRAM (as a figure) and explanation. b. Arena VARIABLES used in the model (list the variable name, its definition, its initial condition, etc. in columns). c. FILE DESCRIPTIONS. This section will list all the files (e.g., a file associated with a queue) used in the program along with the file number and usage. 3. PRESENTATION OF RESULTS. The results which are relevant to the objectives stated in Section 1 should be presented here. This should not be simply the Arena output report. The important results from the simulation should be presented in tables, graphs, pie diagrams, etc. 4. ANALYSIS OF RESULTS. This section should reflect the fact that after the simulation model was coded and debugged, time was spent thinking about the output from the model. You should do whatever quantitative work (e.g., hypothesis testing) is appropriate. 5. CONCLUSIONS. As with Section 1, this section should be readable by a non-technical person. It should state the conclusions drawn from you study. APPENDIX; Arena INPUT STATEMENTS AND OUTPUT REPORT. This appendix to the report contains the INPUT STATEMENTS and OUTPUT REPORT cut to page size. Please start as early as possible on this on developing your model. Code should be written as early as possible that will allow enough to debug the program and write up a report. Make sure to leave time to proofread your report. Points will be deducted for spelling and grammatical errors.