
Empfohlen
Weitere ähnliche Inhalte
Was ist angesagt?
Was ist angesagt? (20)
Ähnlich wie Download here
Ähnlich wie Download here (20)
Download here
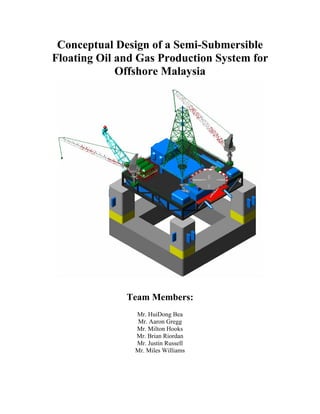
- 1. Conceptual Design of a Semi-Submersible Floating Oil and Gas Production System for Offshore Malaysia Team Members: Mr. HuiDong Bea Mr. Aaron Gregg Mr. Milton Hooks Mr. Brian Riordan Mr. Justin Russell Mr. Miles Williams
- 2. OCEN 407 Design Class Team Malaysia i Table of Contents________________________ Nomenclature...................................................................................................................... ii List of Figures .................................................................................................................... iii List of Tables ..................................................................................................................... iv Executive Summary ............................................................................................................ 1 Overview......................................................................................................................... 1 Competencies.................................................................................................................. 1 General Arrangement and Overall Hull Design.......................................................... 2 Local and Global Loading .......................................................................................... 2 Weight, Buoyancy, and Stability ................................................................................ 3 Hydrodynamics of Motions and Loading ................................................................... 4 General Strength and Structural Design ..................................................................... 4 Mooring....................................................................................................................... 5 Cost ............................................................................................................................. 6 Regulatory Compliance .................................................................................................. 7 Acknowledgements............................................................................................................. 7 Introduction......................................................................................................................... 7 Objectives ......................................................................................................................... 10 Design Basis...................................................................................................................... 11 Design Methodology......................................................................................................... 12 General Arrangement and Overall Hull Design............................................................ 12 Wind and Current Loading ........................................................................................... 14 Local and Global Loading ............................................................................................ 15 Weight, Buoyancy and Stability ................................................................................... 21 Hydrodynamics of Motions and Loading ..................................................................... 31 Strength and Structural Design - General ..................................................................... 32 Mooring......................................................................................................................... 33 Cost ............................................................................................................................... 35 Results............................................................................................................................... 35 General Arrangement and Overall Hull Design............................................................ 35 Wind and Current Loading ........................................................................................... 35 Local and Global Loading ............................................................................................ 36 Weight, Buoyancy and Stability ................................................................................... 37 Hydrodynamics of Motions and Loading ..................................................................... 39 Strength and Structural Design - General ..................................................................... 42 Mooring......................................................................................................................... 43 Cost ............................................................................................................................... 47 Conclusion ........................................................................................................................ 48 References......................................................................................................................... 50 Appendix A: Hydrodynamics of Motions and Loading ................................................... 51 Appendix B: Ballasting..................................................................................................... 55 Appendix C: Environmental Loads .................................................................................. 58 Appendix D: StabCad ....................................................................................................... 61 Appendix E: GMOOR .................................................................................................... 117
- 3. OCEN 407 Design Class Team Malaysia ii Nomenclature ABS - American Bureau of Shipping API - American Petroleum Institute Area ratio - Ratio of the area between the righting moment curve, downflooding angle, and heeling moment curve added to the area under the heeling moment curve, righting moment curve, downflooding angle, and inclination angle compared to the sum of the area under the heeling moment curve, righting moment curve, downflooding angle, and inclination angle and the area between the heeling moment curve and righting moment curve Down flooding angle - Static angle from the intersection of the vessel's centerline and the waterline in calm water to the first opening that cannot be closed watertight and through which downflooding can occur Damaged condition - Condition in which ballast tanks are flooded to represent a damaged situation Heave - Vertical motion in water Heeling arm - The horizontal distance between the buoyant force and the center of gravity to move the vessel away from the upright position Height coefficient - Characteristic of a structure in wind based on its height Intact condition - Condition in which the semi-submersible is unharmed MARPOL - Marine Pollution Convention Pitch - Rotation around the transverse (x) axis Righting arm - The horizontal distance between the buoyant force and the center of gravity to bring the vessel to an upright position Roll - Rotation around the longitudinal (y) axis SCR - Steel Catenary Risers Semi-taut mooring system - Mooring system in which the mooring lines are pulled in tension, but leaving some slack Shape coefficient - Characteristic of a structure in wind based on its shape SOLAS - Safety of Life at Sea Taut-leg mooring system - Mooring system in which the mooring lines are pulled in tension, having no slack USCG - United States Coast Guard Yaw - Rotation about the vertical (z) axis
- 4. OCEN 407 Design Class Team Malaysia iii List of Figures Figure 1: Final Team Organization..................................................................................... 8 Figure 2: General Iterative Process..................................................................................... 9 Figure 3: Proposed Project Location................................................................................. 11 Figure 4: Original Basic Hull Design ............................................................................... 13 Figure 5: Modified Basic Hull Design.............................................................................. 13 Figure 6: Wind Height Divisions...................................................................................... 14 Figure 7: Semi-submersible Current Drag Coefficients ................................................... 15 Figure 8: ETABS Structural Model .................................................................................. 16 Figure 9: ETABS Model with Waterline .......................................................................... 16 Figure 10: Static Wave Model with Crest across Diagonal.............................................. 17 Figure 11: Static Wave Model with Trough across Diagonal........................................... 17 Figure 12: Pressures in Positive X, Y, and Z Directions without Wave........................... 18 Figure 13: Pressures in Negative X, Y, and Z Directions without Wave ......................... 18 Figure 14: Pressures in Positive X, Y, and Z Directions with Static Wave...................... 19 Figure 15: Pressures in Negative X, Y, and Z Directions with Static Wave .................... 19 Figure 16: Weight Distribution of Semi-Submersible Components................................. 20 Figure 17: Buoyancy Force............................................................................................... 20 Figure 18: Springs Attached at Nodes .............................................................................. 21 Figure 19: Column Diagram ............................................................................................. 21 Figure 20: Pontoon Diagram............................................................................................. 22 Figure 21: Node Diagram ................................................................................................. 22 Figure 22: Riser Placement and Ballasting Tank Diagram............................................... 24 Figure 23: Balancing Spreadsheet .................................................................................... 25 Figure 24: Auto Ballasting Example................................................................................. 26 Figure 25: Horizontally Centered Topside CG Float-on/Float-off Scenario .................... 27 Figure 26: Excessive topside CG offset for Float-on/Float-off ........................................ 28 Figure 27: Intact Stability Objective Diagram.................................................................. 29 Figure 28: Damaged Stability Objective Diagram............................................................ 30 Figure 29: Final Hull Dimensions..................................................................................... 35 Figure 30: Deflections and Displacements ....................................................................... 36 Figure 31: Reaction Forces ............................................................................................... 37 Figure 33: Shear Diagram................................................................................................. 42 Figure 34: Bending Moment Diagram.............................................................................. 42 Figure 35: 12 Leg Spread.................................................................................................. 43 Figure 36: 16 Leg Spread.................................................................................................. 44 Figure 37: Mooring Analysis Results ............................................................................... 44 Figure 38: Mooring Material and Equipment Costs ......................................................... 45 Figure 39: Chosen Mooring Design.................................................................................. 46
- 5. OCEN 407 Design Class Team Malaysia iv List of Tables_____ ____________ Table 1: Metocean Data .................................................................................................... 12 Table 2: Total Environmental Loads ................................................................................ 36 Table 3: Deflections, Moments, and Stresses of Structure ............................................... 42
- 6. OCEN 407 Design Class Team Malaysia 1 Executive Summary Overview With the relatively low cost of energy and the rapid advancement of technology in the last century, humankind has become highly dependent upon large quantities of inexpensive fuel for everything from transportation of goods and people to the harvesting of crops for food to being able see at night. As the population increases exponentially and demands for inexpensive energy solutions continue to rise, the readily available reservoirs of energy rich fossil fuels have rapidly declined. In order to meet these demands, fossil fuel exploration and production is forced into more and more inhospitable conditions such as the extreme deep sea. The expenses associated with fixed production platforms at this depth are no longer within a feasible range making a floating production platform design a far more economical choice. One of the floating production platform designs in use today and pursued by this conceptual design team is the semi- submersible production platform. This conceptual design team was given the weights and dimensions of the platform topsides required for production and drilling, and a location in the South China Sea at a water depth of 5,500 ft. A highly iterative process of altering the key dimensions of a four-column ring pontoon was conducted in order to meet applicable regulations and client requests while minimizing costs and satisfying the chosen competencies. The design team was divided into subgroups that would tackle different components of design based on individual talent, desire and schedule availability and given a 3 month deadline. Competencies The following 8 competencies were chosen to analyze and address in the conceptual design: 1. General Arrangement and Overall Hull Design 2. Wind and Current Loading 3. Local and Global Loading 4. Weight, Buoyancy and Stability
- 7. OCEN 407 Design Class Team Malaysia 2 5. Hydrodynamics of Motions and Loading 6. General Strength and Structural Design 7. Mooring 8. Cost General Arrangement and Overall Hull Design (Methodology pg. 12, Results pg.35) The final hull design was a square ring pontoon with outer lengths of 270 ft., a height of 40 ft. and a width of 55 ft. The ring pontoon is topped with four square columns with a length of 50 ft. to a side and height of 80 ft. A square topside deck is supported by the four columns with the corners of the topside deck placed at the geographical centers of column tops. Wind and Current Loading (Methodology pg. 14, Results pg.35) The provided metocean data for the Malaysia site includes the wave height, period, wind speed and current speed for both the operational and survival design condition. The operational and survival design storms are 10 year and 100 year storm conditions respectively for the design location. Shape and height coefficients taken from ABS were applied to the constant topside shapes, the final exposed column shapes (with zero shielding) and the final component elevations once the final freeboard was calculated. Wind, current and mean wave drift were applied concurrently in the bow, beam and quartering directions resulting in maximum environmental loads for operational and survival conditions to be 473.3 kips and 603.1 kips from the quartering direction. Local and Global Loading (Methodology pg. 15, Results pg.36) An analysis of the semi-submersible structure was performed using a three-dimensional analysis program for building systems, ETABS, to determine the deflections, moments, and stresses acting on the topside, columns, and pontoon of the hull. Two types of analyses were viewed: one
- 8. OCEN 407 Design Class Team Malaysia 3 with the structure floating at a constant draft and the other with a static wave with the crest of the wave acting on two of the columns opposite from each other. This wave, modeled as per ABS code 3-3-A2/3.7, produced maximum moments, stresses, and deflections. Then, the weights of the hull, topside, ballast tanks filled with water, and nodes were added, along with the buoyancy acting on the bottom of the pontoon. Springs were added to the joint of the columns and pontoon to represent the mooring lines. Wind, wave, and current forces were not modeled for the structural analysis, thus reaction forces for the springs in the x and y directions are zero when the analysis was run. In addition the weights of all of the components are of equal and opposite force to the buoyancy resulting in zero net global displacement in the z direction. Weight, Buoyancy, and Stability (Methodology pg. 21, Results pg.37) Weight approximations of 9, 12 and 14 lbs/ft3 were used for columns, pontoons and nodes respectively. An additional 48-62.5% was added for marine systems, brackets, paint, and design allowances. The hull buoyancy was simply the weight of the water displaced by the pontoons, nodes and the part of the columns that were submerged either during float-on, float-off, operational or survival conditions. Physical centers used for small angle stability and input into StabCad for large angle stability were: KG = 70 ft., KB = 29.9 ft., BM = 63.4 ft., KM = 93.2 ft., GM = 23.1 ft., with a draft of 85 ft. and a freeboard of 35 ft. All down flooding angles and area ratios for intact stability were in excess of the ABS recommended values. Two consecutive tanks were flooded all the way around semi-submersible to analyze the damaged stability response. The distance between down flooding angle and the first righting arm/ heeling arm intercept is greater than the recommended 7 degree minimum in the worst case damaged case scenario. Six tanks in each pontoon are floodable to reach operational and survival drafts as well
- 9. OCEN 407 Design Class Team Malaysia 4 as to offset a permanent topside center of gravity that is as far from the geographical center of gravity as (47, 47) (ft). Hydrodynamics of Motions and Loading (Methodology pg. 31, Results pg.39) Using closed-form equations, the heave and pitch/roll period were determined to be 21.8 25.5 seconds respectively. Heave and pitch/roll response was found using response amplitude operators found from a hull of similar dimensions for the degree headings of 0, 22.5, 45, 67.5 and 90. The maximum heave response was found to be from the 22.5 degree heading and was +/-8.9 ft and +/-12.6 ft for the operating 10 year and survival 100 year storm conditions respectively. The maximum pitch/roll response was found to be from the 0 degree heading and was +/-2.5 degrees and +/-4.3 degrees for the operating 10 year and the survival 100 year storm conditions respectively. General Strength and Structural Design (Methodology pg. 32, Results pg.42) As stated before, the structural analysis was performed using the program called ETABS. The stick figure and loadings as previously mentioned were used. The stresses, for both wave cases, that were created from the pressures, weights, and buoyancy were compared to guidelines from ABS 3-2-3.3 through 3-2-3.11. The stresses for the topside and pontoon were the same while the stresses in the columns were slightly less. The structural analysis was run and the maximum values for the deflections, moments, and stresses for the topside, columns, and pontoon came from the moment diagrams in the static wave case. The maximum deflection of the hull occurs in the topside, which is 1.17 in., while the columns contain the maximum moment at 13.8x10⁶ kip-ft. The maximum stress, 29.92 ksi,
- 10. OCEN 407 Design Class Team Malaysia 5 occurs in the pontoon, which is less than the calculated value, 29.94 ksi, as per ABS recommendations. Mooring (Methodology: pg. 33, Results: pg.43) The mooring design for the semi-submersible was created with the aid of the software program GMOOR. Environmental and mooring line component data was manually entered into GMOOR which constructed a model of the system. Twelve and sixteen leg mooring system designs were tested with chain, polyester, and spiral wire components in both taut-leg and semi-taut leg mooring system designs. The mooring lines at both the fairleads and anchors are composed of chain to account for an increase of stresses at the fairleads and to fit chain jacks, as well as to accommodate the situation where the mooring lines may lay on the ocean floor, not to get sediment into the polyester or wire components. Wire as the middle component performed well in both taut and semi-taut designs, providing the required in-water weight for the semi-taut system for restoring force but added a significantly larger downward force on the hull. The polyester middle component could also be adapted to work well in both taut and semi-taut leg mooring systems. While this provided the required stretch for the restoring force in the taut-leg configuration, it lacked the in-water weight to provide an adequate restoring force in the semi- taut design. A dynamic analysis of the mooring system was conducted with concurrent environmental forces applied in the direction of each mooring line to find the worst case intact and damaged conditions. The results of these analyses were checked against API 2SK recommended mooring guidelines. It was determined that the polyester line was ideal for a taut- leg system, and the wire line was ideal for a semi-taut system. An increase of 0.02-0.04mm to the diameter of all the steel components of the mooring line per design year is recommended to
- 11. OCEN 407 Design Class Team Malaysia 6 account for corrosion as per API 2SK Stationkeeping Manual. The final design was dictated by meeting all mooring objectives and pertinent regulations stipulated in API 2SK as well as minimizing cost. The finalized system was a twelve leg taut system with 200 ft. of 2.75 in. K4 Studless chain at the anchor, 7,350 ft. of 3.94 in. polyester rope as the middle component and 300 ft. of 3.0 in. K4 Studless chain at the fairlead. The anchors chosen for this design are 11.36 tons Stevmanta vertically loaded drag embedment anchors built by Vryhof. The Stevmanta was chosen because it performs ideally for taut leg systems and it is much more cost effective than using suction piles. SEPLAs (Suction Embedded Plate Anchors) were also considered for the anchors, but were not included in the final design due to unknown installation costs, which are expected to be significantly higher than Stevmanta placement. Cost (Methodology: pg. 35, Results: pg.47) The total hull cost was approximated by steel weight at $12,000 per short ton of steel. Three weight estimates were used for cost approximation purposes: 12 lbs/ft3 for pontoons, 9 lbs/ft3 for columns and 14 lbs/ft3 for nodes. The final semi-submersible design resulted in a steel weight of 21,902 (kips) or 10,951 (tons) resulting in a net hull cost of $184 Million (USD). Using Stevmanta drag embedment anchors projected to be $51,000 (USD) apiece; total anchor cost is $612,000 (USD). With a 12-leg taut mooring system design as previously mentioned, line and associated equipment costs are estimated to be $192 Million (USD). Total hull and mooring capital would then cost $7.8 Million (USD).
- 12. OCEN 407 Design Class Team Malaysia 7 Regulatory Compliance Considerations were made towards American Bureau of Shipping (ABS), American Petroleum Institute (API), International Convention for the Safety of Life at Sea (SOLAS), United States Coast Guard (USCG) and the Marine Pollution Convention (MARPOL) in all applicable areas of chosen conceptual design competencies. Acknowledgements It should be noted that a significant amount of help in understanding the problems and approaches to solving offshore issues was provided by engineering mentors currently working in the offshore industry. This list of engineers included: Rod King of Lloyds Register, Peter Noble of ConocoPhillips, Philip Poll of Houston Offshore Engineering and Kent Longridge of InterMoor. Introduction The conceptual design team decided to analyze the aforementioned competencies from the standpoint of a four-column ring pontoon semi-submersible platform. Regard was made to given topside dimensions and weight, required risers and their respective tensions, water depth and Metocean data associated with the reservoir location. Engineers of varied backgrounds assisted in the design process by giving guest presentations during classroom meetings, answering some of the questions presented by the different design teams and helping with approximation methods. The teams first meeting resulted in the election of Brian Riordan as the team captain who then broke the rest of the members into two-man teams to tackle what was thought at the time the most crucial and most likely governing factors to the design: ABS/API regulatory compliance research, StabCad familiarization, ETABS (structural analysis program) familiarization, and automation of generating StabCad input points from prototype spreadsheet. After two weeks of meetings with only small accomplishments in some StabCad familiarization and a Matlab program to quickly develop a StabCad model based on dimension changes a strategic restructuring was required to re-identify and prioritize the order in which analysis would take place. The two-man teams also lead to a lack of accountability in analysis so everyone was given a “point man” or lead status for different aspects of design with a partner assigned to work on the project at the same time to offer aid. Regularly scheduled team meetings reviewed progress from each lead to keep everyone on track. This structuring seemed to work for a few weeks before it became apparent that each lead had developed his own semi-submersible that met his immediate goals, whether it was large angle stability, hydrodynamic properties or structural strength constraints, but did not meet all of them. The final restructuring kept the point man positions previously assigned but had them report immediately to the Team Captain any changes they made or problems they encountered and almost all inter-team communication was then facilitated through the team captain in the following organizational structure seen in Figure 1: Final Team Organization.
- 13. OCEN 407 Design Class Team Malaysia 8 Figure 1: Final Team Organization Team members worked jointly with each other to help solve certain issues within their specific assignments and tried to keep designs dynamic so changes in an interdependent competency were easily updated in their design during the iterative process. All other responsibilities were absorbed by the team captain and cost was determined jointly by the Mooring lead and the Team Captain- combining costs of anchors and mooring with the structural steel costs of the hull. Once spreadsheets and programs such as GMOOR, StabCad and ETABS were understood, a spreadsheet would take the input changes to any dimensional changes, provide hydrodynamic responses, freeboards, drafts and ballasting requirements. If all of these past inspection, a batch file would run a Matlab program converting the X,Y,Z points generated in the spreadsheet to a StabCad compatible input file for large angle stability analysis, and other dimensions and area moments of inertia were also given to ETABS for structural analysis. The topside dimensions (with the exception of a horizontal center of gravity) remained constant, so a change in draft and exposed areas of columns were all that were needed to recalculated concurrent environmental forces. The maximum concurrent forces were then used in GMOOR to determine mooring line sizes. To aid in iteration cycle speed, the acceptable column width range was determined by a hydrodynamic analysis, and a minimum area moment of inertia used in ETABS while a maximum projected area used for environmental forces. With a freeboard set to a constant, all dimension iterations were then compared to the maximum bending and shear stresses for the weakest structural design and with the largest environmental loads. If the tested dimensions past hydrodynamic inspection and a quick comparison to worst case scenarios for structural and environmental conditions, then it would definitely pass an in-depth analysis and was worth pursuing. The general iteration process can be seen in Figure 2: General Iterative Process.
- 14. OCEN 407 Design Class Team Malaysia 9 Figure 2: General Iterative Process
- 15. OCEN 407 Design Class Team Malaysia 10 Objectives The conceptual design is to satisfy the following criterion: • Drafts & Freeboard o A maximum float-on float-off draft of 29.52 ft. determined by Dockwise boat capacity. o A minimum operational freeboard (air gap) of 35 ft. based on metocean data. • Hydrodynamic responses o A minimum natural heave and pitch/roll period of 20 seconds based on client requests for optimum operation of topside separation tanks and risers. o A maximum of +/-16 ft heave response based recommendations from HOE o A maximum 4◦ pitch/roll for 10 year storm conditions and a maximum 10◦ pitch/roll for 100 year storm conditions based on HOE recommendations. • Large Angle Intact Stability o Righting Arm should be greater than 2 times the heeling arm at the down flooding angle. o Area ratio for a non-ship shaped floating structure should be greater than 1.3. • Large Angle Damaged Stability o There should be a distance greater than 7 degrees between the first intercept of the righting and heeling arm and the down flooding angle. • Structural Stress Allowances o Maximum topside stress of 29.94 ksi o Maximum column stress of 27.8 ksi o Maximum pontoon stress of 29.94 ksi • Mooring o Dynamic intact mooring analysis factor of safety should be greater than 1.67 as per API codes. o Dynamic damaged mooring analysis factor of safety should be greater than 1.25 as per API codes. o Pretension stress for semi-taut and taut-leg mooring systems should not exceed 20% of the breaking strength. o Platform offset for intact mooring system during operations should not exceed 5% of the water depth. o Platform offset for intact mooring system during survival mode should not exceed 7% of the water depth. o Platform offset for damaged mooring system should not exceed 7% of the water depth. o Platform must be able to move 150 feet off center in any direction for drilling purposes.
- 16. OCEN 407 Design Class Team Malaysia 11 • Cost o Cost should be minimized while meeting all other objectives. Design Basis The design site is in 5,500 ft. water depth in the South China Sea off the coast of Malaysia. Singapore has fabrication capacity for both platform topsides and semi-submersible hull only 585 miles from the proposed platform location making Singapore the ideal construction site as seen Figure 3. Figure 3: Proposed Project Location Even though the relatively short distance makes a wet-towing option economical, the ring- pontoon design considered is not as hydrodynamic as a two-pontoon hull, so designing the hull for the dry-tow option left greater transportation versatility in the event that a wet tow was too expensive. A maximum draft for the dry-tow option is 29.52 ft. The metocean data for the proposed design site was given as follows in Table 1.
- 17. OCEN 407 Design Class Team Malaysia 12 Table 1: Metocean Data Location Malaysia Max Design Condition Operating Extreme Environmental 10 Year 100 Year Component Wind: Wind Spectrum API RP 2A API RP 2A Speed, Vw (1 hour31.1 knots 36.9 knots mean at 10 m) Sea Waves: Wave Spectrum JONSWAP3 JONSWAP3 Significant Wave 16.1 ft. 20.7 ft. Height, Hs Maximum Wave 30.8 ft. 39.4 ft. Height, Hmax Peak Period, Tp 12.7 sec. 13.1 sec. Peakedness 1.7 1.9 Parameter, γ Surface Speed, Vc 2.3 knots 2.5 knots The environment is fairly benign with insignificant swells and a 100 year significant wave height of about 21 ft. Assuming linear wave theory applies, ABS suggests adding 5 ft. to the 100 year significant wave height to determine a minimum freeboard or air gap, putting the minimum air gap at 26 ft. Riser fatigue and topside separation tank effectiveness are a function of natural heave and pitch/roll period. As such, natural heave and pitch/roll period were designed to be higher than 20 seconds as per client requests. HOE recommends heave response to be within +/- 16 ft. for both 10 year and 100 year storm conditions. In addition, ABS stipulates an acceptable 10 year storm pitch/roll to be a maximum of 4 degrees and a 100 year storm pitch/roll to be a maximum of 10 degrees. For large angle intact stability analysis, ABS recommends that the righting arm should be at least twice the heeling arm at the down flooding angle. Since the semi-submersible is not considered ship-shape, the required minimum area ratio is 1.3. In a damaged stability condition, ABS recommends a minimum distance between the first intercept of the righting and heeling arm to be at least 7 degrees from the down flooding angle. Design Methodology General Arrangement and Overall Hull Design The original general hull design was as basic as could be: a square ring pontoon supporting four square columns with outer column edges flush with the given topside dimensions of 220 ft. by 220 ft. as seen in Figure 4.
- 18. OCEN 407 Design Class Team Malaysia 13 Figure 4: Original Basic Hull Design After calculating small angle stability and response periods, it was difficult to find a set of dimensions that met the objectives adequately so the pontoon lengths were increased, spreading the distance between the columns so that the topside deck corners were set on the geographical centers of the tops of each column as seen in Figure 5. Figure 5: Modified Basic Hull Design Acceptable small angle stability and physical center data seemed within reason and response periods, freeboard and float-on and float-off drafts were also easily obtainable within their
- 19. OCEN 407 Design Class Team Malaysia 14 accepted ranges. All following iterations were made with the general basic hull design as seen in Figure 5. Wind and Current Loading An Excel spreadsheet was created to calculate all of the wind forces acting on the platform. The excel spreadsheet can be seen in Appendix 1. To compute the wind force the platform above the waterline had to first be broken up into 50 foot increments as seen in Figure 6. Figure 6: Wind Height Divisions The area of each of the different components in between each 50 foot increment was then computed. For all the components in between 50 foot increments a height coefficient was assigned. These coefficients were found from the ABS MODU manual. Also based on the type of structure each component was (i.e. truss, flat hull, cylinder etc.) assigned a shape coefficient found in the ABS MODU manual. The forces were computed for every 45 degrees around the platform. It was determined that the greatest load would come when the wind impacted the rig on its northeast corner. The following equation was used to determine the wind forces: F = C S C H CW SV 2 Where CS is a coefficient which comes from the shape of the structure in consideration, CH is the coefficient of height which is based off the height of the structure above the mean water line. To determine the height coefficients the semi was broken up into 50 foot increments. The areas of these increments were then computed which is the value S. Both the coefficient of shape and height come from recommended figures provided by ABS. The CW coefficient is a standard coefficient that accounts for several constant factors. V is the average wind speed for a one hour time interval. The current forces were calculated using the same spreadsheet listed in
- 20. OCEN 407 Design Class Team Malaysia 15 Appendix C: Environmental Loads. Because the geometry of the hull is symmetrical there was no need to compute the load for more than one side and one corner. Since there is more exposed surface area when the current is flowing toward the semi at a 45 degree angle the force acting on the corner of the hull will be greatest at the corners under this condition. The current force was computed using the equation below which is similar to that of the wind force equation mentioned above. Unlike the wind force however the projected area of the submerged area did not have to broken down into smaller areas, however a shape coefficient was computed based on the radius the corners of the columns and pontoons. F = C S SV 2 In equation 8 all of the variables have the exact same meaning as those for equation 4 but the coefficient of shape was calculated from API 2SK Figure C-2 which is shown below in Figure 7. Figure 7: Semi-submersible Current Drag Coefficients(ABS MODU) The mean wave drift force was calculated using the force coefficients given in the GMOOR example file. The wave period must be matched to the value given in the file. Then the force is the coefficient times the wave amplitude squared. Local and Global Loading The program that is used for structural analysis of the semi-submersible is ETABS. This is a three-dimensional analysis program for building systems. The model that is inputted into ETABS is a stick figure version of the hull design. The length of the pontoons and topside come from the distance from center to center of the columns, which is 220 feet. The height of the model is the distance from the center of the pontoon, entire length of the column, to half of the topside height, which is 118 feet. Equivalent cross-sectional areas for the beams, pontoon, and columns were determined by moments of inertia. A rigid plate was placed on top of the columns
- 21. OCEN 407 Design Class Team Malaysia 16 to represent the topside. This model, shown in Figure 8 was input into ETABS with forces applied. Figure 8: ETABS Structural Model Two different types of analyses were performed on the structure. One analysis has the structure submerged in a constant draft of 67.74 ft., shown in Figure 9. Figure 9: ETABS Model with Waterline The other analysis contains a static wave that causes the maximum deflection and moments. To find the maximum deflection of the topside and pontoons, the maximum moment needs to be determined. ABS code 3-3-A2/3.7 states that “A diagonal wave (30-60 degrees) from the bow with a length of about one and half times the diagonal distance between pontoon ends will induce the maximum design longitudinal shear force between the pontoons. In this load case, the longitudinal forces on the two pontoons and columns are maximized and acting in the opposite directions. Thus, the horizontal bracings will be subject to the maximum bending moment.” The diagonal wave was modeled at 45 degrees from the bow, with a wavelength of 466.7 ft, and the crest of the wave was placed across the diagonal of the semi-submersible, shown in Figure 10.
- 22. OCEN 407 Design Class Team Malaysia 17 Figure 10: Static Wave Model with Crest across Diagonal The same wave was entered with the trough across the diagonal of the structure; this can be seen in Figure 11. The two cases involving the static wave gave similar results. From this point forward, only the case with the crest across the diagonal will be discussed. Figure 11: Static Wave Model with Trough across Diagonal The main forces on the hull are from hydrostatic pressures, which are more dominating than wind, wave, and current forces. The total pressure is determined by the static and dynamic pressure equations: Ptotal = Pstatic + Pdynamic Pstatic = ρ gz Where: ρ = 1.99 slugs/ft3 g = 32.2 ft/sec2 z = water depth Pdynamic = ρ gAe kz Where: A = amplitude of wave k = wave number = 2π/L
- 23. OCEN 407 Design Class Team Malaysia 18 These forces were put into ETABS as two different load combinations, for display reasons, shown in Figure 12, Figure 13, Figure 14, and Figure 15. The two former figures display the structure in water, without static wave acting on it, while the two latter figures contain the static wave with 100 year storm significant wave height and a wavelength 1.5 times the hull diagonal length as specified by ABS. Figure 12: Pressures in Positive X, Y, and Z Directions without Wave Figure 13: Pressures in Negative X, Y, and Z Directions without Wave
- 24. OCEN 407 Design Class Team Malaysia 19 Figure 14: Pressures in Positive X, Y, and Z Directions with Static Wave Figure 15: Pressures in Negative X, Y, and Z Directions with Static Wave All of the weights of the semi-submersible were then added to the model. These weights include the topside, columns, pontoon, nodes, risers, and the mooring lines. The weight of the topside is 40,256 kips and was uniformly distributed across the rigid plate on top of the model. The weight of the columns and pontoons, 4,753 kips and 54,756 kips, respectively, were also inputted as uniformly distributed loads. The weights of the nodes, 4,159 kips each, were added to the bottom of the columns. The eight risers, weighing an average of 444 kips each, are located on opposite sides of the pontoon with four on each side. Located at the top of the columns are the twelve mooring lines, weighting 68 kips each. This weight distribution can be seen in Figure 16.
- 25. OCEN 407 Design Class Team Malaysia 20 Figure 16: Weight Distribution of Semi-Submersible Components The buoyancy force counteracts the weights of the entire semi-submersible and is equal to 135,028 kips as seen in Figure 17. Figure 17: Buoyancy Force Springs were placed at the nodes between the columns and the pontoons to represent the mooring lines, shown in Figure 18.
- 26. OCEN 407 Design Class Team Malaysia 21 Figure 18: Springs Attached at Nodes The spring stiffness is determined by: k = F/x Where: F = average force of mooring line (from GMOOR) at fairlead = 116.8 kips x = maximum displacement of semi-submersible = 550 ft. (from watch circle defined by ABS as 10% of the water depth) Weight, Buoyancy and Stability Weight approximations were given for each of the main shapes used in the basic hull design were 9, 12 and 14 lbs/ft3 for columns, pontoon and nodes respectively. The weight of the columns seen in Figure 20 is modeled as a point mass for stability at the geometrical center of the column. The buoyancy is modeled as a point force at the geometric center of the submerged portion of the column with a magnitude equal to the weight of displaced water. Figure 19: Column Diagram
- 27. OCEN 407 Design Class Team Malaysia 22 The weight of the pontoon seen in Figure 20 is modeled as a point mass in the center of each pontoon- there being four individual pontoons in the ring. The buoyancy is modeled as a point buoyancy in the geometrical center of the submerged portion of each of the pontoons in the ring. The force applied at the buoyancy point is equal to the weight of displaced water. For operational and survival conditions, the pontoon is completely submerged. Only in a float-on or float-off scenario is the pontoon possibly only partially submerged. Figure 20: Pontoon Diagram The nodes were modeled as the densest part of the hull and are the portion of the hull where the columns intersect the ring pontoon as seen in Figure 21. Figure 21: Node Diagram Like the columns and pontoon, the nodes weight is modeled as a point mass located at the geometric center of the node and the buoyancy is modeled as point buoyancy located at the center of the submerged portion of the node. Like the pontoon, under both operational and survival conditions the nodes are completely submerged and are only partially submerged in a float-on or float-off scenario. The magnitude of force applied at the buoyancy point is equal to the weight of the displaced volume of water.
- 28. OCEN 407 Design Class Team Malaysia 23 Two conditions were considered in regard to given topside horizontal center of gravity: a given CG of (0,0) (with the origin at the top, middle of the deck), or an offset CG. The ideal scenario would be a topside with a given centered horizontal center of gravity. Conditions may arise in fabrication resulting in a slight or even drastic movement of the CG from the topside center that would have to be permanently offset in ballasting tanks. This offset may require a significant amount of ballasting to offset, and thus put the float-on/float-off draft over the maximum draft allowed. If production deadlines are not met, a scenario might occur where most of the topside is moved out with the hull to the project location and another topside component is derived at a later time. In this scenario, ballasting would be used to temporarily offset the asymmetrical weight of topside during float-on/float-off operations and until the missing topside component is delivered. These scenarios were kept in mind during the ballasting tank design. Eight steel catenary risers (SCR) were required for production, all at different tensions. It was initially thought that ballasting tanks would have to be used to counteract the offset CG, but it was also thought possible to hang the SCRs as evenly as possible off opposite sides of the hull to minimize CG shift. These risers were placed in the spreadsheet shown in the diagram in Figure 22.
- 29. OCEN 407 Design Class Team Malaysia 24 Figure 22: Riser Placement and Ballasting Tank Diagram Mooring weight and/or tension at fairleads had to be added as well to find the final vertical center of gravity, draft and freeboard. The mooring tensions (found in a later part of the report) are also shown at the corners of the diagram in Figure 22: Riser Placement and Ballasting Tank Diagram. Resultant center of gravity was calculated from transverse, lateral and vertical moments as seen in Figure 23.
- 30. OCEN 407 Design Class Team Malaysia 25 Figure 23: Balancing Spreadsheet To satisfy damaged stability criteria recommended in ABS, 6 equally sized tanks were placed in each of the four pontoons. Tank ballasting levels were determined by an automated Macro imbedded in a spreadsheet that would first balance the hull by filling some of the tanks to
- 31. OCEN 407 Design Class Team Malaysia 26 counteract any offsetting topside CG, then filling them all to reach a 35 ft. freeboard, then consolidating the ballasting water into as few tanks as a simple algorithm could handle. A demonstration of an auto-ballasting spreadsheet system can be seen in Figure 24. Figure 24: Auto Ballasting Example A float-on/float-off scenario for a (0,0) topside CG analysis simply involved removing riser and mooring tension and emptying tanks. If the small angle stability was acceptable (GM greater than 10 ft.) and the draft was less than the maximum allowed by Dockwise equipment (29.52 ft.) then float-on/float-off would remain a viable option. An example of this scenario can be seen in Figure 25.
- 32. OCEN 407 Design Class Team Malaysia 27 Figure 25: Horizontally Centered Topside CG Float-on/Float-off Scenario As is evident in Figure 25, the gravity to metacentric height is in excess of the target 10 ft. and the draft is less than the maximum 29.52 ft. leaving a dry-tow an option for this design. An offset topside CG for a float-on/float-off scenario was also considered and also seemed more critical than for an operational situation. The only method the hull has to counteract an offset topside CG is with ballasting. Any increase in ballasting weight, however, would increase the already relatively deep draft for float-on/float-off and could quickly remove dry-towing from transportation options. An example of this scenario is seen in Figure 26.
- 33. OCEN 407 Design Class Team Malaysia 28 Figure 26: Excessive topside CG offset for Float-on/Float-off The draft in Figure 26: Excessive topside CG offset for Float-on/Float-off is highlighted red signifying an error that was triggered by excessive draft for the float-on/float-off condition. For quick analysis the gravity to metacentric height (GM) was used to determine right away if the proposed design dimensions would result in a stable hull or not. This stability analysis was only valid for small angles of list, so StabCad was used for the large angle stability analysis. An intact stability analysis was run first resulting in a graph similar to the example shown in Figure 27.
- 34. OCEN 407 Design Class Team Malaysia 29 Figure 27: Intact Stability Objective Diagram For an intact analysis, two basic requirements were to be met: one, that the area ratio is greater ⎛ Area[ A + B] ⎞ than 1.3 ⎜ ≥ 1.3 ⎟ and two, that the righting arm moment is at least 2 times greater ⎝ Area[C + B ] ⎠ than the heeling arm moment at the down flooding inclination angle for 100 knot winds. A damaged case analysis stipulated that the worst-case scenario of any two consecutive flooded tanks anywhere in the hull had to result in a minimum 7 degree distance between the first intercept between the righting arm and heeling arm and the down flooding angle as seen in Figure 28 in 50 knot winds.
- 35. OCEN 407 Design Class Team Malaysia 30 Figure 28: Damaged Stability Objective Diagram Once dimensions passed small angle stability, freeboard and hydrodynamics tests a spreadsheet recorded the X, Y and Z positions of each key point used for a StabCad model. A batch file then ran a Matlab program that took the Excel spreadsheet X, Y, and Z points and saved them as a .txt file in a StabCad friendly format. The text file was saved as a new StabCad file which was then run to check large angle stability for intact and damaged cases. A simple example of this StabCad model can be seen in Figure 29. Down flooding points were placed at the tops of the columns, and panels were defined according to where solid planes were in the model. Hull volumes were defined differently than the topside volumes and shape coefficients were applied to each of the topside components. Figure 29: StabCad Model
- 36. OCEN 407 Design Class Team Malaysia 31 Hydrodynamics of Motions and Loading One of the early objective conformity tests was in hydrodynamics, having both heave and pitch/roll natural periods greater than 20 seconds. A virtual added mass approximation of 100% the hull weight was used to determine heave period. Two formulas were used to perform these tests: 2m THeave = 2Π ρgAwp Where: m = mass ρ = density g = gravity Awp = Water plane area I TRoll = 2Π Awp gGM Where: I = Second Moment of Inertia with respect to water plane GM = distance from the center of gravity to metacenter In addition to heave and pitch/roll periods, heave and pitch responses, were to be determined; conforming to ABS recommendations. A simplified dynamic free-body diagram can be seen in Figure 30. F(t) m k c Figure 30: Simplified example of heave motion RAO (Response Amplitude Operator) data was found using a hull of similar dimensions in GMOOR. RAO is defined as response amplitude of the structure per unit wave height or wave amplitude. Figure 30 shows a simplified example of heave motion, the governing equation used for calculation can be seen in the following equation.
- 37. OCEN 407 Design Class Team Malaysia 32 •• • m X + c X + kX = F ( t ) = Re { F0 eiwt } Where: m = Equivalent Virtual Mass of System (Real mass +Added mass) c = Equivalent Viscous Damping Coefficient of System k = Equivalent Stiffness of System F(t) =External Force (i.e. Regular Wave Force) RAO values in conjunction with JONSWAP data were used to develop maximum heave and pitch/roll responses for different headings using the following equations. RMS = ∆ω iΣ ( RAO 2 i S (ω ) ) RS = ∆ω i RAO 2 i S (ω ) Where: ω is in rad/s and S(ω) is the metocean data calculated using JONSWAP The limits recommended by ABS are defined as +/-16 feet for all heave maximum responses, +/-4 degrees for pitch/roll maximum response using 10 year storm data, and +/-10 degrees for pitch/roll maximum response using 100 year storm data. Strength and Structural Design - General As previously stated, the program called ETABS was used to perform the structural analysis. The model length of the pontoons and topside is 220 feet, while the height of the model is 118 feet. Equivalent cross-sectional areas for the beams, pontoon, and columns were determined by moments of inertia. The thickness of the columns and pontoon is 1 inch, and modeled as 1.25 in. to account for scantling, ribs, and stiffeners. A rigid plate was placed on top of the columns to represent the topside. A stick figure was modeled to represent the semi-submersible, with the previous stated pressure, weight, and buoyancy loadings. The stresses that are created from these forces are compared to the ABS code 3-2-3.3 through 3-2-3.11. The values of the stress for the topside and pontoon from ABS come from the following equations. Fy F= F .S . Where: Fy = yield strength of steel F.S. = factor of safety = 1.67 For the columns, the equation for the stress is:
- 38. OCEN 407 Design Class Team Malaysia 33 Fcr F= F .S . ⎛ Fy 2 ⎞ ⎛ Kl ⎞ 2 Fcr = Fy − ⎜ 2 ⎟ ⎜ ⎟ ⎜ 4π E ⎟ ⎝ r ⎠ ⎝ ⎠ Where: Fcr = critical stress of steel E = Modulus of Elasticity K = effective length factor r = radius of gyration By using 50 ksi, common for many types of steels, for the yield strength of the steel used, the stresses for the topside and pontoon are both 29.94 ksi. For the columns, the stress is calculated to be 27.8 ksi. Mooring The purpose of a mooring system is to limit the semi-submersibles movement so that the platform remains in place over the equipment on the sea floor. The mooring system does allow for some movement of the platform so that the amount of tension in the mooring lines is reduced which allows for smaller diameter mooring lines thus reducing material costs. Also if the mooring system is to tight then if the platform suffers an impact from a large wave such as a rouge wave it can cause a very sudden and dramatic acceleration of the platform that can throw workers to the floor and damage equipment. However, there is a limit to how much the platform can offset because in most cases with steel catenary risers an offset greater than 5 percent of the water depths will cause increased fatigue on the risers or break them. Traditionally mooring lines have consisted of a chain fairlead and ground chain and a wire rope in between the two. However, for this design analysis it was decided to investigate the use a polyester rope as well at steel stranded wire. The reason for this is that polyester is much lighter than wire and so decreases the weight on the platform and has a much hire modulus of elasticity which allows for more restoring force. It was decided that a twelve leg taut and semi-taut mooring system should be analyzed along with a sixteen leg taut and semi-taut. A catenary mooring system was not analyzed because at 5500 foot water depths such systems become very heavy and much more difficult to install. Due to the limited amount of time available for this design a preliminary analysis was performed that tested the viability of using polyester rope and stranded wire for taut and semi-taut systems. The actual material properties used for the polyester rope were those provided by InterMoor and for the stranded wire the material properties of steel jacketed spiral stranded wire were used, these properties were also provided by InterMoor. After preliminary tests, by comparing the polyester rope and stranded wire designs with similar break strengths, it was found that for a taut mooring configuration, the polyester outperformed
- 39. OCEN 407 Design Class Team Malaysia 34 the stranded wire. The wire in fact did not pass API design guidelines because the minimum factor of safety for the stranded wire configuration was only 1.1. The API guidelines used for comparison are listed later in this section. The reason that the wire had much lower factors of safety is because the wire is less elastic than the polyester, initiating fatigue sooner. To compensate for this, the wire diameter and length were increased until they passed the guidelines. As a result, the wire mooring configuration was 4.5 times heavier than the polyester system. Although wire is less expensive per pound than polyester, the cost of materials for the two designs is still similar. However, when a larger diameter is used for the line, it is more difficult to install. When testing the semi-taut design, it was discovered that the polyester allowed the offset of the platform to be greater than the API guidelines. There are two reasons for this occurrence: elasticity of the polyester and that it is almost neutrally buoyant in water. However, the semi-taut configuration needs the weight in the mooring lines to help pull the platform back to its proper position. Due to these features of the polyester line, it was decided that further analysis for taut legs would only be performed with polyester rope and chain configurations. For semi-taut configurations only stranded wire and chain configurations would be considered. In order to test the four designs, a software program called GMOOR was used. GMOOR is a software package that allows the user to input the water depth, environmental force coefficients, which are computed from the environmental loads computed earlier in the report. The location of the semi-submersible’s fairleads is also entered into the GMOOR input file along with RAO data. A separate input file is created for the actual mooring lines to be used. This file contains the physical characteristics of the different mooring lines used, such as weight, design break strength, and stretch properties. This file also includes the length and diameter of each element in the mooring line, the depth of the anchor, and the lateral distance from the fairlead to the anchor. Once these files are created, GMOOR combines them and constructs a diagram of what the design will look like and analyzes the tensions acting on the mooring lines and the anchor. GMOOR then allows the user to enter environmental forces and the angle at which they act on the platform. GMOOR assumes that anchors can never fail, allowing the user to break lines in order to check the damaged performance of the mooring system. Four designs were fully tested and optimized using GMOOR. The testing included running a batch file that dynamically analyzed the environmental forces as being collinear and tested them at 22.5 degree intervals around the platform. At each of these intervals, GMOOR would test the mooring system with all lines intact and then break each line sequentially and then reset it and test the next line. By analyzing the mooring system this way, it was possible to determine not only the response when the 1st, 2nd or 3rd most loaded line is broken, but the response when any line is broken. Therefore, GMOOR was able to find the worse case scenario. The optimization was performed by shortening the line lengths and decreasing the diameters to minimize material costs while making sure not to sacrifice the safety of the system. The mooring designs were tested against guidelines created by the American Petroleum Institute (API) and the American Bureau of Shipping (ABS) which are: • Maximum Offset for Intact Operational Condition 5% of Water Depth • Maximum Offset for Damaged/Survival Condition 7% of Water Depth • Minimum Factor of Safety for Intact Condition 1.67 for Dynamically Analysis • Minimum Factor of Safety for Damaged Condition 1.25 for Dynamically Analysis
- 40. OCEN 407 Design Class Team Malaysia 35 • Polyester Rope/Jacketed Spiral must not touch seafloor Ideally, this mooring analysis would include analyzing the various environmental loads coming from the actual average directions and other various angles to the platform rather than examining them only as collinear. Such situations can cause unexpected responses. However, this was beyond the scope of the design because the actual current, wind and wave directions were unknown since there are no obtainable historical records. Cost The total cost of this design is approximately $7.2 million, which includes materials and equipment but not installation costs. Results General Arrangement and Overall Hull Design Final dimensions are seen in Figure 31. These dimensions were larger than originally expected, being governed by down flooding angle rather than the expected freeboard. Figure 31: Final Hull Dimensions Wind and Current Loading After completing the excel spreadsheet to calculate the wind, current and wave loads the excel spreadsheet added up the sum of all the forces to calculate the total environmental load acting on the platform. Table 2 shows the result of these calculations, for both operational and survival conditions.
- 41. OCEN 407 Design Class Team Malaysia 36 Table 2: Total Environmental Loads Operational Conditions (kips) North South West East 381.6 370.0 354.4 349.7 NE NW SE SW 470.2 473.3 462.5 465.6 Survival Conditions (kips) North South West East 488.6 472.4 450.5 443.8 NE NW SE SW 598.6 603.1 587.8 592.2 Local and Global Loading ETABS was run with pressures, weights, buoyancy, and spring forces on the model. Figure 32 displays an exaggerated model of the deflections and displacements of the topside, pontoons, and columns. Figure 32: Deflections and Displacements Since the wind, wave, and current forces were not modeled for the structural analysis, the reaction forces for the springs in the X and Y directions are zero, and the weights of all of the components are cancelled out from buoyancy to have no reaction in the Z direction, as shown in Figure 33.
- 42. OCEN 407 Design Class Team Malaysia 37 Figure 33: Reaction Forces Weight, Buoyancy and Stability Finalized dimensions resulted in the float-on/float-off (labeled as tow out/ loading) draft, operating draft and optional survival draft seen in Figure 34. Figure 34: Final Drafts Auto-ballasting could handle a permanent CG offset of 47 ft in both lateral and transverse directions for operational and survival conditions as seen in Figure 35.
- 43. OCEN 407 Design Class Team Malaysia 38 Figure 35: Maximum Permanent Offset for Operational and Survival Conditions Due to draft constraints, and offset topside CG is likely more crucial for float-on/float-off conditions. A maximum acceptable topside CG shift of 10 ft in both lateral and transverse directions is seen in Figure 36.
- 44. OCEN 407 Design Class Team Malaysia 39 Figure 36: Maximum Permanent Offset for Float-on/Float-off Condition Hydrodynamics of Motions and Loading Using previously mentioned equations in a spreadsheet that can be seen in Appendix A: Hydrodynamics of Motions and Loading, for a hull running on the light side of weight approximations- response periods were 21.8 and 25.3 seconds for heave and pitch/roll respectively. Since the auto-ballasting Macro run in the ballasting spreadsheet kept the freeboard at 35 ft., the area of the water plane was the same for a hull on the heavy side of weight approximation as one running on the light side. Therefore, a hull running on the heavy side of the weight approximation had response periods of 21.8 and 25.5 seconds for heave and pitch/roll respectively. Both heavy and light cases were above the minimum 20 second natural period objectives. Table 3 shows maximum responses for heave and pitch/roll for each heading angle used. The maximum heave response occurs at a 22.5 degree heading and the maximum response for pitch/roll occurs at a 0 degree heading as can also be seen in bold type in Table 3. Table 3: Maximum Responses Heave Maximum Response (ft) Pitch/Roll Maximum Response (°) RAO Heading 0° 22.5° 45° 67.5° 90° 0° 22.5° 45° 67.5° 90° 10 Year Storm 7.26 8.91 8.46 8.24 8.24 2.49 2.23 1.55 1.58 0.69 100 Year Storm 10.61 12.57 11.78 11.25 11.15 4.26 3.86 2.76 2.22 0.86
- 45. OCEN 407 Design Class Team Malaysia 40 Figure 37 through Figure 40 show the RAO, JONSWAP and resultant response plots for each of the maximum cases. 10 Year, 22.5 Degree, Spectral Analysis (Heave) 1.200 1.000 [RAO,JONSWAP]/peak, Response 0.800 RAO 0.600 JONSWAP Response 0.400 0.200 0.000 0 0.5 1 1.5 -0.200 w (rad/s) Figure 37: 10 year, 22.5° heading heave spectral analysis 100 Year, 22.5 Degree, Spectral Analysis (Heave) 1.200 [RAO,JONSWAP]/peak, Response 1.000 0.800 RAO 0.600 JONSWAP Response 0.400 0.200 0.000 0 0.5 1 1.5 -0.200 w (rad/s) Figure 38: 100 year, 22.5° heading heave spectral analysis
- 46. OCEN 407 Design Class Team Malaysia 41 10 Year, 0 Degree, Spectral Analysis (Pitch) [RAO,JONSWAP]/peak, Response 1.200 1.000 0.800 RAO 0.600 JONSWAP 0.400 Response 0.200 0.000 0 0.5 1 1.5 -0.200 w (rad/s) Figure 39: 10 year, 0° heading pitch/roll spectral analysis 100 Year, 0 Degree, Spectral Analysis (Pitch) 1.200 [RAO,JONSWAP]/peak, Response 1.000 0.800 RAO 0.600 JONSWAP Response 0.400 0.200 0.000 0 0.5 1 1.5 -0.200 w (rad/s) Figure 40: 100 year, 0° heading pitch/roll spectral analysis The final max responses compared to the recommended maximum values can be seen in Table 4 and are well within the maximum values recommended by ABS. Table 4: Actual Hull Response and Recommended Values Actual Max Recommended Max Heave 10 Year Conditions +/- 8.91 ft +/- 16 ft Heave 100 Year Conditions +/- 12.57 ft +/- 16 ft Pitch/Roll 10 Year Conditions +/- 2.49 ft +/- 4 ft Pitch/Roll 100 Year Conditions +/- 4.26 ft +/- 10 ft
- 47. OCEN 407 Design Class Team Malaysia 42 Strength and Structural Design - General The shear and moment diagrams due to the applied forces are shown in Figure 41 and Figure 42, respectively. Figure 41: Shear Diagram Figure 42: Bending Moment Diagram From the shear and moment diagrams and tables, the deflections, moments, and stresses of the topside beams, pontoons, and columns for both cases are shown in Table 5. Table 5: Deflections, Moments, and Stresses of Structure Calculated Stresses from ABS Deflections Moments Stresses Guidelines 4.37x10⁶ kip-ft Constant Topside 1.16 in. (downward) 29.51 ksi 29.94 ksi Draft 6 Columns 0.04 in. (outward) 13.6x10 kip-ft 23.6 ksi 27.8 ksi 6 Pontoon 0.76 in. (upward) 5.30x10 kip-ft 29.76 ksi 29.94 ksi 6 Topside 1.17 in. (downward) 4.62x10 kip-ft 29.88 ksi 29.94 ksi Wave Static Columns 0.05 in. (outward) 13.8x10⁶ kip-ft 23.7 ksi 27.8 ksi Pontoon 0.81 in. (upward) 5.59x10⁶ kip-ft 29.92 ksi 29.94 ksi
- 48. OCEN 407 Design Class Team Malaysia 43 The deflections are small enough to not cause any damage, and should not cause any motion discomfort. The stresses caused by the forces acting on the hull fall within the ABS code. The thickness of 1 inch chosen for the hull is a good value to give small deflections and to keep the stresses within ABS recommendations, but could possibly be reduced to help with reducing moments and stresses, along with cost efficiency. Also, the stresses are very close to the recommended values, which could cause buckling in the beams. Mooring When all required data is entered into GMOOR it can generate a plan view or a 3D view of the inputted mooring system. Figure 43 shows the plan view for the twelve leg taut and semi-taut configurations, the lines are positioned to 30 degrees from horizontal with 15 degrees between each line. Figure 43: 12 Leg Spread Figure 44 shows the plan view for the sixteen leg taut and semi-taut configurations, the lines are positioned to 30 degrees from horizontal with 15 degrees between each line
- 49. OCEN 407 Design Class Team Malaysia 44 Figure 44: 16 Leg Spread Figure 45 shows the results of the tests ran in GMOOR for each mooring configuration. The figure compares the minimum factor of safety for intact and damaged conditions under survival storm conditions with the API guidelines. It also compares the offset of the platform as percent of water depth for operational, survival and damaged survival conditions to the recommended guidelines. 7.00 7% Max Offset 6.00 5% Max Offset 5.00 12 Leg Taut 4.00 1.67 Min Damaged FOS 1.25 Min Damaged FOS 12 Leg Semi -Taut 3.00 16 Leg Taut 16 Leg Semi -Taut 2.00 1.00 0.00 Min FOS Intact Min FOS Max Offset Max Offset Max Offset Damaged Operational (% Survival (% WD) Damaged (% WD) WD) Figure 45: Mooring Analysis Results
- 50. OCEN 407 Design Class Team Malaysia 45 For each of the designs the cost was computed using the different line costs as $3.20 per pound for polyester mooring line, the jacketed spiral costs $2.07 per pound and the chain costs $1.40 per pound. The cost of equipment (chain jacks, fairleads etc.) was $450,000 per line. Figure 46 reflects the cost of each mooring configuration for line material costs and equipment costs, however it does not represent the installation costs. Mooring Line Costs $14,000,000.00 $12,000,000.00 Total Cost in US Dollars $10,000,000.00 $8,000,000.00 $6,000,000.00 $4,000,000.00 $2,000,000.00 $0.00 12 Leg Taut 12 Leg Semi-Taut 16 Leg Taut 16 Leg Semi-Taut Design Type Figure 46: Mooring Material and Equipment Costs After careful comparison of the different mooring designs it was decided that the twelve leg taut mooring system would be the best option. This conclusion was developed based on the fact that the twelve leg taut design while not having the best factor of safeties, it does have values well above the recommended minimum. Also the twelve leg taut design does have a good offset distance it is loose enough to not cause the response to be to rigid while it is tight enough that it doesn’t get too close to recommended max offset. The price of the mooring design also makes this the most cost effective choice. Figure 28 is a 3D drawing of the mooring system created by GMOOR. The 12 leg taut system consists of 200 feet of 2.75 inch diameter K4 Studless chain for the anchor, 7350 feet of 3.94 inch Marlowpoly polyester rope, and 300 feet of 3.0 inch K4 Studless chain for the fairlead. The extra diameter of the chain at the fairlead is to compensate for the extra fatigue generated at the fairlead. The diameters of these chains reflect the added diameter for corrosion allowance as specified by API 2SK guidelines which is a range of 0.2 to 0.4 millimeters per service year. It was decided to be a little conservative in the corrosion allowance so a value of 0.3 millimeter per service year was chosen resulting in an increased of 0.25 inches in diameter for the 20 design life in this project. The tests were performed without the additional corrosion allowance as suggested by API 2SK. The 300 feet of chain at the fairlead allows for the platform to offset in any direction up to 150 feet drilling purposes, at the maximum of 150 feet it was found that the minimum factor of safety in the 10 year storm
- 51. OCEN 407 Design Class Team Malaysia 46 condition is 2.63 intact and 1.94 damaged which meets API guidelines. The total cost of this design is approximately $7.2 million, which includes materials and equipment but not installation costs. Figure 47 shows the 3D rendering created by GMOOR of the chosen 12 leg taut leg mooring system. Figure 47: Chosen 12-leg Taut Mooring Design Figure 48 shows the final 12 leg taut mooring system design, the final component diameters including corrosion allowances and component locations. Figure 48: Final Mooring Design
- 52. OCEN 407 Design Class Team Malaysia 47 After designing the mooring configuration the type and size of anchor needed to be determined. The two options available for a taut leg mooring system are suction piles and vertically loaded drag embedment anchors. For the vertically loaded drag embedment anchor the Vryhof Stevmanta anchor was chosen because the information for sizing was available. Using the Vryhof Anchor Manual and the tension at the anchor found from GMOOR for the chosen mooring design the necessary size of the Stevmanta anchor was found to be 11.36 tons. For designing the suction pile InterMoor volunteered to size the anchor base on the tension load computed in GMOOR. The result was a suction pile 56 feet long with an outside diameter of 6 feet and a wall thickness of 1.65 in. and a top thickness of 5.5 in. The weight of this anchor is 75.5 tons. Because installation and manufacturing costs for both anchors was not available the decision of which anchor to be used had to be based off the material costs. The steel cost of one Stevmanta anchor is approximately $51,000 (USD) and the steel cost of one suction pile is approximately $340,000 (USD). Based on the drastic difference in price the undeniably most cost effective solution was the Stevmanta vertically loaded drag embedment anchor. The steel cost for 12 of these anchors was only $612,000 (USD) approximately. Cost The final mooring line cost with associated equipment for the chosen 12-leg taut system can be seen in Figure 49. Mooring Line Costs $14,000,000.00 $12,000,000.00 Total Cost in US Dollars $10,000,000.00 $8,000,000.00 $6,000,000.00 $4,000,000.00 $2,000,000.00 $0.00 12 Leg Taut 12 Leg Semi-Taut 16 Leg Taut 16 Leg Semi-Taut Design Type Figure 49: Mooring Cost Summary The Stevmanta anchors chosen were priced at $51,000 (USD) a piece, running a total capital cost of $612,000 (USD). Final hull dimensions with approximate densities and $12,000 per ton, cost approximately $184,000,000 (USD) capital. The total capital cost was approximately $192,000,000 (USD).
- 53. OCEN 407 Design Class Team Malaysia 48 Conclusion All of the following objectives of the chosen competencies have been met in excess of minimum recommendations stipulated by pertinent regulatory agencies. • Drafts & Freeboard o A maximum float-on float-off draft of 29.52 ft. determined by Dockwise boat capacity. o A minimum operational freeboard (air gap) of 35 ft. based on metocean data. • Hydrodynamic responses o A minimum natural heave and pitch/roll period of 20 seconds based on client requests for optimum operation of topside separation tanks and risers. o A maximum of +/-16 ft heave response based on ABS recommendations. o A maximum 4◦ pitch/roll for 10 year storm conditions and a maximum 10◦ pitch/roll for 100 year storm conditions based on ABS recommendations. • Large Angle Intact Stability o Righting Arm should be greater than 2 X the heeling arm at the down flooding angle. o Area ratio for a non-ship shaped floating structure should be greater than 1.3. • Large Angle Damaged Stability o There should be a distance greater than 7 degrees between the first intercept of the righting and heeling arm and the down flooding angle. • Structural Stress Allowances o Maximum topside stress of 29.94 ksi o Maximum column stress of 27.8 ksi o Maximum pontoon stress of 29.94 ksi • Mooring o Dynamic intact mooring analysis factor of safety should be greater than 1.67 as per API codes. o Dynamic damaged mooring analysis factor of safety should be greater than 1.25 as per API codes. o Pretension stress for semi-taut and taut-leg mooring systems should not exceed 20% of the breaking strength. o Platform offset for intact mooring system during operations should not exceed 5% of the water depth. o Platform offset for intact mooring system during survival mode should not exceed 7% of the water depth. o Platform offset for damaged mooring system should not exceed 7% of the water depth. o Platform must be able to move 150 feet off center in any direction for drilling purposes. • Cost o Cost should be minimized while meeting all other objectives.
- 54. OCEN 407 Design Class Team Malaysia 49 For the eight aforementioned competencies: 1. General Arrangement and Overall Hull Design 2. Wind and Current Loading 3. Local and Global Loading 4. Weight, Buoyancy and Stability 5. Hydrodynamics of Motions and Loading 6. General Strength and Structural Design 7. Mooring 8. Cost The general hull design had columns heights larger than would be expected. The governing objective forcing the columns higher was the location of the modeled down flooding points instead of the expected minimum freeboard. Further StabCad analysis is suggested to confirm this. If indeed the down flooding angle is the governing factor, the down flooding points should be moved up to the topside deck or above to reduce column height. A reduction of column height in either case will allow a reduction in required pontoon and node sizes further, significantly decreasing capital cost. Sloshing analysis at the natural heave and pitch/roll periods for the tank size should be completed to see how sloshing could effect hull motions before partially filled tanks are accepted for long-term ballasting and trimming design. If sloshing proves to be an issue, tanks should be filled as full as possible, or fitted with floating-top tanks. A significant variable in cost for anchors is in installation. Installation costs could easily swing the chosen anchor design from Stevmanta to SEPLAs. There is also a discrepancy between industry review and product recommendations as to whether drag embedment anchors such as Stevmantas are ideal for a taut-leg mooring system or not. Some suggest that they are ill-fitted due to a lack of precision placement and the SEPLAs would be a better choice. Because of their suction embedment, however, SEPLAs are expected to run a higher installation cost. Clarification as to the precision placement capabilities of Stevmanta anchors and the associated installation costs for the three different types of anchors analyzed (Suction Piles, Stevmanta and SEPLAs) need to be completed before placement.
- 55. OCEN 407 Design Class Team Malaysia 50 References American Bureau of Shipping (ABS) Guide for Building and Classing Facilities on Offshore Installations, Houston, TX. 2000 American Bureau of Shipping. Guide for Building and Classing Floating Production Installations, Houston, TX. 2004 American Bureau of Shipping. Rules for Building and Classing Mobile Offshore Drilling Units, Houston, TX. 2004 American Bureau of Shipping. Rules for Building and Classing Steel Vessels, Houston, TX. 2005. American Petroleum Institute (API). Interim Guidance for Gulf of Mexico MODU Design Practice- 2006 Hurricane Season (API RP95F), Washington D.C. 2006 American Petroleum Institute (API). Recommended Practice for Design and Analysis of Station Keeping Systems for Floating Structures, First Edition. Washington D.C., June 1995. (API 2SK) AutoDesk, Inc. AutoCAD Software, 2004 Computers and Structures, Inc., ETABS, Nonlinear Version 9.0.5, 2005 Global Maritime Consultancy, Ltd. Gmoor32, Version 9.406c, 2001 Gunter and Associates, Inc. StabCAD User’s Manual, 1999.
- 56. OCEN 407 Design Class Team Malaysia 51 Appendix A: Hydrodynamics of Motions and Loading The following spreadsheet was used to take given data, hull dimension changes and estimated densities and weights to process some of the required hydrodynamic properties of the semi- submersible. Design criterion being monitored per design iteration can be seen at the top of the spreadsheet below.
- 57. OCEN 407 Design Class Team Malaysia 52
- 58. OCEN 407 Design Class Team Malaysia 53
- 59. OCEN 407 Design Class Team Malaysia 54
- 60. OCEN 407 Design Class Team Malaysia 55 Appendix B: Ballasting The following spreadsheets give examples of design processes in which varied centers of topside gravity location are tested versus freeboard, hydrodynamic responses, small angle stability, maximum float-on draft and hull ability to counter-ballast offset center of gravity. The topside center of gravity can be seen in the white cells on the left and a partially filled ballasting tank is signified by the blue cells in the plan view of the tank arrangement diagram. Percentage that an individual tank is filled is labeled on that individual tank and riser and mooring tensions are zero in a float-on, float-off scenario. Also included in this appendix is the table used to calculate moment arms used in ballasting.
- 61. OCEN 407 Design Class Team Malaysia 56
- 62. OCEN 407 Design Class Team Malaysia 57
- 63. OCEN 407 Design Class Team Malaysia 58 Appendix C: Environmental Loads The following spreadsheets were used in conjunction with shape and height coefficients as per regulation to calculate concurrent wind, current and mean wave drift environmental loads on the semi-submersible.
- 64. OCEN 407 Design Class Team Malaysia 59
- 65. OCEN 407 Design Class Team Malaysia 60