SOFIA - A Smart Space Application to Dynamically Relate Medical and Environme...
SOFIA - Interactive Quality Visualization (IQVis)- VTT
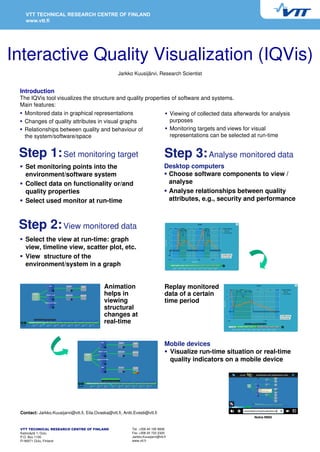
1. Interactive Quality Visualization (IQVis)
Jarkko Kuusijärvi, Research Scientist
Introduction
The IQVis tool visualizes the structure and quality properties of software and systems.
Main features:
Monitored data in graphical representations Viewing of collected data afterwards for analysis
Changes of quality attributes in visual graphs purposes
Relationships between quality and behaviour of Monitoring targets and views for visual
the system/software/space representations can be selected at run-time
Step 1: Set monitoring target Step 3: Analyse monitored data
Set monitoring points into the Desktop computers
environment/software system Choose software components to view /
Collect data on functionality or/and analyse
quality properties Analyse relationships between quality
Select used monitor at run-time attributes, e.g., security and performance
Step 2: View monitored data
Select the view at run-time: graph
view, timeline view, scatter plot, etc.
View structure of the
environment/system in a graph
Animation Replay monitored
helps in data of a certain
viewing time period
structural
changes at
real-time
Mobile devices
Visualize run-time situation or real-time
quality indicators on a mobile device
Contact: Jarkko.Kuusijarvi@vtt.fi, Eila.Ovaska@vtt.fi, Antti.Evesti@vtt.fi
Nokia N900
VTT TECHNICAL RESEARCH CENTRE OF FINLAND Tel. +358 40 195 8606
Kaitoväylä 1, Oulu Fax +358 20 722 2320
P.O. Box 1100 Jarkko.Kuusijarvi@vtt.fi
FI-90571 Oulu, Finland www.vtt.fi