15-mal heruntergeladen

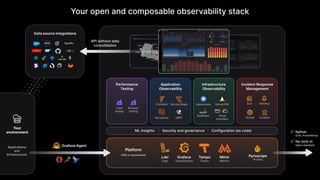
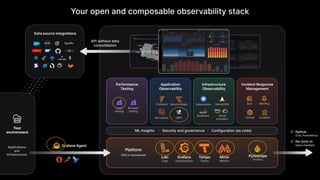
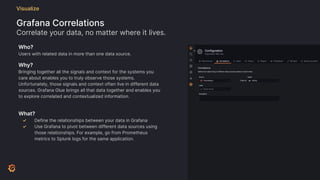
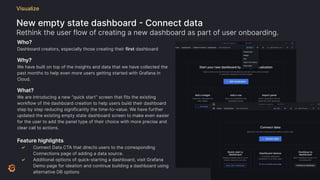

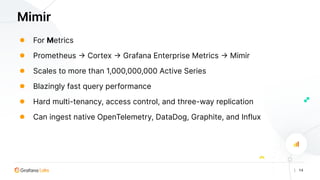
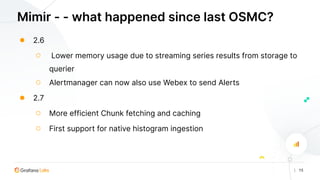
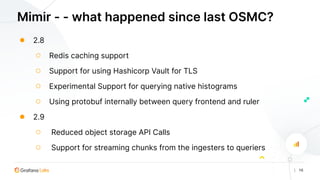
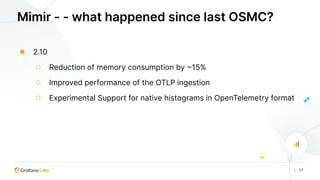

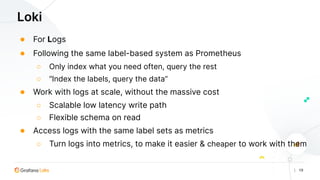
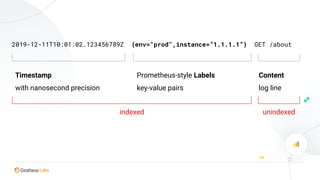
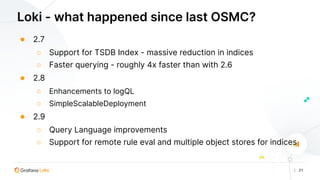
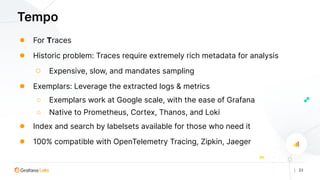
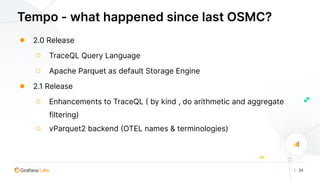
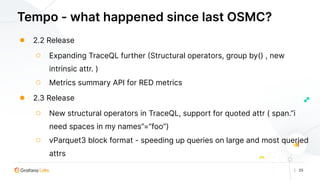
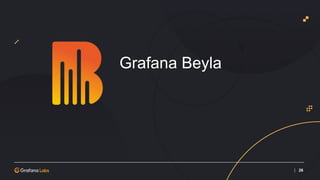
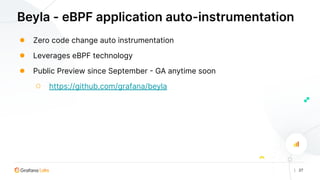

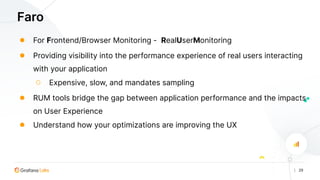

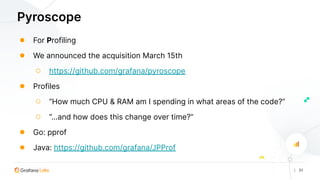


The document provides an overview of updates at Grafana Labs, highlighting features related to observability, including data integration, dashboard creation, and user experience improvements. Key aspects include a new Grafana Glue service for data correlation, a revamped onboarding experience, and enhanced query capabilities for tracing. Additional sections detail advancements in Grafana's various components like Mimir, Loki, Tempo, and the introduction of new tools like Beyla for EBPF auto-instrumentation.


![Ronald McCollam [Grafana] | Flux Queries in Grafana 7 | InfluxDays Virtual Ex...](https://cdn.slidesharecdn.com/ss_thumbnails/2020november-influxdayspresentation-201026193856-thumbnail.jpg?width=640&height=640&fit=bounds)

![Aengus Rooney [Grafana] | What's New with Grafana and InfluxDB | InfluxDays E...](https://cdn.slidesharecdn.com/ss_thumbnails/aengusrooneyslides-210511204556-thumbnail.jpg?width=640&height=640&fit=bounds)