Downloaden Sie, um offline zu lesen

![Simulation eines Verkehrsnetzes mit GPSS/H
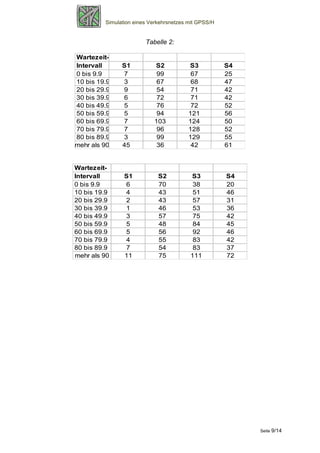
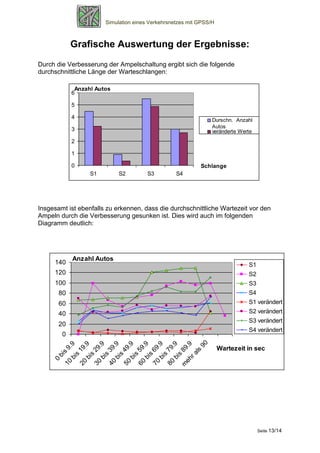
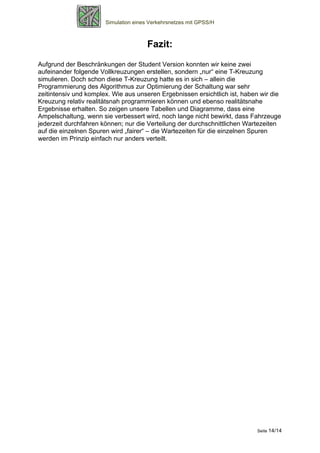
Folgende Ergebnisse erhielten wir für die Autoschlangen S1, S2, S3 und S4:
Tabelle 1:
Max. Länge Durschn. Totale Anzahl Bei grün Durschn. Durschn. WZ
Anzahl Autos durchgefahrener durchgef. Wartezeit ohne durchegef.
Schlange Autos Autos (in %) pro Auto [sec.] Autos pro Auto
S1 11 4,483 802 99 (12,3%) 40.2 46
S2 5 0,895 99 7(7,1%) 65,1 70
S3 12 5,511 902 67(7,4%) 44 47,5
S4 7 3,007 483 25(5,2%) 44.8 47,2
Max. Länge Durschn. Totale Anzahl Bei grün Durschn. Durschn. WZ
Anzahl Autos durchgefahrener durchgef. Wartezeit ohne durchegef.
Schlange Autos Autos (in %) pro Auto [sec.] Autos pro Auto
S1 9 3,22 548 70(12,8%) 42,3 48,5
S2 3 0,36 50 6(12%) 52 59
S3 11 4,87 728 38(5,2%) 48,1 50,8
S4 7 2,71 420 20(4,8%) 46,5 48,8
Tabelle 1 gibt die eigentlich Auslastung der Kreuzung wieder. Zu jeder Schlange ist
jeweils dargestellt:
- die maximale Länge jeder Autoschlange –
- die durchschnittliche Anzahl an Autos in der Schlange
- die totale Anzahl an Autos, die die Schlange durchlaufen haben
- Anzahl der Autos, die ohne zu warten die Kreuzung passieren
konnten
- Die durchschnittliche Wartezeit, die ein Auto in der Schlange warten
musste, einmal inklusive der Anzahl der bei grün durchgefahrenen
Autos sowie einmal exklusive der Anzahl bei grün durchgefahrenen
Autos.
Seite 8/14](https://image.slidesharecdn.com/simulationeinesverkehrsnetzesmitgpss-120506072226-phpapp02/85/Simulation-eines-Verkehrsnetzes-mit-GPSS-H-8-320.jpg)

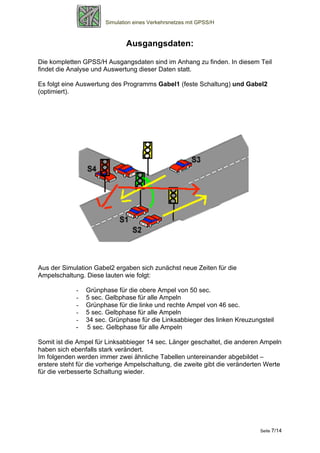
Das Dokument beschreibt die Simulation einer T-Kreuzung mit Ampelschaltung basierend auf GPSs/h durch Andreas Lennartz, wobei das Ziel die realistische Nachbildung und Optimierung der Ampelschaltung zur Minimierung der Wartezeiten war. Aufgrund von Einschränkungen der verwendeten Software mussten die ursprünglichen Projektvorgaben angepasst werden, was zur Entwicklung eines neuen Modells führte, das die dynamische Ampelschaltung optimiert. Die Ergebnisse der Simulation zeigten signifikante Verbesserungen in den Ampelzeiten und reduzierten Wartezeiten für die Fahrzeuge an der Kreuzung.