Downloaden Sie, um offline zu lesen

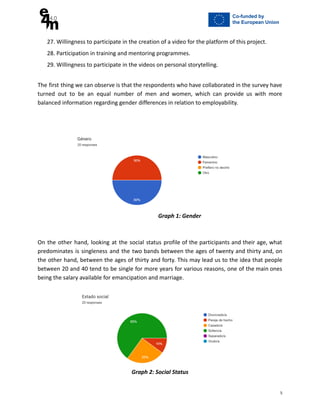
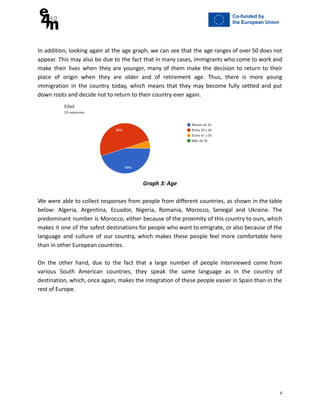
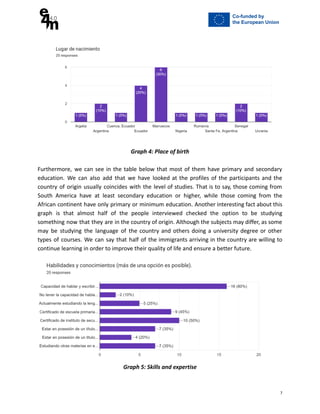
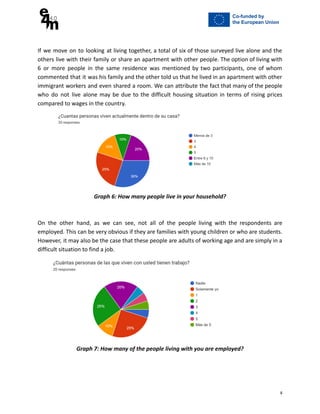
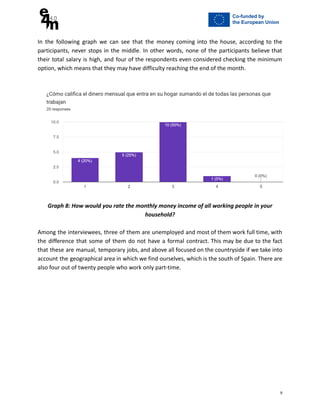

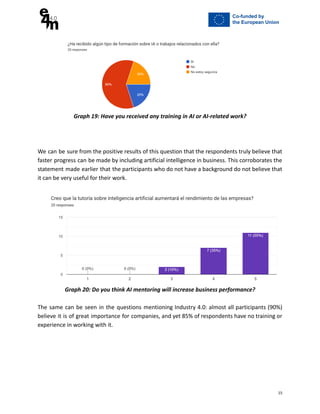

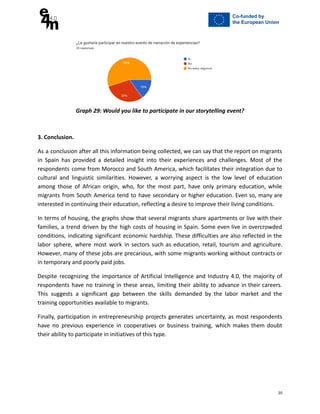
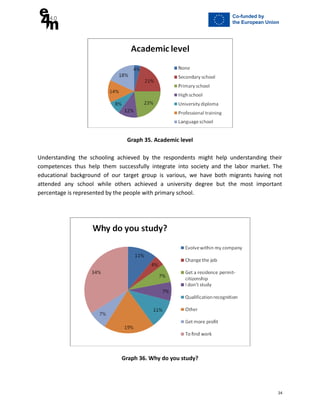

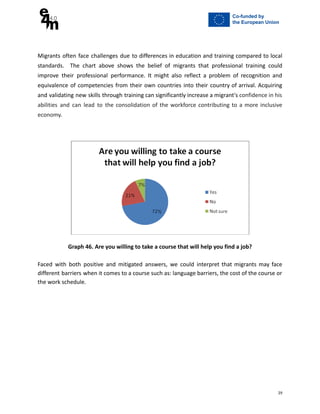
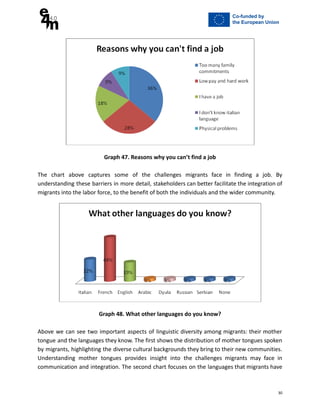
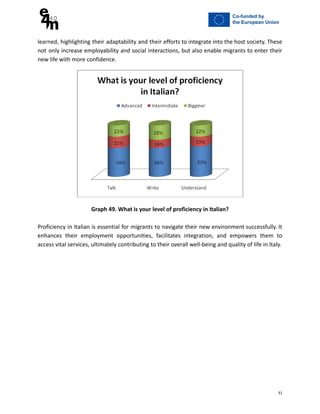
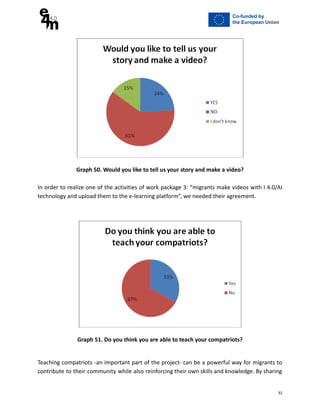


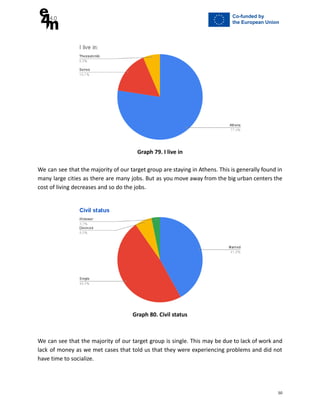
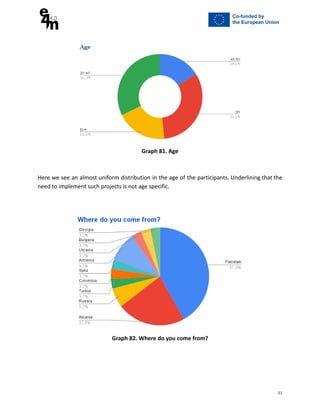
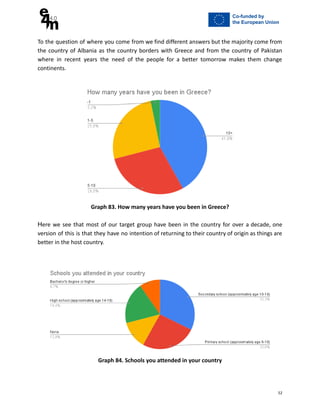
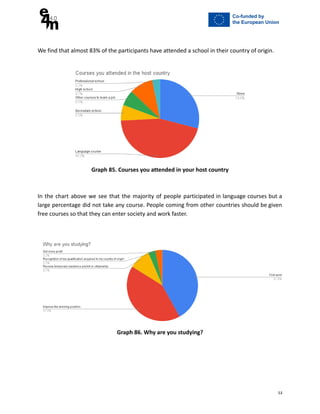
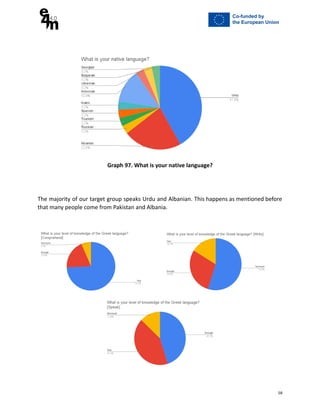
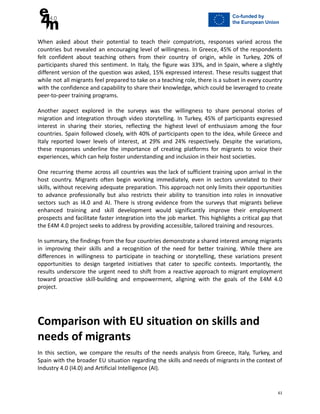


The document presents findings from a survey conducted on migrants in Spain as part of the e4m 4.0 project, aiming to assist migrant entrepreneurs through educational materials and personal storytelling. Key observations include the demographic profiles of respondents, with a significant representation from Morocco and South America, who express a desire for further education, though many face challenges such as low employment levels and qualifications. The survey highlights the importance of training in areas like artificial intelligence and industry 4.0, indicating a need for educational initiatives to enhance migrant skills and integration into the job market.


![[Challenge:Future] BUILDING SUSTAINABLE & CREATIVE EASTERN EUROPE](https://cdn.slidesharecdn.com/ss_thumbnails/challengefuture-building-sustainable-creative-eastern-europe2750-130226113504-phpapp01-thumbnail.jpg?width=640&height=640&fit=bounds)


![[DSC Europe 25] Danilo Djukanovic - From Vibes to KPIs: Turning Culture Into ...](https://cdn.slidesharecdn.com/ss_thumbnails/inqestws5wf0cik2glgv-3-danilo-djukanovic-from-vibes-to-kpis-presentation-260114111931-dacff81f-thumbnail.jpg?width=640&height=640&fit=bounds)


![[DSC Europe 25] Ivica Milaric - The Future of Gaming and AI Tools.pptx](https://cdn.slidesharecdn.com/ss_thumbnails/tijgzsmgse2kj2y5pzzp-5-ivica-milaric-the-future-of-gaming-x-ai-tools-260114111931-87c2b3ac-thumbnail.jpg?width=640&height=640&fit=bounds)

![[DSC Europe 25] Nikola Vasiljevic - Player segmentation by combat playstyles ...](https://cdn.slidesharecdn.com/ss_thumbnails/mnvbf0yvrwaqsipzrrv3-2-nikola-vasiljevic-player-segmentation-by-playstyles-in-action-shooter-games-260114111931-b4d766cd-thumbnail.jpg?width=640&height=640&fit=bounds)


![[DSC Europe 25] Stefan Brankovic - #ResumeIsDead. AI-Powered Interviews and C...](https://cdn.slidesharecdn.com/ss_thumbnails/qnmbsv0xq3uysdrq3sev-2-stefan-brankovic-job-bolt-260114111931-a065aa3d-thumbnail.jpg?width=640&height=640&fit=bounds)


