
Empfohlen
Weitere ähnliche Inhalte
Ähnlich wie Introduction to geological maps and geomorpholgy
Ähnlich wie Introduction to geological maps and geomorpholgy (20)
Kürzlich hochgeladen
Kürzlich hochgeladen (20)
Introduction to geological maps and geomorpholgy
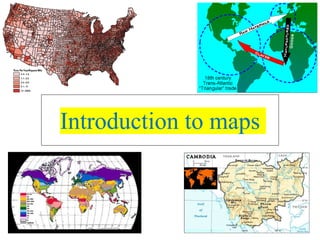
- 2. What is a map? • A generalized view of an area, usually some portion of Earth’s surface, as seen from above at a greatly reduced size • Any geographical image of the environment • A two-dimensional representation of the spatial distribution of selected phenomena
- 3. Why make maps? • To represent a larger area than we can see • To show a phenomenon or process we can’t see with our eyes • To present information concisely • To show spatial relationships
- 4. Represent a larger area
- 8. How do we read maps? • Maps are selective views of reality • Size of the map relative to reality (scale) • What’s on the map (symbolization) • Shape of the map (projection)
- 9. Map scale • Ratio of the distance on the map to the distance on the ground • Scale is a fraction • Larger area covered means larger denominator • Larger denominator means smaller fraction • So a large-scale map covers a small area
- 12. Map scale • Ratio of the distance on the map to the distance on the ground 1. Graphic: • Stays the same when photocopied • Might not be right for the whole map
- 13. Map scale 2. Verbal: 1 inch equals 10 miles • Easy to understand • Can change if photocopied
- 14. Map scale 3. Representative fraction or ratio: 1:24,000 • Units don’t matter • Can change if photocopied
- 15. Map symbolization • Symbols are a code instead of text • Three kinds: point, line, area • Consider shape, size, orientation, pattern, color, value
- 16. Point symbols • Every symbol counts as one occurrence • Qualitative points – Indicate location – Can also describe that location • Quantitative points – Show a distribution – Indicate a value (graduated symbols)
- 25. Area symbols • Each territory or region has one value • Differences in kind • Differences in value – Choropleth maps – Usually, darker indicates more • Cartograms distort area to show value
- 29. Cartogram
- 30. Topographic maps • Also called quadrangles • Nearly 54,000 for the U.S. • Done by the US Geological Survey (USGS) since 1897 • Map out the entire country in a standard fashion
- 31. Topographic maps • Till the 1940s, you climbed to the highest point and plotted what you could see from there • Aerial photography after WWII • Two overlapping photos are put in a stereoscope • 10 photos for each 7.5 minute map
- 32. Topographic maps • Show 2D features, point, line and area; also show 3D via contour lines • Common symbols are in the appendix of the text • Note the contour interval at the bottom of the map