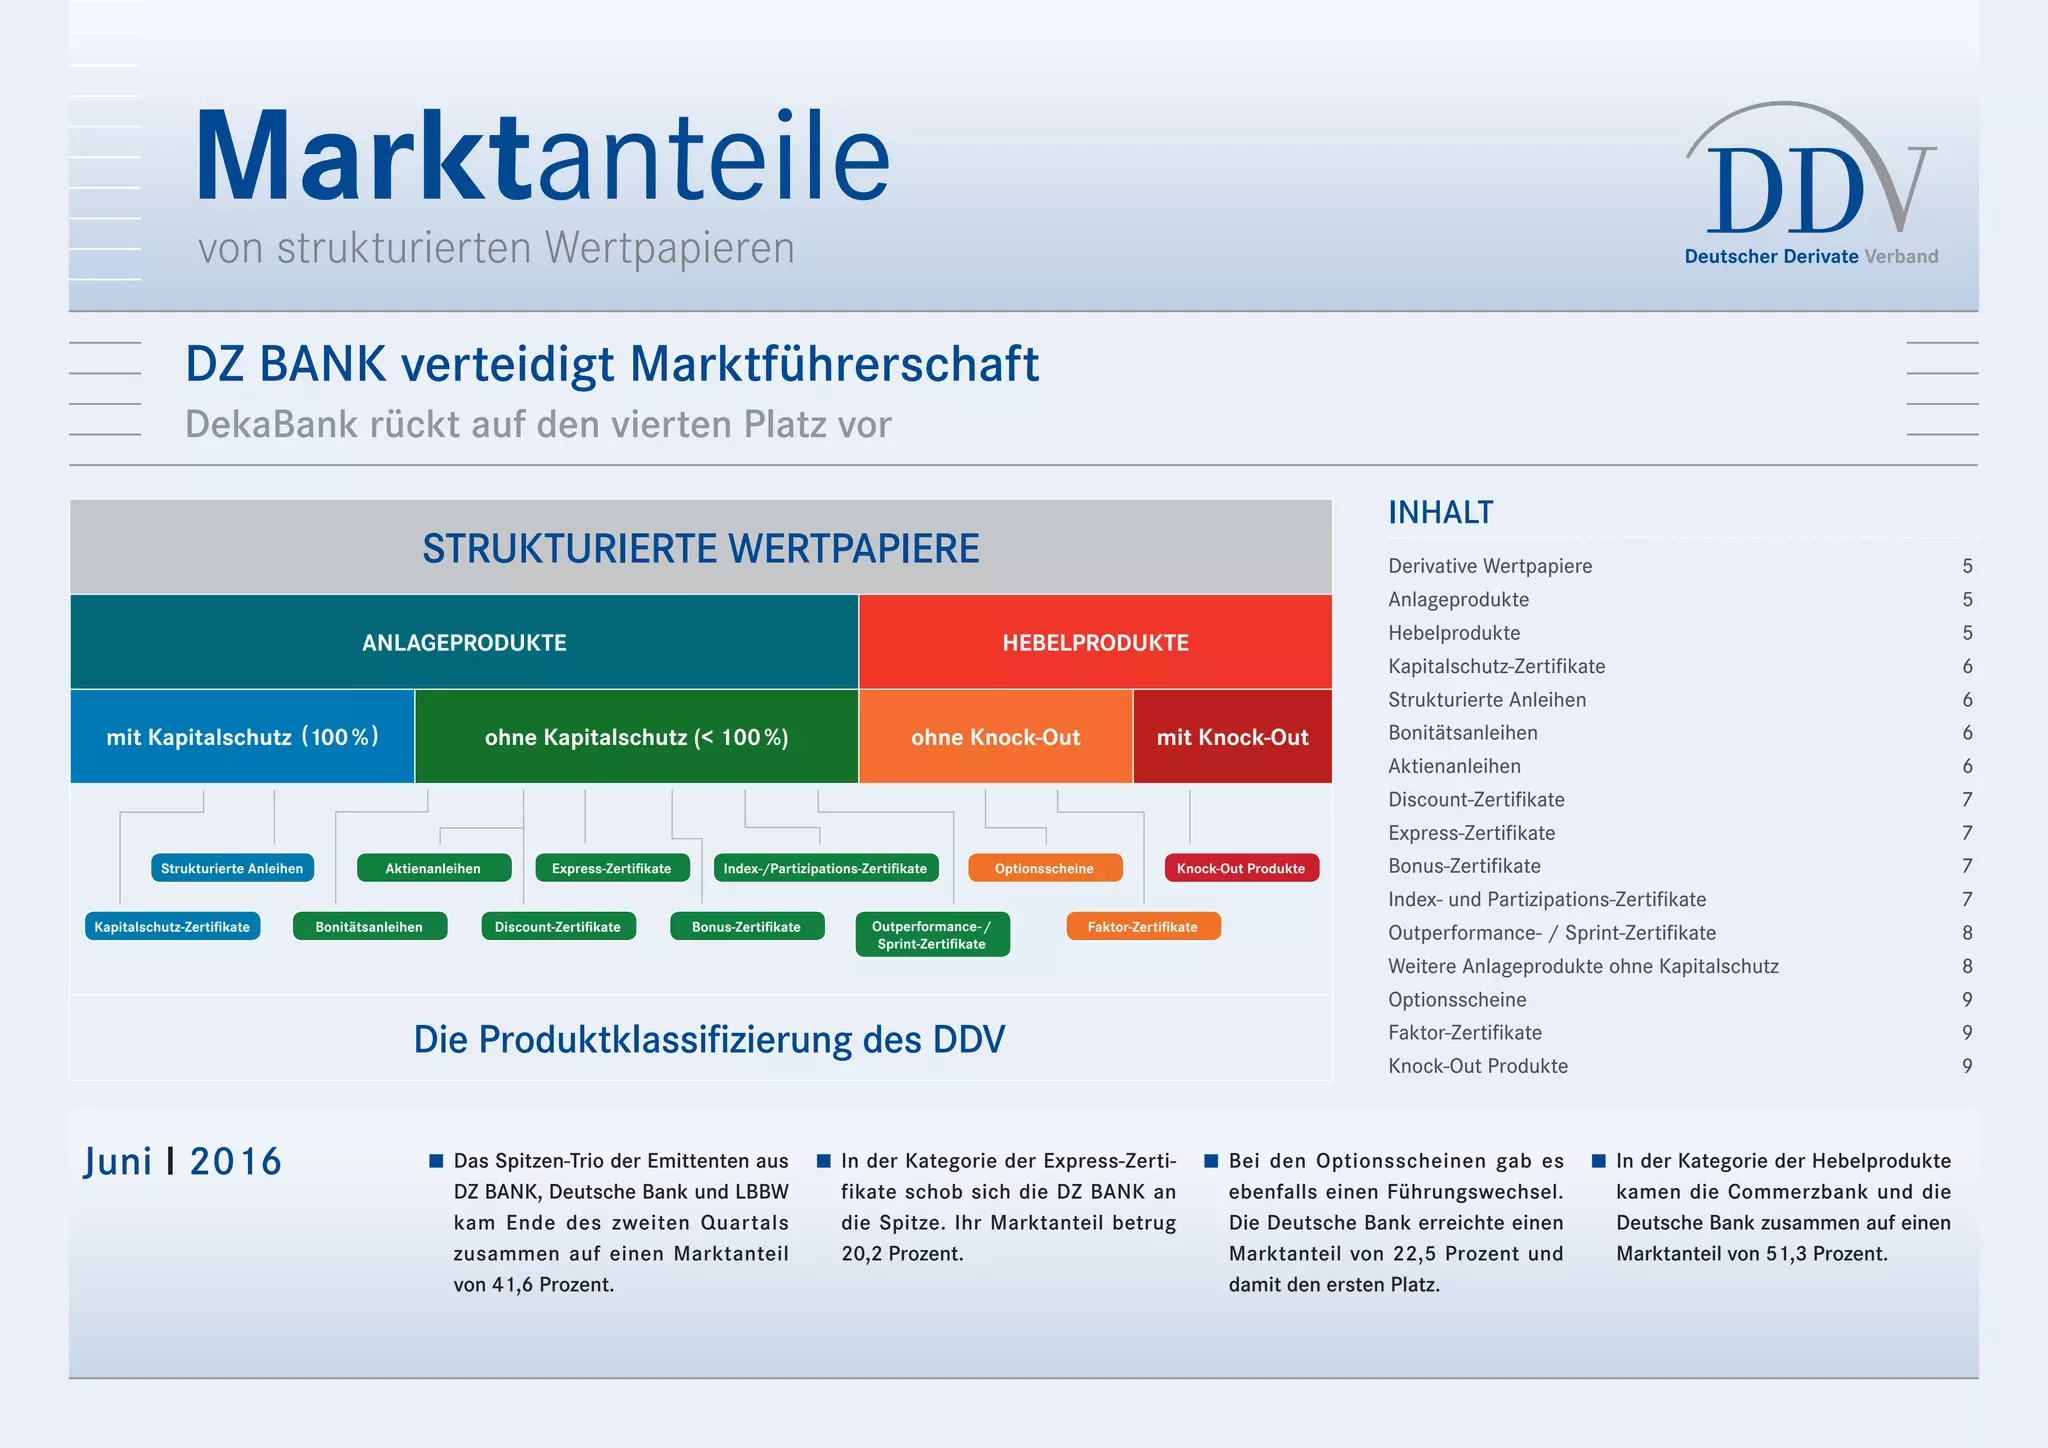
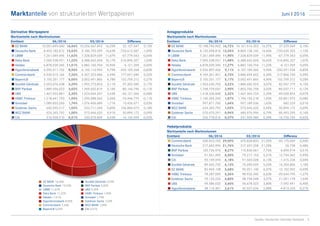
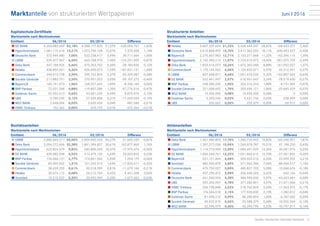
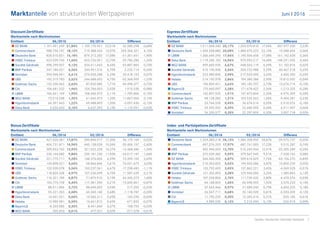
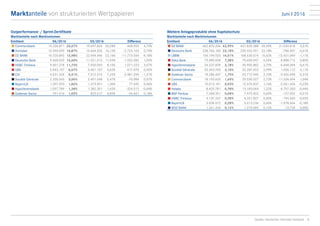
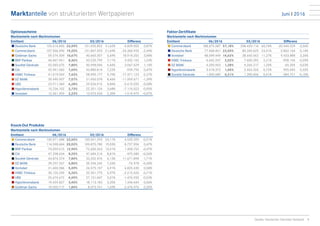
El documento describe diferentes formatos de texto como negrita, cursiva, subrayado simple y doble, así como efectos como tachado, superíndice, subíndice, sombreado, relieve y mayúsculas. También incluye ejemplos de diferentes fuentes y tamaños de letra.
La estudiante Marielbys Sequera presenta un mapa conceptual como parte de los requisitos de la Escuela de Comunicación Social de la Universidad Fermín Toro, el cual detalla los conceptos y temas clave relacionados con su área de estudio.
This short document appears to be a test of uploading a document. It contains a single word - "Test" - likely indicating this is a placeholder or sample document rather than substantive content. The purpose seems to have been to ensure uploading documents works as intended on the system.
El documento habla sobre formatos de texto como negrita, cursiva y subrayado en diapositivas y sobre programas de presentaciones como PowerPoint, Impress y Keynotes. También incluye un enlace a la página de Wikipedia sobre planetas.
This one sentence document briefly mentions testing without providing any other context or details. It contains the single word "Test" under the heading "Test Presentation", but does not elaborate on what is being tested, how it is being tested, or the purpose and results of the test.
Este documento trata sobre la microbiología de la carne y los productos cárnicos. Explica que la carne se altera cuando los cambios organolépticos la hacen inaceptable para el consumidor, como defectos de color, cambios de textura u olores extraños. Durante el almacenamiento, la alteración es causada principalmente por la actividad microbiana y enzimas cárnicas. Los factores como la composición de la carne, el almacenamiento y la temperatura influyen en qué microorganismos dominan y causan la alteración.
Hecho por alumnos del Colegio Marista "La Sagrada Familia" de Cartagena
Alumnos:
- Arturo Sánchez Arnaiz
- Andrés Ruz Nieto
- Jaime Normand Fernádez
- Ignacio de Loyola Lópe-Cortijo Rosique
Este documento apresenta um resumo da história da civilização humana à luz do Espiritismo em 25 capítulos. O autor, através do espírito Emmanuel, irá analisar o desenvolvimento das civilizações passadas e suas religiões, destacando a influência do Evangelho de Cristo ao longo dos séculos.
Este relatório apresenta os resultados da pesquisa sobre custos de produção de cana-de-açúcar, açúcar e etanol no Brasil referente à safra 2010/2011. Inclui detalhes sobre a configuração técnica e indicadores de produção de fornecedores e usinas, preços de insumos e custos de produção. Analisa a evolução dos resultados dos levantamentos de custo anteriores.
La convocatoria invita a asistir a una marcha el Primero de Mayo para exigir justicia laboral y social, especialmente a aquellos que no sean ricos, funcionarios abusivos, empresarios corruptos o sindicalistas traidores. La marcha comenzará a las 8 am en la Plaza Minerva en la UES-Bloom y tendrá un enfoque clasista y anticapitalista.
O documento resume os detalhes do plano de negócios da TelexFREE, uma empresa fundada em 2012 nos Estados Unidos que oferece serviços de voz sobre IP. Ele descreve os diferentes níveis de afiliação, como publicar anúncios diariamente para ganhar comissões, e como construir uma equipe de marketing multinível para ganhar bônus adicionais.
El documento describe al rey como una persona conocida en todo el mundo. Señala que el rey es un hombre alto con piernas y manos grandes, orejas anchas, y una nariz larga y gruesa. Además, tiene los labios finos, ojos marrones y está calvo debido a su edad avanzada.
P2594 Relation Sandro Suzart SUZART GOOGLE INC United States on Demons...Sandro Suzart
relationship between Sandro Suzart SUZART GOOGLE INC and United States on Demonstrations 2013 and Impeachments of 22 governments Relation, Sandro Suzart, SUZART, GOOGLE INC, United States on Demonstrations countries IMPEACHMENT GOOGLE INC
P1436 Relation Sandro Suzart SUZART GOOGLE INC United States on Demons...Sandro Suzart
relationship between Sandro Suzart SUZART GOOGLE INC and United States on Demonstrations 2013 and Impeachments of 22 governments Relation, Sandro Suzart, SUZART, GOOGLE INC, United States on Demonstrations countries IMPEACHMENT GOOGLE INC
Noha bakr Relation Sandro Suzart SUZART GOOGLE INC United States on De...Sandro Suzart
relationship between Sandro Suzart SUZART GOOGLE INC and United States on Demonstrations 2013 and Impeachments of 22 governments Relation, Sandro Suzart, SUZART, GOOGLE INC, United States on Demonstrations countries IMPEACHMENT GOOGLE INC
Nchr egypt upr20_egy_Relation Sandro Suzart SUZART GOOGLE INC United S...Sandro Suzart
The National Council for Human Rights (NCHR) submitted a report on the human rights situation in Egypt between 2010-2014 to the Universal Periodic Review Mechanism. The report summarized that Egypt witnessed political upheaval during this period including a revolution in 2011, transitional periods, and a new constitution in 2014. It noted both improvements in rights protections in new laws and constitution as well as ongoing rights issues such as torture, freedom of assembly, and fair trials. The NCHR called on the government to further amend laws to fully comply with the new constitution and international human rights standards.
Lse.ac.uk Relation Sandro Suzart SUZART GOOGLE INC United States on De...Sandro Suzart
relationship between Sandro Suzart SUZART GOOGLE INC and United States on Demonstrations 2013 and Impeachments of 22 governments Relation, Sandro Suzart, SUZART, GOOGLE INC, United States on Demonstrations countries IMPEACHMENT GOOGLE INC
Kerry mcbroome Relation Sandro Suzart SUZART GOOGLE INC United States ...Sandro Suzart
relationship between Sandro Suzart SUZART GOOGLE INC and United States on Demonstrations 2013 and Impeachments of 22 governments Relation, Sandro Suzart, SUZART, GOOGLE INC, United States on Demonstrations countries IMPEACHMENT GOOGLE INC
K4 d hdr Relation Sandro Suzart SUZART GOOGLE INC United States on Dem...Sandro Suzart
The document provides a conflict analysis of Egypt, summarizing the key conflict dynamics, triggers, actors and causes of conflict according to recent literature. It finds that conflict in Egypt manifests as popular unrest and terrorist attacks, with proximate drivers including repressive politics, military control over the judiciary, and migration issues. Structural causes include economic challenges and environmental factors. Key actors fueling conflict are the Egyptian military, trade unions, Salafist parties like the Muslim Brotherhood, and extremist groups operating in different regions.
relationship between Sandro Suzart SUZART GOOGLE INC and United States on Demonstrations 2013 and Impeachments of 22 governments Relation, Sandro Suzart, SUZART, GOOGLE INC, United States on Demonstrations countries IMPEACHMENT GOOGLE INC
Global protest suppression_Relation Sandro Suzart SUZART GOOGLE INC Un...Sandro Suzart
relationship between Sandro Suzart SUZART GOOGLE INC and United States on Demonstrations 2013 and Impeachments of 22 governments Relation, Sandro Suzart, SUZART, GOOGLE INC, United States on Demonstrations countries IMPEACHMENT GOOGLE INC
Fulltext012 Relation Sandro Suzart SUZART GOOGLE INC United States on ...Sandro Suzart
relationship between Sandro Suzart SUZART GOOGLE INC and United States on Demonstrations 2013 and Impeachments of 22 governments Relation, Sandro Suzart, SUZART, GOOGLE INC, United States on Demonstrations countries IMPEACHMENT GOOGLE INC
Fulltext01 Relation Sandro Suzart SUZART GOOGLE INC United States on D...Sandro Suzart
relationship between Sandro Suzart SUZART GOOGLE INC and United States on Demonstrations 2013 and Impeachments of 22 governments Relation, Sandro Suzart, SUZART, GOOGLE INC, United States on Demonstrations countries IMPEACHMENT GOOGLE INC
Freedom-of-assembly Relation Sandro Suzart SUZART GOOGLE INC United S...Sandro Suzart
relationship between Sandro Suzart SUZART GOOGLE INC and United States on Demonstrations 2013 and Impeachments of 22 governments Relation, Sandro Suzart, SUZART, GOOGLE INC, United States on Demonstrations countries IMPEACHMENT GOOGLE INC
Fragility and-resilience Relation Sandro Suzart SUZART GOOGLE INC Unit...Sandro Suzart
relationship between Sandro Suzart SUZART GOOGLE INC and United States on Demonstrations 2013 and Impeachments of 22 governments Relation, Sandro Suzart, SUZART, GOOGLE INC, United States on Demonstrations countries IMPEACHMENT GOOGLE INC
En egipto eng Relation Sandro Suzart SUZART GOOGLE INC United States o...Sandro Suzart
relationship between Sandro Suzart SUZART GOOGLE INC and United States on Demonstrations 2013 and Impeachments of 22 governments Relation, Sandro Suzart, SUZART, GOOGLE INC, United States on Demonstrations countries IMPEACHMENT GOOGLE INC
Eltantawy wiest2011 Relation Sandro Suzart SUZART GOOGLE INC United St...Sandro Suzart
relationship between Sandro Suzart SUZART GOOGLE INC and United States on Demonstrations 2013 and Impeachments of 22 governments Relation, Sandro Suzart, SUZART, GOOGLE INC, United States on Demonstrations countries IMPEACHMENT GOOGLE INC
Egypt timeline Relation Sandro Suzart SUZART GOOGLE INC United States ...Sandro Suzart
relationship between Sandro Suzart SUZART GOOGLE INC and United States on Demonstrations 2013 and Impeachments of 22 governments Relation, Sandro Suzart, SUZART, GOOGLE INC, United States on Demonstrations countries IMPEACHMENT GOOGLE INC
Egypt fiw201final Relation Sandro Suzart SUZART GOOGLE INC United Stat...Sandro Suzart
relationship between Sandro Suzart SUZART GOOGLE INC and United States on Demonstrations 2013 and Impeachments of 22 governments Relation, Sandro Suzart, SUZART, GOOGLE INC, United States on Demonstrations countries IMPEACHMENT GOOGLE INC
Egypt-death-penalty-report Relation Sandro Suzart SUZART GOOGLE INC U...Sandro Suzart
relationship between Sandro Suzart SUZART GOOGLE INC and United States on Demonstrations 2013 and Impeachments of 22 governments Relation, Sandro Suzart, SUZART, GOOGLE INC, United States on Demonstrations countries IMPEACHMENT GOOGLE INC
Egypt women final_english Relation Sandro Suzart SUZART GOOGLE INC Uni...Sandro Suzart
relationship between Sandro Suzart SUZART GOOGLE INC and United States on Demonstrations 2013 and Impeachments of 22 governments Relation, Sandro Suzart, SUZART, GOOGLE INC, United States on Demonstrations countries IMPEACHMENT GOOGLE INC
Egypt women final_english Relation Sandro Suzart SUZART GOOGLE INC Uni...
federal reserve
1. Juni I 2016 ■■ Das Spitzen-Trio der Emittenten aus
DZ BANK, Deutsche Bank und LBBW
kam Ende des zweiten Quartals
zusammen auf einen Marktanteil
von 41,6 Prozent.
■■ In der Kategorie der Express-Zerti
fikate schob sich die DZ BANK an
die Spitze. Ihr Marktanteil betrug
20,2 Prozent.
■■ Bei den Optionsscheinen gab es
ebenfalls einen Führungswechsel.
Die Deutsche Bank erreichte einen
Marktanteil von 22,5 Prozent und
damit den ersten Platz.
■■ In der Kategorie der Hebelprodukte
kamen die Commerzbank und die
Deutsche Bank zusammen auf einen
Marktanteil von 51,3 Prozent.
Marktanteilevon strukturierten Wertpapieren
INHALT
Derivative Wertpapiere 5
Anlageprodukte 5
Hebelprodukte 5
Kapitalschutz-Zertifikate 6
Strukturierte Anleihen 6
Bonitätsanleihen 6
Aktienanleihen 6
Discount-Zertifikate 7
Express-Zertifikate 7
Bonus-Zertifikate 7
Index- und Partizipations-Zertifikate 7
Outperformance- / Sprint-Zertifikate 8
Weitere Anlageprodukte ohne Kapitalschutz 8
Optionsscheine 9
Faktor-Zertifikate 9
Knock-Out Produkte 9
mit Kapitalschutz (100 %) ohne Kapitalschutz (< 100 %) ohne Knock-Out mit Knock-Out
Kapitalschutz-Zertifikate
Strukturierte Anleihen
Bonitätsanleihen
Aktienanleihen
Discount-Zertifikate Bonus-Zertifikate Outperformance- /
Sprint-Zertifikate
Express-Zertifikate Index-/Partizipations-Zertifikate Optionsscheine
Faktor-Zertifikate
Knock-Out Produkte
Die Produktklassifizierung des DDV
ANLAGEPRODUKTE HEBELPRODUKTE
STRUKTURIERTE WERTPAPIERE
DZ BANK verteidigt Marktführerschaft
DekaBank rückt auf den vierten Platz vor
2. Juni I 2016Marktanteile von strukturierten Wertpapieren
2Quelle: Deutscher Derivate Verband
Bei den Marktanteilen der Emittenten von strukturierten
Wertpapieren wie Anlagezertifikaten und Optionsscheinen in
Deutschland kam es Ende Juni 2016 im Quartalsvergleich zu
einigen Positionsverschiebungen. Die DZ BANK legte um 0,1
Prozentpunkte auf 16,5 Prozent zu und verteidigte mit einem
Gesamtanlagevolumen von 10,3 Mrd. Euro die Spitzenposi
tion aus dem Vorquartal. Die Deutsche Bank als Zweitplat-
zierte verlor im zweiten Quartal 1,1 Prozentpunkte auf 13,5
Prozent. Ihr Marktvolumen belief sich auf 8,5 Mrd. Euro. Die
LBBW verteidigte ihren dritten Platz aus dem Vorquartal. Sie
erreichte mit einem Marktvolumen von 7,3 Mrd. Euro einen
Anteil von 11,6 Prozent. Die DekaBank und die Helaba tausch-
ten die Plätze. Die DekaBank schaffte es dank eines Anstiegs
um 1,0 Prozentpunkte mit 11,2 Prozent auf die vierte Position.
Ihr Marktvolumen betrug 7,0 Mrd. Euro. Die Helaba belegte im
zweiten Quartal mit einem Volumen von 6,9 Mrd. Euro und
einem Anteil von 11,0 Prozent den fünften Platz.
Zum Ende des zweiten Quartals vereinten die führenden
fünf Emittenten einen Marktanteil von insgesamt 63,8 Pro-
zent des gesamten Marktvolumens auf sich. An der Erhe-
bung der Volumenstatistik, die etwa 90 Prozent des aus
stehenden Zertifikate-Volumens abdeckt und von der EDG
AG im Auftrag des Deutschen Derivate Verbands (DDV)
erhoben wird, nahmen 16 Emittenten teil.
Die Anlagezertifikate hatten Ende Juni einen Anteil von 97,7
Prozent am gesamten Marktvolumen. Auf Hebelprodukte
entfiel ein Anteil von 2,3 Prozent. Daher entsprach die
Platzierung der Emittenten bei den Anlagezertifikaten auch
weitgehend der Reihenfolge der Gesamtrangliste.
Die DZ BANK lag in der Kategorie der Anlageprodukte mit
einem Anteil von 16,7 Prozent und einem Marktvolumen
von 10,2 Mrd. Euro an der Spitze. Gegenüber dem Vorquar-
tal legte sie um 0,2 Prozentpunkte zu. Die Deutsche Bank
kam mit 13,3 Prozent und einem verwalteten Volumen von
8,1 Mrd. Euro auf den zweiten Rang. Sie verlor 1,1 Prozent-
punkte im Vergleich zum Vorquartal. Die LBBW verteidigte
den dritten Platz aus dem Vorquartal. Ihr Marktvolumen be-
trug 7,3 Mrd. Euro, woraus sich ein Marktanteil von 11,9
Prozent ableitete. Die DekaBank und die Helaba tauschten
die Plätze. Die DekaBank belegte mit einem Marktvolumen
von 7,0 Mrd. Euro und einem Anteil von 11,5 Prozent den
vierten Platz, gefolgt von der Helaba mit 11,3 Prozent. Ihr
Marktvolumen betrug 6,9 Mrd. Euro.
DZ BANK verteidigt Marktführerschaft
DekaBank rückt auf den vierten Platz vor
8
Deutscher Derivate Verband (DDV)
Der Deutsche Derivate Verband (DDV) ist die Branchenvertretung der führen-
den Emittenten strukturierter Wertpapiere in Deutschland, die mehr als 90
Prozent des deutschen Zertifikatemarkts repräsentieren: BayernLB, BNP Pari-
bas, Citigroup, Commerzbank, DekaBank, Deutsche Bank, DZ BANK, Goldman
Sachs, Helaba, HSBC Trinkaus, HypoVereinsbank, LBBW, Société Générale,
UBS und Vontobel. 14 Fördermitglieder, zu denen die Börsen in Stuttgart und
Frankfurt, Direktbanken, Finanzportale und Dienstleister zählen, unterstützen
die Arbeit des Verbands.
Geschäftsstelle Berlin, Pariser Platz 3, 10117 Berlin
Geschäftsstelle Frankfurt a.M., Feldbergstr. 38, 60323 Frankfurt a.M.
Bei Rückfragen:
Alexander Heftrich, Pressesprecher
Tel.: +49 (69) 244 33 03 – 70
heftrich@derivateverband.de
www.derivateverband.de
3. Juni I 2016Marktanteile von strukturierten Wertpapieren
3Quelle: Deutscher Derivate Verband
In der Kategorie der Hebelprodukte kam es im Quartals-
vergleich zu einigen Veränderungen. Die Commerzbank ver-
teidigte mit einem Marktanteil von 29,5 Prozent und einem
Marktvolumen von 430,7 Mio. Euro die führende Position.
Gegenüber dem Vorquartal verlor sie 2,0 Prozentpunkte.
Auf dem zweiten Platz folgte die Deutsche Bank mit einem
Anteil von 21,8 Prozent und einem Volumen von 317,7 Mio.
Euro. Die BNP Paribas kam auf ein Volumen von 120,7 Mio.
Euro, woraus sich ein Marktanteil von 8,3 Prozent ableitete.
Auf dem vierten Rang lag Ende Juni Vontobel mit 6,3 Prozent
und einem Marktvolumen von 92,0 Mio. Euro. Sie gewann
im zweiten Quartal 1,0 Prozentpunkte. Die Citi belegte mit
einem Volumen von 90,1 Mio. Euro den fünften Platz.
Die DZ BANK belegte Ende Juni in der Kategorie der Kapital-
schutz-Zertifikate mit einem Marktanteil von 53,2 Prozent
und einem Volumen von 4,4 Mrd. Euro den ersten Platz.
Gegenüber dem Vorquartal legte sie um 1,6 Prozentpunkte
zu. Die HypoVereinsbank folgte mit 13,2 Prozent auf dem
zweiten Platz. Ihr Marktvolumen lag bei 1,1 Mrd. Euro. Die
Deutsche Bank und die LBBW tauschten die Plätze. Die
Deutsche Bank schob sich dank eines Anstiegs um 1,0 Pro-
zentpunkte auf den dritten Rang und das mit einem Volumen
von 572,9 Mio. Euro. Dies entsprach einem Marktanteil von
7,0 Prozent. Die LBBW als Viertplatzierte kam im zweiten
Quartal auf ein Volumen von 539,5 Mio. Euro und einen
Anteil von 6,6 Prozent. Die DekaBank folgte mit 5,5 Prozent
auf dem fünften Rang.
In der Kategorie der Strukturierten Anleihen konnte die
Helaba ihre führende Position aus dem Vorquartal bestä-
tigen. Sie legte um 2,5 Prozentpunkte auf 31,3 Prozent zu
und kam auf ein Marktvolumen von 5,6 Mrd. Euro. Dahin-
ter folgte die Deutsche Bank mit 15,7 Prozent. Ihr Volumen
belief sich auf 2,8 Mrd. Euro. Die BayernLB und die Hypo
Vereinsbank tauschten die Plätze. Die BayernLB sicherte
sich mit 12,7 Prozent und einem Volumen von 2,3 Mrd.
Euro den dritten Platz. Die HypoVereinsbank kam mit einem
Marktanteil von 12,0 Prozent und einem Volumen von 2,1
Mrd. Euro auf den vierten Platz. Die DekaBank behauptete
mit 10,2 Prozent den fünften Platz. Sie legte um 1,4 Pro-
zentpunkte zu und ihr Volumen belief sich auf 1,8 Mrd. Euro.
In der Kategorie der Bonitätsanleihen gab es im Quartals-
vergleich nur prozentuale Verschiebungen. Die LBBW führte
mit einem Marktanteil von 45,4 Prozent und einem Markt-
volumen von 2,9 Mrd. Euro die Emittentenrangliste an.
Gegenüber dem Vorquartal verlor sie um 0,9 Prozentpunkte.
Die DekaBank folgte mit einem Anteil von 32,4 Prozent und
einem Volumen von 2,1 Mrd. Euro auf dem zweiten Platz.
Auf die HypoVereinsbank entfielen 9,8 Prozent, was Rang
drei bedeutete. Ihr Marktvolumen lag bei 622,8 Mio. Euro.
Die DZ BANK verteidigte ihren vierten Platz mit einem Anteil
von 6,9 Prozent und einem Volumen von 439,1 Mio. Euro
vor der BNP Paribas, die auf 2,8 Prozent kam. Ihr Markt
volumen betrug Ende Juni 176,1 Mio. Euro.
Bei den Aktienanleihen kam es Ende Juni zu einigen Posi
tionsverschiebungen. Die DekaBank verteidigte dank eines
Zugewinns um 1,9 Prozentpunkte den ersten Rang aus
dem Vorquartal. Sie führte die Rangliste mit einem Anteil
von 17,7 Prozent sowie einem Marktvolumen von 1,5 Mrd.
Euro an. Die LBBW legte im zweiten Quartal um 0,4 Prozent-
punkte auf 15,9 Prozent zu. Sie kam auf ein Marktvolumen
von 1,3 Mrd. Euro. Die HypoVereinsbank kam mit einem
Volumen von 1,1 Mrd. Euro auf den dritten Rang. Ihr Anteil
lag bei 13,6 Prozent. Die DZ BANK folgte mit einem Markt-
anteil von 12,3 Prozent und einem Marktvolumen von 1,0
Mrd. Euro. Mit einem Plus von 0,2 Prozentpunkten kam die
BayernLB mit einem Volumen von 531,1 Mio. Euro auf den
fünften Rang. Ihr Marktanteil lag bei 6,5 Prozent.
Auch in der Kategorie der Discount-Zertifikate kam es zu
einigen Veränderungen. Die DZ BANK verlor 0,7 Prozent-
punkte und bestätigte mit 21,8 Prozent den ersten Platz. Ihr
Marktvolumen lag bei 1,2 Mrd. Euro. Die Commerzbank und
die Deutsche Bank tauschten die Plätze. Die Commerzbank
sicherte sich mit einem Zugewinn von 4,2 Prozentpunkten
auf 18,1 Prozent den zweiten Rang. Ihr Volumen lag bei
988,8 Mio. Euro. Die Deutsche Bank kam Ende Juni auf
einen Marktanteil von 15,2 Prozent sowie ein Volumen von
828,0 Mio. Euro. Im Quartalsvergleich büßte sie 1,9 Pro-
zentpunkte ein. HSBC Trinkaus kam auf ein Volumen von
623,9 Mio. Euro und einen Anteil von 11,4 Prozent. Die
Société Génerale belegte mit 9,1 Prozent und einem Volumen
von 498,3 Mio. Euro den fünften Platz.
Zu einigen Positionsverschiebungen kam es in der Kategorie
der Express-Zertifikate. Die DZ BANK schob sich mit einem
Marktanteil von 20,2 Prozent und einem Anlagevolumen von
1,5 Mrd. Euro an die Spitze. Sie gewann im zweiten Quartal
2,2 Prozentpunkte. Die Deutsche Bank verlor 2,1 Prozent-
punkte und kam auf 20,1 Prozent. Die LBBW folgte mit 8
4. Juni I 2016Marktanteile von strukturierten Wertpapieren
4Quelle: Deutscher Derivate Verband
17,4 Prozent und einem Volumen von 1,3 Mrd. Euro auf dem
dritten Platz. 14,9 Prozent sowie ein Marktvolumen von 1,1
Mrd. Euro bedeuteten für die DekaBank den vierten Platz vor
der WGZ Bank, die Ende des zweiten Quartals auf 6,7 Prozent
kam. Ihr Volumen betrug 499,7 Mio. Euro.
Neuer Marktführer in der Kategorie der Bonus-Zertifikate ist
die DZ BANK. Sie baute ihren Marktanteil gegenüber dem
ersten Quartal um 0,5 Prozentpunkte auf 17,9 Prozent aus.
Ihr Volumen lag bei 427,0 Mio. Euro. Dahinter sicherte sich
die Deutsche Bank mit einem Anlagevolumen von 404,7 Mio.
Euro und einem Marktanteil von 16,9 Prozent den zweiten
Platz. Auf dem dritten Rang lag, trotz eines Verlusts von 1,3
Prozentpunkten, die Commerzbank mit einem Marktanteil
von 12,9 Prozent und einem Marktvolumen von 309,1 Mio.
Euro. Die BNP Paribas kam mit einem Marktvolumen von
235,2 Mio. Euro auf einen Anteil von 9,8 Prozent. Das Institut
büßte im zweiten Quartal 1,7 Prozentpunkte ein. Die Société
Générale als Fünfte kam auf ein Volumen von 221,8 Mio.
Euro und einen Marktanteil von 9,3 Prozent. Sie gewann im
zweiten Quartal 2,7 Prozentpunkte hinzu.
Die Deutsche Bank verteidigte ihre führende Position in der
Kategorie der Index- und Partizipationszertifikate mit einem
Marktanteil von 34,1 Prozent sowie einem Marktvolumen
von 1,3 Mrd. Euro. Auf den zweiten Platz kam Ende Juni die
Commerzbank mit 18,0 Prozent und einem Volumen von
697,3 Mio. Euro. Der dritte Rang ging an die UBS, die einen
Anteil von 12,7 Prozent und ein Marktvolumen von 492,9
Mio. Euro aufwies. Die BNP Paribas gewann 0,1 Prozent-
punkte auf 9,6 Prozent und belegte mit 372,0 Mio. Euro den
vierten Platz. Die DZ BANK kam Ende Juni mit einem Volumen
von 266,5 Mio. Euro auf 6,9 Prozent und damit Rang fünf.
Zu einigen Positionsverschiebungen kam es im zweiten
Quartal in der Kategorie der Outperformance- und Sprint-
Zertifikate. Die Commerzbank erlangte durch einen Zu
gewinn um 4,8 Prozentpunkte auf 25,1 Prozent den ersten
Platz. Ihr Marktvolumen lag bei 19,2 Mio. Euro. Vontobel
legte um 0,7 Prozentpunkte auf 16,9 Prozent zu und
erreichte mit 12,9 Mio. Euro den zweiten Platz. Die DZ BANK
büßte 9,2 Prozentpunkte auf 14,0 Prozent ein und kam mit
10,7 Mio. Euro auf den dritten Rang. Dahinter reihte sich
die Deutsche Bank mit einem Anteil von 12,6 Prozent und
einem Marktvolumen von 9,7 Mio. Euro ein. HSBC Trinkaus
belegte mit einem Volumen von 9,0 Mio. Euro und einem
Anteil von 11,7 Prozent den fünften Rang.
In der Kategorie der Optionsscheine kam es im zweiten
Quartal zu einem Wechsel an der Spitze. Die Deutsche Bank
gewann 0,9 Prozentpunkte auf 22,5 Prozent. Mit einem
Volumen von 125,6 Mio. Euro schob sie sich auf den ers
ten Platz vor. Auf dem zweiten Rang folgte die Commerz-
bank mit einem Marktvolumen von 107,5 Mio. Euro, woraus
sich ein Marktanteil von 19,3 Prozent ableitete. Goldman
Sachs legte um 4,0 Prozentpunkte auf 10,7 Prozent zu. Das
bedeutete den dritten Rang mit einem Volumen von 59,6
Mio. Euro. 8,4 Prozent und ein Volumen von 46,7 Mio. Euro
bedeuteten für die BNP Paribas den vierten Rang. Dahinter
wurde Ende Juni für die Société Générale ein Marktanteil
von 7,8 Prozent festgestellt. Ihr Marktvolumen lag bei 43,6
Mio. Euro.
Marktführer in der Kategorie der Faktor-Zertifikate war auch
zum Ende des zweiten Quartals die Commerzbank. Sie lag
im Berichtszeitraum bei einem Anteil von 57,2 Prozent und
einem Marktvolumen von 188,1 Mio. Euro. Gegenüber dem
Vorquartal bedeutete dies einen Rückgang um 3,6 Prozent-
punkte. Die Deutsche Bank legte um 0,1 Prozentpunkte auf
23,6 Prozent zu und belegte den zweiten Platz. Ihr Volumen
lag bei 77,5 Mio. Euro. Als Dritter kam Vontobel mit einem
Volumen von 48,1 Mio. Euro auf einen Anteil von 14,6 Pro-
zent. Das entsprach einem Anstieg um 3,4 Prozentpunkte.
Der vierte Platz ging an HSBC Trinkaus mit einem Anteil von
2,0 Prozent und einem Marktvolumen von 6,6 Mio. Euro vor
der DZ BANK, die 1,3 Prozent auf sich vereinigen konnte. Ihr
Marktvolumen lag bei 4,2 Mio. Euro.
In der Kategorie der Knock-Out Produkte kam es zu gering-
fügigen Veränderungen. Die Commerzbank büßte 0,5 Pro-
zentpunkte auf 23,6 Prozent ein und belegte mit 135,1 Mio.
Euro den ersten Platz. Die Deutsche Bank folgte mit 20,0
Prozent und einem Marktvolumen von 114,6 Mio. Euro auf
dem zweiten Platz. Den dritten Platz aus dem Vorquartal be-
stätigte die BNP Paribas mit einem Anteil von 12,9 Prozent.
Ihr Marktvolumen betrug 74,1 Mio. Euro. Der Anteil der Citi
reduzierte sich um 0,6 Prozentpunkte auf 8,3 Prozent. Ein
Marktvolumen von 47,2 Mio. Euro bedeutete den vierten
Platz gefolgt von der Société Générale, die auf 7,8 Prozent
und ein Volumen von 44,9 Mio. Euro kam. n
5. Juni I 2016Marktanteile von strukturierten Wertpapieren
5Quelle: Deutscher Derivate Verband
Derivative Wertpapiere
Marktanteile nach Marktvolumen
Emittent 06/2016 03/2016 Differenz
n DZ BANK 10.281.695.040 16,46% 10.256.567.493 16,33% 25.127.547 0,13%
n Deutsche Bank 8.453.182.812 13,53% 9.186.795.399 14,63% -733.612.587 -1,09%
n LBBW 7.261.049.496 11,62% 7.328.829.039 11,67% -67.779.543 -0,04%
n Deka Bank 7.005.538.931 11,22% 6.388.642.604 10,17% 616.896.327 1,04%
n Helaba 6.878.039.345 11,01% 6.882.160.704 10,96% -4.121.359 0,05%
n HypoVereinsbank 5.595.011.726 8,96% 6.150.116.994 9,79% -555.105.268 -0,83%
n Commerzbank 4.535.015.166 7,26% 4.357.323.486 6,94% 177.691.680 0,32%
n BayernLB 3.155.201.177 5,05% 3.002.491.865 4,78% 152.709.312 0,27%
n Société Générale 2.053.076.438 3,29% 1.955.773.853 3,11% 97.302.585 0,17%
n BNP Paribas 1.889.456.023 3,02% 1.969.602.819 3,14% -80.146.796 -0,11%
n UBS 1.467.922.881 2,35% 1.524.044.247 2,43% -56.121.366 -0,08%
n HSBC Trinkaus 1.218.641.793 1,95% 1.295.088.563 2,06% -76.446.770 -0,11%
n Vontobel 1.089.833.260 1,74% 1.076.406.689 1,71% 13.426.571 0,03%
n Goldman Sachs 640.595.517 1,03% 533.711.044 0,85% 106.884.473 0,18%
n WGZ BANK 624.345.792 1,00% 573.446.620 0,91% 50.899.172 0,09%
n Citi 316.928.510 0,51% 333.070.609 0,53% -16.142.099 -0,02%
Anlageprodukte
Marktanteile nach Marktvolumen
Emittent 06/2016 03/2016 Differenz
n DZ BANK 10.198.745.902 16,72% 10.161.516.353 16,57% 37.229.549 0,15%
n Deutsche Bank 8.135.498.816 13,34% 8.869.138.142 14,46% -733.639.325 -1,13%
n LBBW 7.261.049.496 11,90% 7.328.829.039 11,95% -67.779.543 -0,05%
n Deka Bank 7.005.538.931 11,48% 6.388.642.604 10,42% 616.896.327 1,07%
n Helaba 6.878.039.345 11,27% 6.882.160.704 11,22% -4.121.359 0,05%
n HypoVereinsbank 5.556.897.426 9,11% 6.107.189.360 9,96% -550.291.934 -0,85%
n Commerzbank 4.104.361.401 6,73% 3.886.494.652 6,34% 217.866.750 0,39%
n BayernLB 3.155.201.177 5,17% 3.002.491.865 4,90% 152.709.312 0,28%
n Société Générale 1.963.630.703 3,22% 1.880.682.924 3,07% 82.947.779 0,15%
n BNP Paribas 1.768.729.047 2,90% 1.853.766.758 3,02% -85.037.711 -0,12%
n UBS 1.418.336.848 2,32% 1.467.365.724 2,39% -49.028.876 -0,07%
n HSBC Trinkaus 1.140.354.243 1,87% 1.196.156.218 1,95% -55.801.975 -0,08%
n Vontobel 997.871.765 1,64% 997.189.536 1,63% 682.229 0,01%
n WGZ BANK 624.345.792 1,02% 573.446.620 0,94% 50.899.172 0,09%
n Goldman Sachs 570.470.291 0,94% 484.976.996 0,79% 85.493.295 0,14%
n Citi 226.778.816 0,37% 241.505.580 0,39% -14.726.765 -0,02%
Hebelprodukte
Marktanteile nach Marktvolumen
Emittent 06/2016 03/2016 Differenz
n Commerzbank 430.653.765 29,50% 470.828.834 31,55% -40.175.069 -2,04%
n Deutsche Bank 317.683.996 21,76% 317.657.258 21,28% 26.738 0,48%
n BNP Paribas 120.726.976 8,27% 115.836.061 7,76% 4.890.914 0,51%
n Vontobel 91.961.495 6,30% 79.217.153 5,31% 12.744.342 0,99%
n Citi 90.149.694 6,18% 91.565.028 6,13% -1.415.334 0,04%
n Société Générale 89.445.735 6,13% 75.090.929 5,03% 14.354.806 1,10%
n DZ BANK 82.949.138 5,68% 95.051.140 6,37% -12.102.002 -0,69%
n HSBC Trinkaus 78.287.550 5,36% 98.932.345 6,63% -20.644.795 -1,27%
n Goldman Sachs 70.125.226 4,80% 48.734.048 3,27% 21.391.178 1,54%
n UBS 49.586.032 3,40% 56.678.523 3,80% -7.092.491 -0,40%
n HypoVereinsbank 38.114.301 2,61% 42.927.634 2,88% -4.813.333 -0,27%
n DZ BANK 16,46%
n Deutsche Bank 13,53%
n LBBW 11,62%
n Deka Bank 11,22%
n Helaba 11,01%
n HypoVereinsbank 8,96%
n Commerzbank 7,26%
n BayernLB 5,05%
n Société Générale 3,29%
n BNP Paribas 3,02%
n UBS 2,35%
n HSBC Trinkaus 1,95%
n Vontobel 1,74%
n Goldman Sachs 1,03%
n WGZ BANK 1,00%
n Citi 0,51%
6. Juni I 2016Marktanteile von strukturierten Wertpapieren
6Quelle: Deutscher Derivate Verband
Kapitalschutz-Zertifikate
Marktanteile nach Marktvolumen
Emittent 06/2016 03/2016 Differenz
n DZ BANK 4.353.083.059 53,18% 4.588.177.820 51,57% -235.094.761 1,60%
n HypoVereinsbank 1.081.115.616 13,21% 1.073.740.108 12,07% 7.375.508 1,14%
n Deutsche Bank 572.949.480 7,00% 533.238.417 5,99% 39.711.064 1,00%
n LBBW 539.477.967 6,59% 663.768.976 7,46% -124.291.009 -0,87%
n Deka Bank 447.168.926 5,46% 475.353.762 5,34% -28.184.836 0,12%
n Helaba 438.859.541 5,36% 626.690.673 7,04% -187.831.131 -1,68%
n Commerzbank 244.413.738 2,99% 299.742.825 3,37% -55.329.087 -0,38%
n Société Générale 211.883.751 2,59% 270.991.023 3,05% -59.107.272 -0,46%
n BayernLB 160.191.473 1,96% 168.527.642 1,89% -8.336.169 0,06%
n BNP Paribas 72.031.268 0,88% 119.807.284 1,35% -47.776.016 -0,47%
n Goldman Sachs 52.552.613 0,64% 43.681.639 0,49% 8.870.974 0,15%
n UBS 9.780.249 0,12% 27.439.808 0,31% -17.659.559 -0,19%
n WGZ BANK 2.648.054 0,03% 3.635.639 0,04% -987.585 -0,01%
n HSBC Trinkaus 152.362 0,00% 624.725 0,01% -472.364 -0,01%
Strukturierte Anleihen
Marktanteile nach Marktvolumen
Emittent 06/2016 03/2016 Differenz
n Helaba 5.607.337.624 31,33% 5.438.644.247 28,87% 168.693.377 2,46%
n Deutsche Bank 2.810.868.499 15,70% 3.411.362.026 18,11% -600.493.527 -2,40%
n BayernLB 2.275.667.983 12,71% 2.133.271.868 11,32% 142.396.115 1,39%
n HypoVereinsbank 2.142.940.213 11,97% 2.724.015.972 14,46% -581.075.759 -2,49%
n Deka Bank 1.833.414.072 10,24% 1.672.362.046 8,88% 161.052.027 1,37%
n Commerzbank 1.170.144.562 6,54% 1.124.832.071 5,97% 45.312.491 0,57%
n LBBW 837.668.871 4,68% 1.001.476.532 5,32% -163.807.662 -0,64%
n DZ BANK 532.441.997 2,97% 610.961.647 3,24% -78.519.650 -0,27%
n BNP Paribas 348.585.245 1,95% 353.316.253 1,88% -4.731.009 0,07%
n Société Générale 321.008.692 1,79% 350.694.121 1,86% -29.685.429 -0,07%
n WGZ BANK 14.454.000 0,08% 14.454.000 0,08% 0 0,00%
n Goldman Sachs 5.393.246 0,03% 5.631.746 0,03% -238.499 0,00%
n UBS 202.067 0,00% 252.979 0,00% -50.912 0,00%
Bonitätsanleihen
Marktanteile nach Marktvolumen
Emittent 06/2016 03/2016 Differenz
n LBBW 2.880.660.271 45,40% 2.859.005.026 46,27% 21.655.245 -0,87%
n Deka Bank 2.054.272.696 32,38% 1.891.394.827 30,61% 162.877.869 1,76%
n HypoVereinsbank 622.824.579 9,82% 640.800.055 10,37% -17.975.476 -0,56%
n DZ BANK 439.082.958 6,92% 413.479.132 6,69% 25.603.826 0,23%
n BNP Paribas 176.066.131 2,77% 174.861.962 2,83% 1.204.170 -0,06%
n Société Générale 83.409.502 1,31% 101.242.913 1,64% -17.833.411 -0,32%
n Commerzbank 38.639.255 0,61% 50.318.399 0,81% -11.679.144 -0,21%
n Helaba 30.674.112 0,48% 26.212.764 0,42% 4.461.348 0,06%
n Vontobel 19.315.537 0,30% 20.992.999 0,34% -1.677.462 -0,04%
Aktienanleihen
Marktanteile nach Marktvolumen
Emittent 06/2016 03/2016 Differenz
n Deka Bank 1.451.980.803 17,70% 1.286.733.902 15,83% 165.246.901 1,87%
n LBBW 1.307.277.036 15,94% 1.260.078.787 15,51% 47.198.250 0,43%
n HypoVereinsbank 1.114.773.905 13,59% 1.084.491.929 13,34% 30.281.976 0,25%
n DZ BANK 1.004.560.761 12,25% 1.031.862.612 12,70% -27.301.852 -0,45%
n BayernLB 531.121.844 6,48% 509.022.512 6,26% 22.099.332 0,21%
n Vontobel 482.995.879 5,89% 571.962.396 7,04% -88.966.517 -1,15%
n Commerzbank 475.759.027 5,80% 485.827.703 5,98% -10.068.676 -0,18%
n Helaba 457.290.472 5,58% 456.648.326 5,62% 642.146 -0,04%
n Deutsche Bank 441.560.924 5,38% 484.984.606 5,97% -43.423.681 -0,58%
n UBS 392.353.957 4,78% 371.282.891 4,57% 21.071.066 0,21%
n HSBC Trinkaus 206.798.848 2,52% 218.762.824 2,69% -11.963.975 -0,17%
n BNP Paribas 176.546.018 2,15% 177.928.830 2,19% -1.382.812 -0,04%
n Goldman Sachs 81.498.212 0,99% 88.285.894 1,09% -6.787.682 -0,09%
n Société Générale 45.032.810 0,55% 55.588.379 0,68% -10.555.569 -0,13%
n WGZ BANK 32.596.979 0,40% 43.394.790 0,53% -10.797.811 -0,14%
7. Juni I 2016Marktanteile von strukturierten Wertpapieren
7Quelle: Deutscher Derivate Verband
Discount-Zertifikate
Marktanteile nach Marktvolumen
Emittent 06/2016 03/2016 Differenz
n DZ BANK 1.191.451.249 21,84% 1.159.170.951 22,51% 32.280.298 -0,68%
n Commerzbank 988.754.747 18,12% 719.388.426 13,97% 269.366.321 4,15%
n Deutsche Bank 828.010.831 15,18% 879.312.282 17,08% -51.301.451 -1,90%
n HSBC Trinkaus 623.939.765 11,44% 653.726.051 12,70% -29.786.286 -1,26%
n Société Générale 498.299.507 9,13% 434.411.643 8,44% 63.887.865 0,70%
n BNP Paribas 347.184.031 6,36% 344.951.316 6,70% 2.232.714 -0,34%
n Vontobel 294.968.441 5,41% 274.550.288 5,33% 20.418.153 0,07%
n UBS 192.319.783 3,52% 244.688.692 4,75% -52.368.909 -1,23%
n Goldman Sachs 132.330.462 2,43% 87.832.085 1,71% 44.498.377 0,72%
n Citi 106.681.532 1,96% 104.766.003 2,03% 1.915.530 -0,08%
n LBBW 106.661.169 1,95% 108.446.972 2,11% -1.785.804 -0,15%
n WGZ BANK 73.514.038 1,35% 61.646.973 1,20% 11.867.065 0,15%
n HypoVereinsbank 66.391.463 1,22% 69.488.893 1,35% -3.097.430 -0,13%
n Deka Bank 5.526.603 0,10% 6.637.593 0,13% -1.110.991 -0,03%
Bonus-Zertifikate
Marktanteile nach Marktvolumen
Emittent 06/2016 03/2016 Differenz
n DZ BANK 427.026.081 17,87% 390.846.917 17,35% 36.179.164 0,52%
n Deutsche Bank 404.731.871 16,94% 440.138.028 19,54% -35.406.157 -2,60%
n Commerzbank 309.053.742 12,93% 321.522.228 14,27% -12.468.486 -1,34%
n BNP Paribas 235.164.082 9,84% 259.181.230 11,50% -24.017.147 -1,66%
n Société Générale 221.775.711 9,28% 148.376.606 6,59% 73.399.105 2,69%
n Vontobel 134.898.521 5,65% 58.866.846 2,61% 76.031.675 3,03%
n HSBC Trinkaus 132.939.078 5,56% 150.237.561 6,67% -17.298.483 -1,11%
n UBS 118.824.338 4,97% 107.236.699 4,76% 11.587.639 0,21%
n Goldman Sachs 116.321.189 4,87% 71.875.915 3,19% 44.445.273 1,68%
n Citi 103.775.728 4,34% 117.381.590 5,21% -13.605.861 -0,87%
n LBBW 88.911.896 3,72% 88.694.692 3,94% 217.205 -0,22%
n HypoVereinsbank 59.221.353 2,48% 60.340.140 2,68% -1.118.787 -0,20%
n Deka Bank 14.401.021 0,60% 14.566.311 0,65% -165.290 -0,04%
n Helaba 13.989.981 0,59% 14.661.812 0,65% -671.832 -0,07%
n BayernLB 8.333.085 0,35% 8.441.840 0,37% -108.755 -0,03%
n WGZ BANK 205.453 0,01% 477.031 0,02% -271.578 -0,01%
Express-Zertifikate
Marktanteile nach Marktvolumen
Emittent 06/2016 03/2016 Differenz
n DZ BANK 1.511.048.340 20,17% 1.203.070.810 17,94% 307.977.530 2,23%
n Deutsche Bank 1.504.558.880 20,08% 1.484.970.225 22,14% 19.588.654 -2,06%
n LBBW 1.306.649.296 17,44% 1.145.506.658 17,08% 161.142.638 0,36%
n Deka Bank 1.119.285.152 14,94% 970.993.217 14,48% 148.291.935 0,46%
n WGZ BANK 499.665.935 6,67% 448.563.119 6,69% 51.102.816 -0,02%
n Société Générale 415.190.506 5,54% 354.722.988 5,29% 60.467.518 0,25%
n HypoVereinsbank 223.980.845 2,99% 217.520.495 3,24% 6.460.350 -0,25%
n Helaba 214.192.978 2,86% 194.380.386 2,90% 19.812.592 -0,04%
n UBS 196.859.421 2,63% 183.182.707 2,73% 13.676.714 -0,10%
n BayernLB 170.465.097 2,28% 171.678.422 2,56% -1.213.325 -0,28%
n Commerzbank 142.897.535 1,91% 147.873.844 2,20% -4.976.309 -0,30%
n Goldman Sachs 98.128.282 1,31% 103.532.563 1,54% -5.404.281 -0,23%
n BNP Paribas 33.764.539 0,45% 36.674.614 0,55% -2.910.076 -0,10%
n HSBC Trinkaus 29.592.952 0,39% 22.680.955 0,34% 6.911.997 0,06%
n Vontobel 26.205.577 0,35% 22.297.859 0,33% 3.907.718 0,02%
Index- und Partizipations-Zertifikate
Marktanteile nach Marktvolumen
Emittent 06/2016 03/2016 Differenz
n Deutsche Bank 1.324.383.218 34,13% 1.384.358.955 34,67% -59.975.737 -0,55%
n Commerzbank 697.276.293 17,97% 687.761.005 17,23% 9.515.287 0,74%
n UBS 492.940.655 12,70% 515.245.944 12,91% -22.305.289 -0,20%
n BNP Paribas 372.039.382 9,59% 379.567.545 9,51% -7.528.163 0,08%
n DZ BANK 266.460.359 6,87% 309.616.629 7,76% -43.156.270 -0,89%
n HypoVereinsbank 210.353.825 5,42% 194.503.586 4,87% 15.850.239 0,55%
n HSBC Trinkaus 133.792.693 3,45% 137.862.221 3,45% -4.069.528 -0,01%
n Société Générale 131.355.893 3,38% 129.966.050 3,26% 1.389.843 0,13%
n Helaba 107.268.856 2,76% 111.739.432 2,80% -4.470.576 -0,03%
n Goldman Sachs 64.168.825 1,65% 60.598.592 1,52% 3.570.233 0,14%
n LBBW 37.543.466 0,97% 31.489.240 0,79% 6.054.225 0,18%
n Vontobel 26.547.711 0,68% 32.140.920 0,81% -5.593.209 -0,12%
n Citi 11.790.229 0,30% 12.345.414 0,31% -555.185 -0,01%
n BayernLB 4.989.530 0,13% 5.216.444 0,13% -226.914 0,00%
8. Juni I 2016Marktanteile von strukturierten Wertpapieren
8Quelle: Deutscher Derivate Verband
Outperformance- / Sprint-Zertifikate
Marktanteile nach Marktvolumen
Emittent 06/2016 03/2016 Differenz
n Commerzbank 19.228.871 25,07% 19.697.826 20,28% -468.955 4,79%
n Vontobel 12.940.099 16,87% 15.664.202 16,12% -2.724.103 0,74%
n DZ BANK 10.720.892 13,98% 22.494.446 23,16% -11.773.554 -9,18%
n Deutsche Bank 9.668.929 12,60% 11.221.012 11,55% -1.552.082 1,05%
n HSBC Trinkaus 9.001.278 11,73% 7.930.055 8,16% 1.071.223 3,57%
n UBS 5.043.197 6,57% 5.461.167 5,62% -417.970 0,95%
n Citi 4.531.326 5,91% 7.012.574 7,22% -2.481.249 -1,31%
n Société Générale 2.330.565 3,04% 2.401.548 2,47% -70.984 0,57%
n BayernLB 1.397.593 1,82% 1.319.901 1,36% 77.692 0,46%
n HypoVereinsbank 1.057.789 1,38% 1.382.301 1,42% -324.512 -0,04%
n Goldman Sachs 791.016 1,03% 825.617 0,85% -34.601 0,18%
Weitere Anlageprodukte ohne Kapitalschutz
Marktanteile nach Marktvolumen
Emittent 06/2016 03/2016 Differenz
n DZ BANK 462.870.206 42,99% 431.835.388 39,99% 31.034.818 3,01%
n Deutsche Bank 238.766.183 22,18% 239.552.591 22,18% -786.407 -0,01%
n LBBW 156.199.525 14,51% 168.630.574 15,62% -12.431.049 -1,11%
n Deka Bank 79.489.658 7,38% 70.600.947 6,54% 8.888.712 0,85%
n HypoVereinsbank 34.237.839 3,18% 40.905.882 3,79% -6.668.044 -0,61%
n Société Générale 33.343.765 3,10% 32.287.653 2,99% 1.056.112 0,11%
n Goldman Sachs 19.286.447 1,79% 22.712.945 2,10% -3.426.498 -0,31%
n Commerzbank 18.193.633 1,69% 29.530.327 2,73% -11.336.694 -1,04%
n UBS 10.013.181 0,93% 12.574.837 1,16% -2.561.656 -0,23%
n Helaba 8.425.781 0,78% 13.183.064 1,22% -4.757.283 -0,44%
n BNP Paribas 7.348.351 0,68% 7.475.403 0,69% -127.052 -0,01%
n HSBC Trinkaus 4.137.267 0,38% 4.331.827 0,40% -194.560 -0,02%
n BayernLB 3.034.572 0,28% 5.013.236 0,46% -1.978.664 -0,18%
n WGZ BANK 1.261.334 0,12% 1.275.069 0,12% -13.734 0,00%
9. Juni I 2016Marktanteile von strukturierten Wertpapieren
9Quelle: Deutscher Derivate Verband
Optionsscheine
Marktanteile nach Marktvolumen
Emittent 06/2016 03/2016 Differenz
n Deutsche Bank 125.616.850 22,49% 131.455.852 21,62% -5.839.002 0,87%
n Commerzbank 107.506.490 19,25% 131.867.425 21,69% -24.360.935 -2,44%
n Goldman Sachs 59.574.509 10,67% 40.660.307 6,69% 18.914.202 3,98%
n BNP Paribas 46.667.961 8,36% 43.235.799 7,11% 3.432.162 1,24%
n Société Générale 43.565.675 7,80% 40.498.046 6,66% 3.067.629 1,14%
n Citi 42.941.060 7,69% 43.880.814 7,22% -939.754 0,47%
n HSBC Trinkaus 41.519.054 7,43% 58.990.177 9,70% -17.471.123 -2,27%
n DZ BANK 39.490.907 7,07% 51.450.578 8,46% -11.959.671 -1,39%
n UBS 23.911.360 4,28% 29.526.915 4,86% -5.615.555 -0,58%
n HypoVereinsbank 15.236.102 2,73% 22.351.124 3,68% -7.115.023 -0,95%
n Vontobel 12.461.459 2,23% 13.976.434 2,30% -1.514.975 -0,07%
Faktor-Zertifikate
Marktanteile nach Marktvolumen
Emittent 06/2016 03/2016 Differenz
n Commerzbank 188.075.587 57,18% 208.420.116 60,74% -20.344.529 -3,56%
n Deutsche Bank 77.468.461 23,55% 80.330.625 23,41% -2.862.164 0,14%
n Vontobel 48.099.449 14,62% 38.665.562 11,27% 9.433.888 3,36%
n HSBC Trinkaus 6.642.247 2,02% 7.600.392 2,21% -958.146 -0,20%
n DZ BANK 4.200.963 1,28% 4.266.317 1,24% -65.354 0,03%
n HypoVereinsbank 3.418.372 1,04% 2.463.326 0,72% 955.045 0,32%
n Société Générale 1.005.685 0,31% 1.390.406 0,41% -384.721 -0,10%
Knock-Out Produkte
Marktanteile nach Marktvolumen
Emittent 06/2016 03/2016 Differenz
n Commerzbank 135.071.688 23,60% 130.541.293 24,11% 4.530.395 -0,51%
n Deutsche Bank 114.598.684 20,02% 105.870.780 19,55% 8.727.904 0,47%
n BNP Paribas 74.059.015 12,94% 72.600.263 13,41% 1.458.752 -0,47%
n Citi 47.208.634 8,25% 47.684.214 8,81% -475.580 -0,56%
n Société Générale 44.874.374 7,84% 33.202.476 6,13% 11.671.898 1,71%
n DZ BANK 39.257.267 6,86% 39.334.245 7,26% -76.978 -0,40%
n Vontobel 31.400.586 5,49% 26.575.157 4,91% 4.825.430 0,58%
n HSBC Trinkaus 30.126.249 5,26% 32.341.775 5,97% -2.215.526 -0,71%
n UBS 25.674.672 4,49% 27.151.607 5,01% -1.476.935 -0,53%
n HypoVereinsbank 19.459.827 3,40% 18.113.183 3,35% 1.346.644 0,06%
n Goldman Sachs 10.550.717 1,84% 8.073.741 1,49% 2.476.976 0,35%