Als PDF, PPTX herunterladen

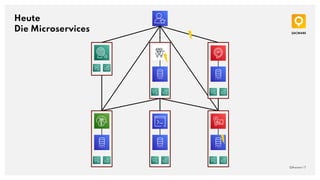
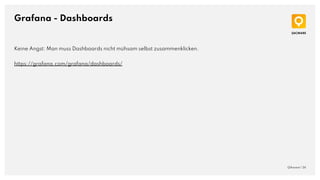
![Was ist eigentlich Observability?
Wie gut weiß ich über den internen Zustand meines Systems Bescheid, wenn
ich mir seine Ausgaben ansehe? (vgl. [Kal])
Was hat so ein modernes System als Ausgabe?
■ Eine Webseite?
■ Eine REST-API?
■ E-Mails an den Admin?
■ Ein spärlich gepflegtes Logfile?
Was ist, wenn das System aus vielen Microservices besteht?
QAware | 3](https://image.slidesharecdn.com/qaware-franz-wimmercloud-observability-220720104318-e0845d19/85/Cloud-Observability-mit-Loki-Prometheus-Tempo-und-Grafana-3-320.jpg)

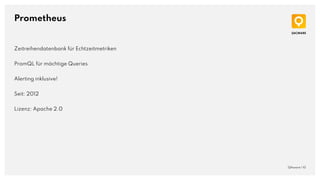
![[ ]
Der (Open-Source-)Stack
QAware | 8](https://image.slidesharecdn.com/qaware-franz-wimmercloud-observability-220720104318-e0845d19/85/Cloud-Observability-mit-Loki-Prometheus-Tempo-und-Grafana-8-320.jpg)

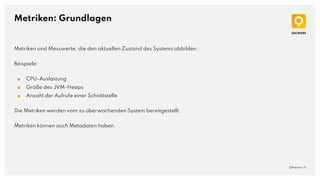

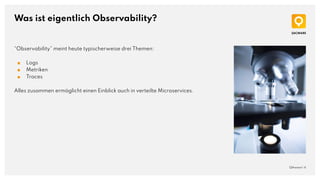
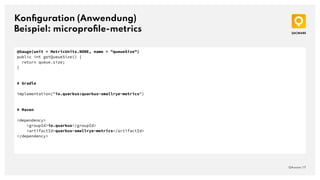
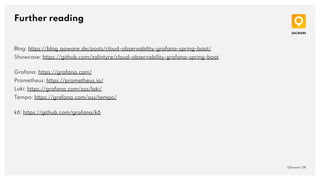
![PromQL
QAware | 14
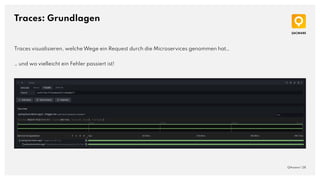
PromQL ist eine mächtige Query Language, um die gewünschten Metriken zu filtern / aggregieren.
Die ganze Zeitreihe:
http_requests_total
Filter nach Labels:
http_requests_total{job="apiserver", handler="/api/comments"}
Rate berechnen:
rate(http_requests_total[5m])[30m:1m]](https://image.slidesharecdn.com/qaware-franz-wimmercloud-observability-220720104318-e0845d19/85/Cloud-Observability-mit-Loki-Prometheus-Tempo-und-Grafana-14-320.jpg)
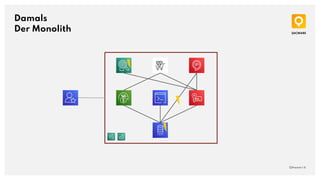
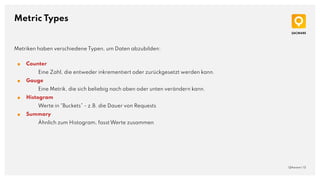
![Konfiguration (Prometheus)
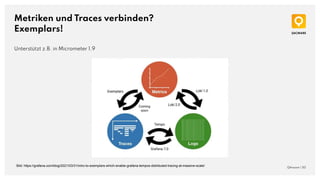
Die Metriken einsammeln
QAware | 18
global:
scrape_interval: 15s # Set the scrape interval to every 15 seconds. Default is every 1 minute.
evaluation_interval: 15s # Evaluate rules every 15 seconds. The default is every 1 minute.
scrape_configs:
# The job name is added as a label `job=<job_name>` to any timeseries scraped from this config.
- job_name: "prometheus"
static_configs:
- targets: ["localhost:9090"]
- job_name: "Saturn node exporter"
scheme: https
static_configs:
- targets: ["saturn.qaware.de"]
basic_auth:
username: "*******************"
password: "*******************"](https://image.slidesharecdn.com/qaware-franz-wimmercloud-observability-220720104318-e0845d19/85/Cloud-Observability-mit-Loki-Prometheus-Tempo-und-Grafana-18-320.jpg)

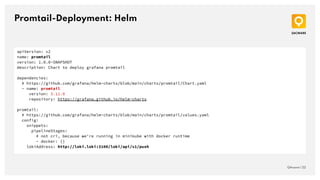
![Promtail-Deployment: Classic
QAware | 23
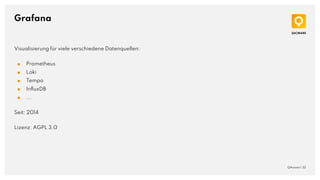
clients:
- url: "https://loki.qaware.de/loki/api/v1/push"
basic_auth:
username: loki
password: ****************
scrape_configs:
- job_name: journal
journal:
json: true
max_age: 12h
labels:
host: saturn
job: systemd-journal
relabel_configs:
- source_labels: ['__journal__systemd_unit']
target_label: 'unit'
Vorsicht: Labels nicht zu dynamisch verteilen!
https://grafana.com/blog/2020/04/21/how-labels-in-loki-can-make-log-queries-faster-and-easier/](https://image.slidesharecdn.com/qaware-franz-wimmercloud-observability-220720104318-e0845d19/85/Cloud-Observability-mit-Loki-Prometheus-Tempo-und-Grafana-23-320.jpg)
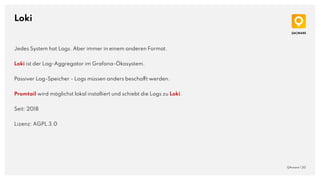
![LogQL
QAware | 24
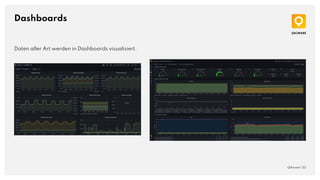
Auch Loki hat eine eigene Query Language.
count_over_time({foo="bar"}[1m]) > 10
{host="$host", job="systemd-journal"}
| json
| line_format "{{ .unit }}: {{ .MESSAGE }}"
|= "$search"](https://image.slidesharecdn.com/qaware-franz-wimmercloud-observability-220720104318-e0845d19/85/Cloud-Observability-mit-Loki-Prometheus-Tempo-und-Grafana-24-320.jpg)


![Quellen
QAware | 39
[Kal] R.E. Kalman,
On the general theory of control systems,
IFAC Proceedings Volumes,
Volume 1, Issue 1,
1960,
Pages 491-502,
ISSN 1474-6670,
https://doi.org/10.1016/S1474-6670(17)70094-8.
(https://www.sciencedirect.com/science/article/pii/S1474667017700948)](https://image.slidesharecdn.com/qaware-franz-wimmercloud-observability-220720104318-e0845d19/85/Cloud-Observability-mit-Loki-Prometheus-Tempo-und-Grafana-39-320.jpg)


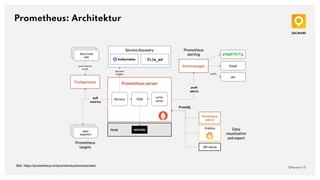
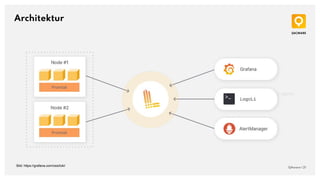
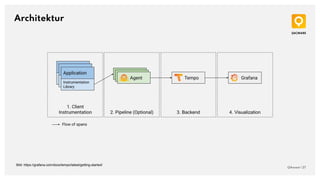
Das Dokument behandelt das Thema Cloud-Observability mit Technologien wie Loki, Prometheus, Tempo und Grafana, um Einblicke in verteilte Microservices zu erhalten. Es beschreibt die Bedeutung von Logs, Metriken und Traces für das Verständnis des Systemstatus und erläutert die Implementierung dieser Technologien in einer modernen Cloud-Umgebung. Weiterhin werden spezifische technische Details, wie die Konfiguration und Nutzung von Prometheus und Loki zur Überwachung und Analyse von Systemleistungen, vorgestellt.


![[AWSマイスターシリーズ] Amazon ElastiCache](https://cdn.slidesharecdn.com/ss_thumbnails/20131030aws-meister-regenerate-elasticache-131101003447-phpapp02-thumbnail.jpg?width=640&height=640&fit=bounds)