Analyzing the Bührer family data set using an advanced mosaic plot
1.
Analyzing the Bührerfamily
data set using an advanced
mosaic plot
Thomas Roth (IT architect, natural scientist and
hobbyist data cruncher & visualiser)
Zurich R User meetup, August 3rd 2016
2.
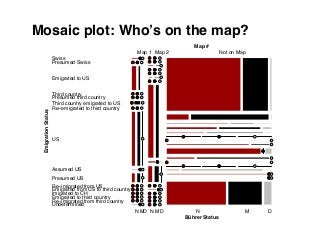
Mosaic plot: Who’son the map?
Map #
Bührer Status
EmigrationStatus
Map 1
Undetermined
N MD
Re−imigrated from third country
Emigrated to third country
Imigrated to CH
Emigrated from US to third country
Re−imigrated from US
Presumed US
Assumed US
US
Re−emigrated to third country
Third country emigrated to US
Presumed third country
Third country
Emigrated to US
Presumed Swiss
Swiss
Map 2
N M D
Not on Map
N M D
3.
Mosaic plot code(vcd package)
library(vcd)
# Read data (source: SQL group by statement including all factors and count) and create contingency table
data <- read.csv(”[..] Data.csv")
art <- xtabs(count ~ map + emigrationstatus + buehrerstatus, data = data)
# Reorder factors and define color convention (visual tweaking)
art <- art[ c("Map 1", "Map 2", "No Map"), c("Swiss”, [..]), c("Named","Married","Descendant")]
color = c("#990000", "black", "grey”)
# Create mosaic plot
mosaic(art, direction = c("v", "h", "v"),
zero_size = 0.5, zero_split = TRUE,
margins = c(left = 12, right = 2, top = 2, bottom = 2),
shade = TRUE, gp = gpar(fill = color, col = 0),
abbreviate = c(buehrerstatus = 1),
labeling_args = list(set_varnames =
c(map = "Map #", emigrationstatus = "Emigration Status", buehrerstatus = "Bührer Status"),
set_labels = list(map = c("Map 1", "Map 2", "Not on Map")),
rot_labels = c(left = 0, bottom = 0, right = 0),
offset_varnames = c(left = 12, right = 1), offset_labels = c(left = 12, right = 0),
pos_labels = "center", just_labels = "left", rep = TRUE),
legend = FALSE )
4.
More information
Visit theproject’s microblog for more information on the
data, methodology, tools and visualisations used for
Mapping the emigration of the Bührers from Switzerland
to the United States
https://familytreemeetsgis.nogi.ch

![Mosaic plot code (vcd package)
library(vcd)
# Read data (source: SQL group by statement including all factors and count) and create contingency table
data <- read.csv(”[..] Data.csv")
art <- xtabs(count ~ map + emigrationstatus + buehrerstatus, data = data)
# Reorder factors and define color convention (visual tweaking)
art <- art[ c("Map 1", "Map 2", "No Map"), c("Swiss”, [..]), c("Named","Married","Descendant")]
color = c("#990000", "black", "grey”)
# Create mosaic plot
mosaic(art, direction = c("v", "h", "v"),
zero_size = 0.5, zero_split = TRUE,
margins = c(left = 12, right = 2, top = 2, bottom = 2),
shade = TRUE, gp = gpar(fill = color, col = 0),
abbreviate = c(buehrerstatus = 1),
labeling_args = list(set_varnames =
c(map = "Map #", emigrationstatus = "Emigration Status", buehrerstatus = "Bührer Status"),
set_labels = list(map = c("Map 1", "Map 2", "Not on Map")),
rot_labels = c(left = 0, bottom = 0, right = 0),
offset_varnames = c(left = 12, right = 1), offset_labels = c(left = 12, right = 0),
pos_labels = "center", just_labels = "left", rep = TRUE),
legend = FALSE )](https://image.slidesharecdn.com/rusermeetupmosaicplotthomasroth20160803-160807160156/85/Analyzing-the-Buhrer-family-data-set-using-an-advanced-mosaic-plot-3-320.jpg?cb=1470682250)


![제 23회 보아즈(BOAZ) 빅데이터 컨퍼런스 - [MBOAX] : ABSA를 활용한 소비자 반응 분석 기반 운영 효율화 대시보드 설계](https://cdn.slidesharecdn.com/ss_thumbnails/3-1boaz23rdconferencemboax-260203102709-9d519923-thumbnail.jpg?width=640&height=640&fit=bounds)


