Chicago Crime Data with HIVE and PIG (40
•
1 gefällt mir•846 views

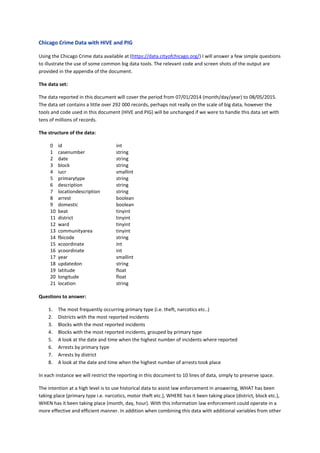
Using the Chicago Crime data available at (https://data.cityofchicago.org/) I will answer a few simple questions to illustrate the use of some common big data tools. The relevant code and screen shots of the output are provided in the appendix of the document.

Empfohlen
Weitere ähnliche Inhalte
Was ist angesagt?
Was ist angesagt? (20)
Ähnlich wie Chicago Crime Data with HIVE and PIG (40
Ähnlich wie Chicago Crime Data with HIVE and PIG (40 (20)
Mehr von Gregg Barrett
Mehr von Gregg Barrett (20)
Kürzlich hochgeladen
Kürzlich hochgeladen (20)
Chicago Crime Data with HIVE and PIG (40
- 1. Chicago Crime Data with HIVE and PIG Using the Chicago Crime data available at (https://data.cityofchicago.org/) I will answer a few simple questions to illustrate the use of some common big data tools. The relevant code and screen shots of the output are provided in the appendix of the document. The data set: The data reported in this document will cover the period from 07/01/2014 (month/day/year) to 08/05/2015. The data set contains a little over 292 000 records, perhaps not really on the scale of big data, however the tools and code used in this document (HIVE and PIG) will be unchanged if we were to handle this data set with tens of millions of records. The structure of the data: 0 id int 1 casenumber string 2 date string 3 block string 4 iucr smallint 5 primarytype string 6 description string 7 locationdescription string 8 arrest boolean 9 domestic boolean 10 beat tinyint 11 district tinyint 12 ward tinyint 13 communityarea tinyint 14 fbicode string 15 xcoordinate int 16 ycoordinate int 17 year smallint 18 updatedon string 19 latitude float 20 longitude float 21 location string Questions to answer: 1. The most frequently occurring primary type (i.e. theft, narcotics etc..) 2. Districts with the most reported incidents 3. Blocks with the most reported incidents 4. Blocks with the most reported incidents, grouped by primary type 5. A look at the date and time when the highest number of incidents where reported 6. Arrests by primary type 7. Arrests by district 8. A look at the date and time when the highest number of arrests took place In each instance we will restrict the reporting in this document to 10 lines of data, simply to preserve space. The intention at a high level is to use historical data to assist law enforcement in answering, WHAT has been taking place (primary type i.e. narcotics, motor theft etc.), WHERE has it been taking place (district, block etc.), WHEN has it been taking place (month, day, hour). With this information law enforcement could operate in a more effective and efficient manner. In addition when combining this data with additional variables from other
- 2. data sets/sources, law enforcement could possibly develop predictive models, further improving the effectiveness and efficiency of its operations. 1. The most frequently occurring primary type: Primary type Count 0 THEFT 62845 1 BATTERY 53065 2 CRIMINAL DAMAGE 30345 3 NARCOTICS 26025 4 ASSAULT 18439 5 OTHER OFFENSE 18260 6 DECEPTIVE PRACTICE 14919 7 BURGLARY 14449 8 MOTOR VEHICLE THEFT 10712 9 ROBBERY 10231 It would appear that theft and battery are the two most common “primary types” that Chicago law enforcement have to deal with. However, caution should be exercised, as any astute data analyst knows, details on how the data was generated should be gathered. In terms of the data in question there have been reports that this data has been subject to some level of manipulation. Specifically: “Chicago found dozens of other crimes, including serious felonies such as robberies, burglaries, and assaults, that were misclassified, downgraded to wrist-slap offenses, or made to vanish altogether.” (Chicago Magazine, 2014) 2. Districts with the most reported incidents District Count 0 11 20055 1 8 18008 2 4 16823 3 6 16630 4 7 15952 5 25 15807 6 3 13753 7 9 13292 8 15 12732 9 12 12381 Reporting on incidents by district is perhaps more relevant to those in law enforcement, where the location and extent of what constitutes each district is better known. Reporting on incidents by district could assist law enforcement in allocating resources per district – to balance workload. It should be noted that districts and the number of incidents reported in each are not strictly comparable without adjusting for the number of persons resident in each, as one would expect higher rates of reported crime in districts with more persons resident therein. 3. Blocks with the most reported incidents Block Count 0 001XX N State St 809 1 0000X W Terminal St 586 2 008XX N Michigan Ave 439 3 076XX S Cicero Ave 430 4 083XX S Stewart Ave 320 5 051XX W Madison St 319 6 0000X N State St 313
- 3. 7 064XX S DR Martin Luther King JR Dr 234 8 006XX N Michigan Ave 222 9 011XX S Canal St 217 Reporting on the number of incidents at a block level is perhaps more meaningful to the average person on the street, where there is more familiarity with the extent and location of a block as opposed to a district. As with the report on reported incidents by district this data could be used to assist law enforcement in allocating resources down to a block level – to balance workload and ensure more effective policing. It should be noted that as with districts, blocks and the number of incidents reported in each are not strictly comparable without adjusting for the number of persons resident in each, as one would expect higher rates of reported crime in blocks with more persons resident therein. In addition this data could be used as input to route mapping software, by identifying areas with higher incidents of crime and helping would be travellers to plan routes that avoid such areas. In this instance is appears that 001XX N State Street, has a particularly high number of reported incidents and it would be expected that more law enforcement personnel would be allocated to this area as opposed to those with fewer reported incidents. 4. Blocks with the most reported incidents, grouped by primary type Block Primary type Count 0 001XX N State St Theft 632 1 076XX S Cicero Ave Theft 369 2 008XX N Michigan Ave Theft 331 3 0000X N State St Theft 261 4 083XX S Stewart Ave Theft 258 5 0000X W Terminal St Theft 191 6 051XX W Madison St Narcotics 175 7 0000X W Terminal St Criminal Trespass 166 8 046XX W North Ave Theft 161 9 011XX S Canal St Theft 151 By reporting on incidents at a block level and including the primary type, law enforcement can better manage resources by allocating specialised units (specialised in terms of primary type) to where they are needed most. Narcotics units for example, would possibly be best placed to conduct surveillance in the area of 051XX W Madison Street. Again it is worth noting that comparison of blocks should be done by adjusting for the number of persons resident therein (as only people commit crime). Further consideration should be given to the propensity to report by residents and law enforcement. There could well be the possibility of under reporting in certain areas because residents in those areas lack confidence in law enforcement. On the other hand there is also the possibility that law enforcement could under report incidents in certain areas in order to improve crime statistics. 5. A look at the date and time when the highest number of incidents where reported Date Count 0 01/01/2015 12:01:00 AM 63 1 10/01/2014 09:00:00 AM 56 2 08/01/2014 09:00:00 AM 45 3 01/01/2015 12:00:00 AM 41 4 12/01/2014 09:00:00 AM 41 5 05/01/2015 12:00:00 PM 39 6 05/01/2015 09:00:00 AM 38 7 09/01/2014 09:00:00 AM 38 8 08/01/2014 12:01:00 AM 36 9 01/01/2015 09:00:00 AM 36
- 4. By reporting on the date and time of incidents reported law enforcement can better manage resources ensuring that more personnel are available at those times when most of the criminal activity takes place. Based on the table above it would appear that the first day of the month between the hours of 12:00 AM and 09:00 AM are when a number of incidents take place. Why the first day of the month has such activity warrants further investigation. 6. Arrests by primary type Primary type Count 0 NARCOTICS 25570 1 BATTERY 12114 2 THEFT 7397 3 CRIMINAL TRESPASS 5141 4 OTHER OFFENSE 4901 5 ASSAULT 4327 6 WEAPONS VIOLATION 2796 7 PUBLIC PEACE VIOLATION 2207 8 CRIMINAL DAMAGE 2061 9 PROSTITUTION 1816 Arrests by primary type are potentially misleading without accounting for a number of factors. From the table we see that law enforcement has arrested more than 3.4 times the number of people for narcotics as for theft. However as per table 1, we see that the number of reported incidents for theft is more than twice the number of reported incidents for narcotics. 7. Arrests by district District Count 0 11 9292 1 15 5337 2 7 5230 3 25 5008 4 4 4814 5 6 4633 6 8 4342 7 10 3925 8 9 3650 9 5 3549 One would anticipate a correlation between the number of incidents reported by district and the number of arrests reported by district. Those districts with more criminal incidents should have more law enforcement personnel and more arrests etc. Of consideration could be an ANOVA (analysis of variance) to find those districts where reported crime is significantly different to the number of arrests made. 8. A look at the date and time when the highest number of arrests took place Date Count 0 11/30/2014 06:26:00 PM 8 1 08/07/2014 06:00:00 AM 8 2 10/03/2014 12:00:00 PM 8 3 09/03/2014 08:25:00 PM 7 4 06/18/2015 10:35:00 PM 7 5 08/19/2014 11:00:00 PM 6 6 08/06/2014 07:45:00 PM 6 7 11/02/2014 06:30:00 PM 6
- 5. 8 06/16/2015 01:00:00 PM 6 9 08/01/2014 09:00:00 PM 6 Better call Saul! Dates and times when public defendants likely had a lot of incoming calls. Seldom are there 6 or more arrests at any particular time.
- 6. Appendix 1. The most frequently occurring primary type (i.e. theft, narcotics etc..) SELECT primarytype, COUNT(*) AS cnt FROM crime GROUP BY primarytype ORDER BY cnt DESC crime = LOAD '/home/cloudera/Downloads/Crimes_-_2001_to_present.csv' crime_grp_type = GROUP crime BY primarytype; crime_grp_type_cntd = FOREACH crime_grp_type GENERATE COUNT(crime) AS cnt; srtd = ORDER crime_grp_type_cntd BY cnt; DUMP srtd; 2. Districts with the most reported incidents SELECT district, COUNT(*) AS cntdistrict FROM crime GROUP BY district ORDER BY cntdistrict DESC crime = LOAD '/home/cloudera/Downloads/Crimes_-_2001_to_present.csv' crime_grp_dist = GROUP crime BY district; crime_grp_dist_cntd = FOREACH crime_grp_dist GENERATE COUNT(crime) AS cnt; srtd = ORDER crime_grp_dist_cntd BY cnt; DUMP srtd;
- 7. 3. Blocks with the most reported incidents SELECT block, COUNT(*) AS cntblock FROM crime GROUP BY block ORDER BY cntblock DESC crime = LOAD '/home/cloudera/Downloads/Crimes_-_2001_to_present.csv' crime_grp_block = GROUP crime BY block; crime_grp_block_cntd = FOREACH crime_grp_block GENERATE COUNT(crime) AS cnt; srtd = ORDER crime_grp_block_cntd BY cnt; DUMP srtd;
- 8. 4. Blocks with the most reported incidents, grouped by primary type SELECT block, primarytype, COUNT(*) AS cntblocktype FROM crime GROUP BY block, primarytype ORDER BY cntblocktype DESC crime = LOAD '/home/cloudera/Downloads/Crimes_-_2001_to_present.csv' crime_cogrp_block_type = COGROUP crime BY (block, primarytype); crime_ cogrp_block_type _cntd = FOREACH crime_ cogrp_block_type GENERATE COUNT(crime) AS cnt; srtd = ORDER crime_ cogrp_block_type _cntd BY cnt; DUMP srtd; 5. A look at the date and time when the highest number of incidents where reported SELECT date, COUNT(*) AS cnt FROM crime GROUP BY date ORDER BY cnt DESC crime = LOAD '/home/cloudera/Downloads/Crimes_-_2001_to_present.csv' crime_grp_date = GROUP crime BY date; crime_grp_date_cntd = FOREACH crime_grp_date GENERATE COUNT(crime) AS cnt; srtd = ORDER crime_grp_date_cntd BY cnt; DUMP srtd;
- 9. 6. Arrests by primary type SELECT primarytype, COUNT(*) AS cnt FROM crime WHERE arrest = True GROUP BY primarytype ORDER BY cnt DESC crime = LOAD '/home/cloudera/Downloads/Crimes_-_2001_to_present.csv' crime_filter = FILTER crime BY ( UPPER (arrest) matches '.*TRUE.*' ); crime_grp_type = GROUP crime_filter BY primarytype; crime_grp_type_cntd = FOREACH crime_grp_type GENERATE COUNT(crime_filter) AS cnt; srtd = ORDER crime_grp_type_cntd BY cnt; DUMP srtd; 7. Arrests by district SELECT district, COUNT(*) AS cntdistrictarrest
- 10. FROM crime WHERE arrest = True GROUP BY district ORDER BY cntdistrictarrest DESC crime = LOAD '/home/cloudera/Downloads/Crimes_-_2001_to_present.csv' crime_filter = FILTER crime BY ( UPPER (arrest) matches '.*TRUE.*' ); crime_grp_dist = GROUP crime_filter BY district; crime_grp_dist_cntd = FOREACH crime_grp_dist GENERATE COUNT(crime_filter) AS cnt; srtd = ORDER crime_grp_dist_cntd BY cnt; DUMP srtd; 8. A look at the date and time when the highest number of arrests took place SELECT date, COUNT(*) AS cnt_arrest FROM crime WHERE arrest = True GROUP BY date ORDER BY cnt_arrest DESC crime = LOAD '/home/cloudera/Downloads/Crimes_-_2001_to_present.csv' crime_filter = FILTER crime BY ( UPPER (arrest) matches '.*TRUE.*' ); crime_grp_date = GROUP crime_filter BY date; crime_grp_date_cntd = FOREACH crime_grp_date GENERATE COUNT(crime_filter) AS cnt; srtd = ORDER crime_grp_date_cntd BY cnt; DUMP srtd;
- 12. Reference Chicago Magazine, (2014). The truth about chicago’s crime rates. [webpage]. Retrieved from http://www.chicagomag.com/Chicago-Magazine/May-2014/Chicago-crime-rates/