Alan Pears - slides - price on carbon forum Aug 2011
1. How will we be affected by Carbon Pricing?
What can we do?
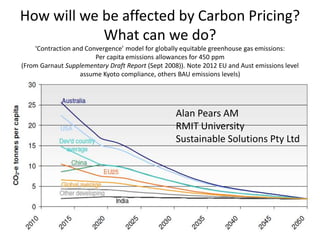
‘Contraction and Convergence’ model for globally equitable greenhouse gas emissions:
Per capita emissions allowances for 450 ppm
(From Garnaut Supplementary Draft Report (Sept 2008)). Note 2012 EU and Aust emissions level
assume Kyoto compliance, others BAU emissions levels)
Alan Pears AM
RMIT University
Sustainable Solutions Pty Ltd
2. Carbon Pricing Myths Busted
• No forms to fill out, ‘tax returns’, GST-like BAS etc:
only 500 large organisations must comply
• No need to calculate carbon footprints
• No ‘carbon police’ except for the big 500, who
have lots of similar compliance issues
• Pass-through costs we’ll see are mostly small and:
– Most people compensated
– Scope for most to take action to avoid costs
• House prices won’t rise by $6,000 – maybe $700
• Food prices won’t skyrocket due to C price
3. AEMC estimates of residential electricity price increases to 2013 and
contributions to them (AEMC 2011 p.iv)
Impact of retailer and network charges bigger than C price.....
4. Treasury estimates of economic impacts of different abatement
scenarios: small differences in costs between -5% and -25%
scenarios for CPRS! (Australia’s Low Pollution Future, Treasury 2008)
Ignores benefits of reduced
climate change and other
benefits not able to be
modelled (see Garnaut)
5. Why is the economic impact of massive
carbon prices so small?
• Energy a fairly small cost in the economy
• Revenue from carbon price flows back through economy
via tax reductions, government services – C price is a
signal, not a cost to society
• Shifts to lower greenhouse impact fuels and cost-
effective energy efficiency improvement cut costs, create
net jobs
• ‘winners’ gain more demand for products, services
• ‘losers’ are high greenhouse intensity industries and
suppliers of high greenhouse impact product (assumes
no adjustment support and high C price) – but they’re
less than 10% of economy – and they can change
• Active policy can increase benefits, cut costs
6. Range of future costs of emission permits for 450 and 550 ppm
scenarios showing impact of accelerating technological change –
average of 9 models (IPCC WG3 Contribution to 4th Assessment Report, Cross-sectoral
chapter, Barker et al (2007)
Innovation cuts carbon price
Arrows show effects of
accelerated technological
change (ETC= Endogenous
Technological Change!)
7. Impact of CO2 prices on household price of various energy types –
indicative only, excluding taxes and profit margins. Note: prices
assumed 20c/kWh for electricity & cogen; Green Power 26c/kWh, gas
1.3 c/MJ, Diesel $1.50/L, Petrol $1.40/L
0 $10/tonne CO2 $30/t $50/t
300
250
200
150
100
50
0
Victorian Cogeneration Green Power Natural gas Diesel Petrol (c/L)
electricity ($/MWh) ($/MWh) ($/GJ) (cents/Litre)
($/MWh)
8. ‘Pass-through’ impacts of emission price
• Examples of impacts on prices of material and service
inputs (NIEIR, 2007) for $25/t CO2 if suppliers do not cut
emissions, ignoring free permit allocations and including
transport fuel:
– Sheet metal products +3.7%
– Household appliances +2.1%
– Bakery products +1%
– Fruit and vegetables +1.3%
– Clothing 1.8%
– Health services 0.3%
– Average 1.6% (Treasury estimate is 0.7% cost of living impact)
• Impact varies with greenhouse intensity – eg best bricks
cost increase is 1/3 of worst, etc
• Choose low emission suppliers
9. Installed PV capacity Australia (APVA 2011) – 2011 expected
to be at least as big as 2010 (+275 MW to end May)
In Melbourne 1 kW PV avoids approx 1.5 tonnes CO2 pa
600
500
Megawatts Capacity
400
300
200
100
0
1990 1995 2000 2005 2010
10. Household energy efficiency savings for an efficient ‘average’
household per annum: using less energy offsets higher price/unit
when C price is added (from Energy and Equity)
– saving electricity at 23c/kWh = saving $175/tonne CO2 avoided(Vic)
to $230/tonne (Aust average)
CO2 at CO2 at
2000
$30/tonne $50/tonne
1800
1600
(b) Carbon cost
Annual cost ($)
1400
(a)
1200
(c) Cost of energy efficiency
1000
measures
800
Energy Cost
600
400
200
0
EE h'hold BAU EE h'hold BAU
h'hold h'hold
11. Energy labelling and new technologies (eg LED
backlighting) have slashed TV power consumption
Operating Power (watts vs screen size) March 2011
400
Large traditional (CRT) TVs used
350 99 watts (68cm), 114W (76cm)
and 127W (80cm). These would
300 also require a set top box (using
around 13 watts)
250
watts
200
150
76 cm traditional TV + set-
top box=127 watts
100
50
0
0 20 40 60 80 100 120 140 160 180 200
Screen size (centimetres diagonal)
12. Useful to prepare a time-line of major opportunities to act
to cut energy use/ghgs and drive action – for example:
1.2 Year 2 - Year 4 -
No buy
Year 1 - changes efficient
1 low cost fridge
savings
Year 5 - energy-
Tonnes CO2 per year
0.8 efficient home
renovation
Year 3 - change
0.6 to fuel-efficient
car
0.4
0.2
0
0 1 2 3 4 5
YEAR
13. Example of a personal zero emission strategy for household
energy-related emissions – some or all of remaining emissions can
be offset each year
25 Baseline Year 2 - Year 4 -
No buy
Year 1 - changes efficient
low cost fridge
20 savings
Year 5 - energy-
Tonnes CO2 per year
Year 3 - change efficient home
to fuel-efficient renovation
15 car GHGs ignoring
Green Power,
offsets
10
Offsets Effect of Green GHGS
energy including
5
Green Power,
offset
reductions
0
0 1 2 3 4 5
YEAR