Valuation of Indian hospitality industry
•
0 gefällt mir•656 views

Valuation of Indian Hospitality Industry. Companies included for the same are East Indian Hotels, Indian Hotels Company and Mahindra Holidays.
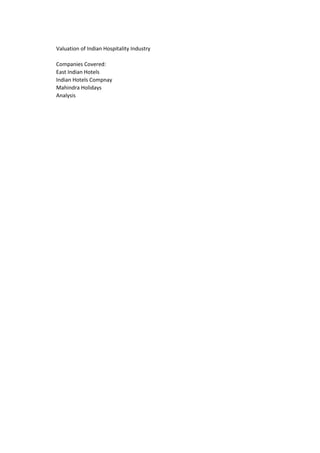
![Standalone Income Statement
Mär.06 Mär.07 Mär.08 Mär.09
12 mths 12 mths 12 mths 12 mths
INCOME
Revenue From Operations [Gross] 756 939 1,080 889
Less: Excise/Sevice Tax/Other Levies 0 0 0 0
Revenue From Operations [Net] 756 939 1,080 889
Total Operating Revenues 756 939 1,080 889
Other Income 142 53 68 181
Total Revenue 899 992 1,148 1,070
EXPENSES
Cost Of Materials Consumed 56 53 64 64
Operating And Direct Expenses 115 142 161 154
Employee Benefit Expenses 166 196 237 252
Finance Costs 87 98 75 83
Depreciation And Amortisation Expenses 41 43 45 54
Miscellaneous Expenses Written Off 0 6 3 0
Other Expenses 169 202 211 190
Total Expenses 634 741 795 797
Profit/Loss Before Exceptional, ExtraOrdinary Items And Tax 265 251 353 273
Exceptional Items 0 0 0 0
Profit/Loss Before Tax 265 251 353 273
Tax Expenses-Continued Operations
Current Tax 80 101 121 92
Less: MAT Credit Entitlement
Deferred Tax -12 -10 8 7
Other Direct Taxes 3 4 4 3
Tax For Earlier Years
Total Tax Expenses 71 95 133 102
Profit/Loss After Tax And Before ExtraOrdinary Items 194 156 221 171
Prior Period Items -1 -2 0 -1
Extraordinary Items -4 46 -3 0
Profit/Loss From Continuing Operations 189 200 217 170
Profit/Loss For The Period 189 200 217 170
586 743 856 671
COGS 171 196 224 217
Gross Profit (Sales-Cost of Materials Consumed-Purchase of
Stock in Trade-Operating and Direct Expenses-Change in
inventories](data:image/gif;base64,R0lGODlhAQABAIAAAAAAAP///yH5BAEAAAAALAAAAAABAAEAAAIBRAA7)
Empfohlen
Weitere ähnliche Inhalte
Was ist angesagt?
Ähnlich wie Valuation of Indian hospitality industry
Ähnlich wie Valuation of Indian hospitality industry (20)
Kürzlich hochgeladen
Kürzlich hochgeladen (20)
Valuation of Indian hospitality industry
- 1. Valuation of Indian Hospitality Industry Companies Covered: East Indian Hotels Indian Hotels Compnay Mahindra Holidays Analysis
- 2. Standalone Income Statement Mär.06 Mär.07 Mär.08 Mär.09 12 mths 12 mths 12 mths 12 mths INCOME Revenue From Operations [Gross] 756 939 1,080 889 Less: Excise/Sevice Tax/Other Levies 0 0 0 0 Revenue From Operations [Net] 756 939 1,080 889 Total Operating Revenues 756 939 1,080 889 Other Income 142 53 68 181 Total Revenue 899 992 1,148 1,070 EXPENSES Cost Of Materials Consumed 56 53 64 64 Operating And Direct Expenses 115 142 161 154 Employee Benefit Expenses 166 196 237 252 Finance Costs 87 98 75 83 Depreciation And Amortisation Expenses 41 43 45 54 Miscellaneous Expenses Written Off 0 6 3 0 Other Expenses 169 202 211 190 Total Expenses 634 741 795 797 Profit/Loss Before Exceptional, ExtraOrdinary Items And Tax 265 251 353 273 Exceptional Items 0 0 0 0 Profit/Loss Before Tax 265 251 353 273 Tax Expenses-Continued Operations Current Tax 80 101 121 92 Less: MAT Credit Entitlement Deferred Tax -12 -10 8 7 Other Direct Taxes 3 4 4 3 Tax For Earlier Years Total Tax Expenses 71 95 133 102 Profit/Loss After Tax And Before ExtraOrdinary Items 194 156 221 171 Prior Period Items -1 -2 0 -1 Extraordinary Items -4 46 -3 0 Profit/Loss From Continuing Operations 189 200 217 170 Profit/Loss For The Period 189 200 217 170 586 743 856 671 COGS 171 196 224 217 Gross Profit (Sales-Cost of Materials Consumed-Purchase of Stock in Trade-Operating and Direct Expenses-Change in inventories
- 3. Mär.10 Mär.11 Mär.12 Mär.13 Mär.14 Mär.15 Mär.16 12 mths 12 mths 12 mths 12 mths 12 mths 12 mths 12 mths 774 1,028 1,102 1,134 1,231 1,324 1,417 0 0 0 0 1 0 1 774 1,028 1,102 1,134 1,231 1,323 1,417 774 1,028 1,102 1,134 1,231 1,323 1,417 131 115 46 44 48 43 47 905 1,143 1,147 1,177 1,279 1,366 1,464 59 0 171 139 155 169 189 193 206 245 315 318 329 353 363 397 101 155 54 45 41 31 22 68 87 93 101 99 124 118 0 0 172 357 383 435 458 504 549 816 1,053 1,003 1,078 1,140 1,215 1,292 89 90 144 99 139 151 172 0 -4 11 -15 12 0 -18 89 85 155 84 151 151 154 17 4 19 15 31 49 52 0 2 0 0 0 14 17 13 11 19 6 1 0 0 0 -3 0 0 -1 31 21 33 21 50 55 52 58 65 122 63 102 97 101 0 0 0 0 0 -12 -7 0 0 57 65 122 51 95 97 101 57 65 122 51 95 97 101 544 889 947 965 1,042 1,130 1,210 230 139 155 169 189 193 206
- 4. Standlone Balance Sheet Mär.06 Mär.07 Mär.08 Mär.09 12 mths 12 mths 12 mths 12 mths EQUITIES AND LIABILITIES SHAREHOLDER'S FUNDS Equity Share Capital 52 79 79 79 Total Share Capital 52 79 79 79 Revaluation Reserves 248 244 241 238 Reserves and Surplus 745 851 985 1101 Total Reserves and Surplus 993 1096 1227 1339 Total Shareholders Funds 1045 1174 1305 1418 NON-CURRENT LIABILITIES Long Term Borrowings 709 782 724 1019 Deferred Tax Liabilities [Net] 120 111 125 133 Other Long Term Liabilities 0 0 0 0 Long Term Provisions 0 0 0 0 Total Non-Current Liabilities 829 893 848 1152 CURRENT LIABILITIES Short Term Borrowings 0 10 89 0 Trade Payables 96 88 110 144 Other Current Liabilities 47 73 81 85 Short Term Provisions 144 285 94 67 Total Current Liabilities 287 456 373 297 Total Capital And Liabilities 2161 2523 2527 2867 ASSETS NON-CURRENT ASSETS Tangible Assets 1117 1121 1328 1388 Intangible Assets 8 8 8 8 Capital Work-In-Progress 240 376 425 587 Intangible Assets Under Development 0 0 0 0 Fixed Assets 1365 1504 1761 1983 Non-Current Investments 304 412 359 350 Deferred Tax Assets [Net] 6 7 13 14 Long Term Loans And Advances 0 0 0 0 Other Non-Current Assets 15 9 2 0 Total Non-Current Assets 1690 1932 2135 2347 CURRENT ASSETS Current Investments Inventories 43 30 33 30 Trade Receivables 85 101 114 92 Cash And Cash Equivalents 66 51 26 42 Short Term Loans And Advances 276 409 218 355 OtherCurrentAssets 0 0 0 0 Total Current Assets 471 591 392 520 Total Assets 2161 2523 2527 2867
- 5. Mär.10 Mär.11 Mär.12 Mär.13 Mär.14 Mär.15 Mär.16 12 mths 12 mths 12 mths 12 mths 12 mths 12 mths 12 mths 79 114 114 114 114 114 114 79 114 114 114 114 114 114 235 232 229 226 223 221 219 1103 2241 2292 2284 2310 2322 2354 1339 2473 2521 2511 2533 2543 2573 1417 2588 2635 2625 2648 2657 2687 1121 535 150 144 104 64 24 148 150 163 174 192 190 191 0 13 13 3 2 5 4 0 12 12 13 15 17 17 1269 710 339 334 313 276 237 138 0 10 195 136 104 185 96 55 51 68 74 76 145 91 420 218 157 169 179 104 67 64 76 62 72 75 3 392 539 355 482 452 434 437 3079 3837 3329 3441 3413 3367 3361 1990 2061 2015 2116 2068 1946 1885 8 0 0 0 0 0 8 174 101 159 40 46 79 104 0 0 0 0 0 7 0 2173 2162 2175 2157 2114 2032 1997 378 605 616 706 704 729 697 15 0 0 0 0 0 0 0 280 313 321 331 315 392 0 0 0 0 0 0 0 2566 3047 3104 3184 3149 3076 3086 12 0 0 0 0 30 34 33 34 40 39 42 99 126 141 174 170 189 186 14 594 12 20 16 24 10 370 35 26 25 37 39 37 0 2 1 4 0 0 0 513 790 225 257 264 291 275 3079 3837 3329 3441 3413 3367 3361
- 6. Mär.06 Revenue 756 Growth % Total Expenses 634 Growth % % of Revenue 84% Depreciation 41 Growth % Depreciation to Fixed Assets 3% Finance Costs 87 Growth % Operating Costs (Total Expenses-Dep-Finance Costs) 506 Growth % % of Revenue 67% EBITDA (Revenue -Operating Expenses) 250 Growth % EBITDA Margin 33% Total Tax Expense 71 Growth % % of Tax to EBITDA 28% PAT 189 Growth % PAT Margin 25% Fixed Assets 1365 Change in Fixed Assets (Current-Previous) Growth % % of Revenue 180% Current Assets 471 Growth % % of Revenue 62% Current Liabilities 287 Growth % % of Revenue 38% Working Capital 184 Change in WC (Current-Previous) CAPEX (CHANGE IN FIXED ASSETS - DEP) FCFF (EBITDA Formula) (EBITDA(1-Tax Rate)+Dep(Tax Rate)-capex-change in WC) 191
- 7. WACC 8.5%
- 8. Mär.07 Mär.08 Mär.09 Mär.10 Mär.11 Mär.12 Mär.13 Mär.14 Mär.15 939 1,080 889 774 1,028 1,102 1,134 1,231 1,323 24% 15% -18% -13% 33% 7% 3% 9% 8% 741 795 797 816 1,053 1,003 1,078 1,140 1,215 17% 7% 0% 2% 29% -5% 7% 6% 7% 79% 74% 90% 105% 102% 91% 95% 93% 92% 43 45 54 68 87 93 101 99 124 4% 6% 20% 25% 29% 6% 8% -2% 25% 3% 3% 3% 3% 4% 4% 5% 5% 6% 98 75 83 101 155 54 45 41 31 13% -24% 10% 22% 54% -65% -17% -10% -25% 601 675 660 647 810 856 933 1,000 1,060 19% 12% -2% -2% 25% 6% 9% 7% 6% 64% 62% 74% 84% 79% 78% 82% 81% 80% 338 405 229 127 217 246 201 231 263 35% 20% -44% -44% 70% 13% -18% 15% 14% 36% 38% 26% 16% 21% 22% 18% 19% 20% 95 133 102 31 21 33 21 50 55 33% 40% -23% -69% -33% 56% -36% 138% 10% 28% 33% 45% 25% 10% 13% 10% 22% 21% 200 217 170 57 65 122 51 95 97 6% 8% -22% -66% 13% 90% -58% 86% 2% 21% 20% 19% 7% 6% 11% 4% 8% 7% 1504 1761 1983 2173 2162 2175 2157 2114 2032 139 257 222 190 -10 13 -18 -43 -81 10% 17% 13% 10% 0% 1% -1% -2% -4% 160% 163% 223% 281% 210% 197% 190% 172% 154% 591 392 520 513 790 225 257 264 291 26% -34% 33% -1% 54% -72% 14% 3% 10% 63% 36% 59% 66% 77% 20% 23% 21% 22% 456 373 297 392 539 355 482 452 434 59% -18% -20% 32% 38% -34% 36% -6% -4% 49% 35% 33% 51% 52% 32% 42% 37% 33% 135 19 223 120 250 -130 -225 -188 -143 -49 -116 204 -103 130 -380 -95 36 45 96 212 167 122 -98 -81 -119 -142 -205 209 192 -221 94 173 687 404 308 394
- 9. 8.5% 8.5% 8.5% 8.5% 8.5% 8.5% 8.5% 8.5% 8.5% Current Market Price (31/03/16) Upside/Downside Indian Hospitality Industy is growing(7%) belo growth rate can Years (t) Discounted FCFF Sum of Discounted FCFF (Valuve of Company) Shares Outstanding FCFF per share
- 10. Mär.16 Mär.17 Mär.18 Mär.19 Mär.20 Mär.21 1,417 1523 1637 1752 1857 1968 7% 7.5% 7.5% 7% 6% 6% 1,292 1399 1500 1604 1702 1803 6% 8.3% 7.2% 7% 6% 6% 91% 92% 92% 92% 92% 92% 118 132 144 150 161 171 -5% 11.9% 9.2% 5% 7% 6% 6% 6% 6% 6% 6% 6% 22 31 28 27 29 28 -28% 41.1% -10.2% -3% 6% -3% 1,152 1,236 1,328 1,426 1,513 1,605 9% 7.3% 7.4% 7% 6% 6% 81% 81% 81% 81% 81% 82% 264 286 309 325 344 363 1% 8.3% 7.7% 5% 6% 6% 19% 19% 19% 19% 19% 18% 52 59 63 66 70 74 -4% 13.5% 6.3% 5% 7% 5% 20% 21% 20% 20% 20% 20% 101 64 74 82 84 91 5% -36.5% 14.8% 11% 3% 8% 7% 4% 5% 5% 5% 5% 1997 2367 2456 2607 2812 2954 -35 370 89 151 205 142 -2% 18.5% 3.7% 6% 8% 5% 141% 155% 150% 149% 151% 150% 275 319 340 357 384 406 -6% 16.2% 6.6% 5% 8% 6% 19% 21% 21% 20% 21% 21% 437 510 530 564 607 638 1% 16.6% 4.0% 7% 8% 5% 31% 33% 32% 32% 33% 32% -162 -191 -190 -208 -223 -233 -19 -28 1 -18 -15 -10 -153 238 -55 1 44 -29 408 45 329 307 278 363 9472 Terminal Va
- 11. 8.5% 8.5% 8.5% 8.5% 8.5% 8.5% 8.5% Growth Rate 1 2 3 4 5 5 41 280 240 200 241 6299 7302 57.2 127.75 104.85 22% %) below GDP growth (7.6%). So the terminal rate can be 3-4%
- 12. al Value Formula FCFF of 5th Year *(1+g)/(WACC-g)
- 13. 4.5%
- 14. Ratios Mär.06 Mär.07 Mär.08 Mär.09 EPS (PAT/Shares Outstanding) 36.0 5.1 5.5 4.3 EPS Growth -86% 8% -22% Net Worth 1045 1174 1305 1418 Book Value (Net Worth/Shares) 199.5 29.9 33.2 36.1 Sales/Share 144.4 23.9 27.5 22.6 Operating Cashflows Operating Cashflow per share 0.0 0.0 0.0 0.0 DPS 10 1.4 1.8 1.2 Current Market Price 92.77 94.00 137.00 86.45 Debt (STB+LTB) 709 792 813 1019 Cash and Cash Equivalents 66 51 26 42 Net Debt (STB+LTB-Cash) 643 741 786 977 Market Capitalization (CMP*Shares) 486.0 3693.7 5383.4 3397.1 Number of Shares Oustanding 5.24 39.30 39.30 39.30 EV (Mcap+Net Debt) 1129 4435 6170 4374 Operating Revenues 756 939 1,080 889 EBITDA (Revenue-Op Exp) 250 338 405 229 EBIT (EBITDA-Dep) 210 296 360 174 Price to Earnings (CMP/EPS) 2.6 18.4 24.8 19.9 Price to Book Value (CMP/Book Value) 0.5 3.1 4.1 2.4 Price to Sales (Price/Sales per Share) 0.6 3.9 5.0 3.8 Price to Operating Cashflow #DIV/0! #DIV/0! #DIV/0! #DIV/0! Price to Earnings Growth (P/E Ratio/EPS Growth*100) -1.1 16.4 -4.0 Dividend Yield (DPS/CMP) 11% 1% 1% 1% EV/Sales 1.5 4.7 5.7 4.9 EV/EBITDA 4.5 13.1 15.2 19.1 EV/EBIT 5.4 15.0 17.1 25.1
- 15. Mär.10 Mär.11 Mär.12 Mär.13 Mär.14 Mär.15 Mär.16 1.5 1.1 2.1 0.9 1.7 1.7 1.8 -66% -22% 90% -58% 86% 2% 5% 1417 2588 2635 2625 2648 2657 2687 36.1 45.3 46.1 45.9 46.3 46.5 47.0 19.7 18.0 19.3 19.8 21.5 23.1 24.8 216.93 133.61 221.99 246.71 210.62 0.0 0.0 3.8 2.3 3.9 4.3 3.7 1.2 0.9 1.1 0.9 1.1 1.1 1.1 121.10 80.80 85.60 55.30 72.85 107.15 104.85 1260 535 160 340 240 168 209 14 594 12 20 16 24 10 1246 -59 148 319 224 144 200 4758.6 4618.1 4892.5 3160.7 4163.7 6124.2 5992.7 39.30 57.16 57.16 57.16 57.16 57.16 57.16 6004 4559 5041 3480 4387 6268 6192 774 1,028 1,102 1,134 1,231 1,323 1,417 127 217 246 201 231 263 264 59 130 153 100 132 139 147 83.1 71.6 40.0 62.0 43.8 63.4 59.1 3.4 1.8 1.9 1.2 1.6 2.3 2.2 6.1 4.5 4.4 2.8 3.4 4.6 4.2 #DIV/0! #DIV/0! 0.39 0.41 0.33 0.43 0.50 -1.8 -3.6 1.0 -0.9 0.8 64.0 20.9 1% 1% 1% 2% 2% 1% 1% 7.8 4.4 4.6 3.1 3.6 4.7 4.4 47.1 21.0 20.5 17.3 19.0 23.9 23.4 101.1 35.2 33.0 34.8 33.3 45.2 42.2
- 16. Mär.06 Profitability Ratios Gross Profit Ratio (GP/Sales) 77% Return on Sales (PAT/Sales) 25% Return on Assets (PAT/Assets) 9% Return on Equity (PAT/Networth) 18% Net Profit Ratio (NP/Sales) 25% Liquidity Ratios Current Ratio 1.6 Quick Ratio 1.5 Cash Ratio (Cash+Cash Equivalents+Invested Funds)/CL 0.2 Net Working Capital 184.4 Management Efficiency Ratios Receivable Turnover (Sales/Avg Acc Receivable) 8.9 Average Days outstanding (Net sales/365) 2.1 Day Sales Outstanding (Trade Recevivables/Average) 41.2 Inventory Turnover (COGS/Avg Inventory) 3.9 Average inventory outstanding (COGS/365) 0.5 Days Inventory Outstanding (Inventory/Average) 92.5 Accounts Payable Turnover (COGS/Avg Acc Payable) 1.8 Average payables outstanding (COGS/365) 0.5 Days Payable Outstanding (Acc Payable/Average) 204.3 Operating Cycle (Acc Rec+Inventory) 133.8 Cash Conversion Cycle (Acc Rec+Inventory-Acc Pay) -70.5 Total Asset Turnover (Sales/Average Total Assets) 0.3 Leverage Ratios Debt Ratio (Total Liabilities/Total Assets) (Provisions not included) 0.4 Equity Ratio (Total Equity/ Total Assets) 0.5 Debt-Equity Ratio (Total Liabilities/ Total Equity) (Provisions not included) 0.9 Times Interest Earned (EBIT/Interest Expense) 2.4
- 17. Mär.07 Mär.08 Mär.09 Mär.10 Mär.11 Mär.12 Mär.13 Mär.14 Mär.15 79% 79% 76% 70% 87% 86% 85% 85% 85% 21% 20% 19% 7% 6% 11% 4% 8% 7% 8% 9% 6% 2% 2% 4% 1% 3% 3% 17% 17% 12% 4% 2% 5% 2% 4% 4% 21% 20% 19% 7% 6% 11% 4% 8% 7% 1.3 1.1 1.8 1.3 1.5 0.6 0.5 0.6 0.7 1.2 1.0 1.6 1.2 1.4 0.5 0.5 0.5 0.6 0.1 0.1 0.1 0.0 1.1 0.1 0.0 0.0 0.1 135.3 18.8 223.1 120.5 250.3 -130.1 -224.7 -188.2 -143.0 9.3 9.4 9.6 7.8 8.2 7.8 6.5 7.2 7.0 2.6 3.0 2.4 2.1 2.8 3.0 3.1 3.4 3.6 39.4 38.7 37.9 46.8 44.6 46.8 55.9 50.5 52.0 6.4 6.7 7.2 7.7 4.1 4.7 4.9 4.7 4.9 0.5 0.6 0.6 0.6 0.4 0.4 0.5 0.5 0.5 56.6 54.2 51.0 47.7 88.7 78.1 73.9 76.9 73.8 2.2 2.0 1.5 2.4 2.5 3.0 2.5 2.5 2.5 0.5 0.6 0.6 0.6 0.4 0.4 0.5 0.5 0.5 163.5 178.4 242.5 151.5 145.8 119.8 146.3 144.1 144.4 96.0 92.8 88.9 94.4 133.4 124.8 129.7 127.4 125.9 -67.5 -85.5 -153.6 -57.0 -12.5 5.0 -16.5 -16.8 -18.5 0.4 0.4 0.3 0.3 0.3 0.3 0.3 0.4 0.4 0.4 0.4 0.5 0.5 0.3 0.2 0.2 0.2 0.2 0.5 0.5 0.5 0.5 0.7 0.8 0.8 0.8 0.8 0.9 0.9 1.0 1.1 0.5 0.2 0.3 0.3 0.2 3.0 4.8 2.1 0.6 0.8 2.8 2.2 3.2 4.5
- 19. Standlaone Profit and Loss Mär.06 Mär.07 Mär.08 Mär.09 12 mths 12 mths 12 mths 12 mths INCOME Revenue From Operations [Gross] 1,084 1,545 1,765 1,620 Revenue From Operations [Net] 1,084 1,545 1,765 1,620 Total Operating Revenues 1,084 1,545 1,765 1,620 Other Income 67 100 60 96 Total Revenue 1,151 1,645 1,824 1,716 EXPENSES Cost Of Materials Consumed 68 80 93 99 Operating And Direct Expenses 172 235 274 251 Employee Benefit Expenses 223 279 305 390 Finance Costs 44 98 101 122 Depreciation And Amortisation Expenses 66 91 85 94 Other Expenses 306 386 385 391 Total Expenses 879 1,170 1,244 1,348 Profit/Loss Before Exceptional, ExtraOrdinary Items And Tax 272 475 580 369 Exceptional Items 0 0 0 0 Profit/Loss Before Tax 272 475 580 369 Tax Expenses-Continued Operations Current Tax 85 64 191 109 Less: MAT Credit Entitlement 0 0 0 0 Deferred Tax -2 84 2 9 Other Direct Taxes 6 5 5 7 Tax For Earlier Years 0 0 0 0 Total Tax Expenses 88 152 199 125 Profit/Loss After Tax And Before ExtraOrdinary Items 184 322 382 244 Prior Period Items 0 0 -4 -4 Extraordinary Items 0 0 0 -6 Profit/Loss From Continuing Operations 184 322 377 234 Profit/Loss For The Period 184 322 377 234 844 1,229 1,398 1,270 COGS 240 315 367 349 Gross Profit (Sales-Cost of Materials Consumed-Purchase of Stock in Trade-Operating and Direct Expenses-Change in inventories
- 20. Mär.10 Mär.11 Mär.12 Mär.13 Mär.14 Mär.15 Mär.16 12 mths 12 mths 12 mths 12 mths 12 mths 12 mths 12 mths 1,473 1,673 1,809 1,876 1,930 2,024 2,274 1,473 1,673 1,809 1,876 1,930 2,024 2,274 1,473 1,673 1,809 1,876 1,930 2,024 2,274 116 64 56 49 48 79 109 1,589 1,737 1,865 1,925 1,977 2,104 2,382 101 0 0 0 0 0 0 250 458 524 563 604 639 707 360 412 471 477 473 531 616 175 146 112 105 99 89 88 104 108 114 125 122 118 127 383 384 408 432 464 496 522 1,373 1,510 1,629 1,702 1,761 1,873 2,060 216 227 236 223 216 231 322 0 -6 -6 -433 -737 -229 -10 216 221 230 -210 -521 2 312 56 49 50 53 58 41 52 0 33 34 0 0 41 52 5 59 68 25 16 84 112 1 0 0 0 0 0 0 0 5 85 -11 -5 0 -1 62 80 145 67 70 84 111 154 141 145 -277 -590 -82 201 -3 0 0 0 0 0 0 2 0 0 0 0 0 0 153 141 145 -277 -590 -82 201 153 141 145 -277 -590 -82 201 1,123 1,215 1,285 1,313 1,326 1,386 1,567 350 458 524 563 604 639 707
- 21. Standalone Balance Sheet Mär.06 Mär.07 Mär.08 Mär.09 12 mths 12 mths 12 mths 12 mths EQUITIES AND LIABILITIES SHAREHOLDER'S FUNDS Equity Share Capital 57 59 60 72 Total Share Capital 57 59 60 72 Reserves and Surplus 1658 1738 1956 2975 Total Reserves and Surplus 1658 1738 1956 2975 Money Received Against Share Warrants 0 0 0 0 Total Shareholders Funds 1715 1797 2017 3048 Equity Share Application Money 2 2 20 0 NON-CURRENT LIABILITIES Long Term Borrowings 534 853 907 1737 Deferred Tax Liabilities [Net] 92 150 155 167 Other Long Term Liabilities 0 0 0 0 Long Term Provisions 0 0 0 0 Total Non-Current Liabilities 627 1003 1061 1904 CURRENT LIABILITIES Short Term Borrowings 10 91 228 30 Trade Payables 132 189 149 178 Other Current Liabilities 109 117 276 166 Short Term Provisions 150 153 47 153 Total Current Liabilities 402 550 699 527 Total Capital And Liabilities 2745 3352 3797 5478 ASSETS NON-CURRENT ASSETS Tangible Assets 811 1325 1348 1560 Intangible Assets 32 35 24 26 Capital Work-In-Progress 49 112 265 215 Intangible Assets Under Development 0 0 0 0 Fixed Assets 892 1472 1637 1801 Non-Current Investments 657 963 978 2027 Deferred Tax Assets [Net] 12 15 17 20 Long Term Loans And Advances 0 0 0 0 Other Non-Current Assets 1 1 1 1 Total Non-Current Assets 1562 2451 2633 3848 CURRENT ASSETS Current Investments 0 0 0 0 Inventories 26 29 33 39 Trade Receivables 80 127 138 102 Cash And Cash Equivalents 90 67 74 23 Short Term Loans And Advances 987 677 869 1454 OtherCurrentAssets 0 1 50 12 Total Current Assets 1183 901 1164 1630 Total Assets 2745 3352 3797 5478
- 22. Mär.10 Mär.11 Mär.12 Mär.13 Mär.14 Mär.15 Mär.16 12 mths 12 mths 12 mths 12 mths 12 mths 12 mths 12 mths 72 76 76 81 81 81 99 72 76 76 81 81 81 99 2621 3029 3167 3227 2613 2534 3787 2621 3029 3167 3227 2613 2534 3787 0 124 124 0 0 0 0 2693 3229 3368 3308 2694 2615 3886 0 0 0 0 0 0 0 2636 1259 2040 2268 2154 2898 1558 171 28 96 96 107 191 303 0 23 83 75 77 585 485 0 567 585 674 581 27 49 2807 1876 2804 3113 2919 3702 2395 15 14 123 194 162 1 7 245 133 149 152 173 165 203 170 1326 790 343 633 634 942 700 142 131 117 185 81 129 1130 1615 1192 806 1153 881 1282 6631 6720 7364 7226 6766 7198 7562 1534 1710 1827 1745 1678 1989 2115 28 16 12 11 20 23 41 370 333 225 308 430 140 55 0 3 4 2 1 1 0 1931 2062 2068 2066 2129 2154 2212 2446 2409 3622 3369 2762 2546 2781 202 0 0 1255 1347 1441 1555 1440 1437 0 10 28 12 5 3 2 4580 5736 7065 6888 6450 6143 6432 0 617 0 0 0 432 136 31 32 40 38 40 43 45 122 104 125 125 124 139 161 447 90 23 49 43 356 22 1451 113 72 93 68 53 717 0 28 40 33 41 33 49 2051 984 299 338 316 1056 1130 6631 6720 7364 7226 6766 7198 7562
- 23. Mär.06 Revenue 1,084 Growth % Total Expenses 879 Growth % % of Revenue 81% Depreciation 66 Growth % Depreciation to Fixed Assets 7% Finance Costs 44 Growth % Operating Costs (Total Expenses-Dep-Finance Costs) 769 Growth % % of Revenue 71% EBITDA (Revenue -Operating Expenses) 315 Growth % EBITDA Margin 29% Total Tax Expense 88 Growth % % of Tax to EBITDA 28% PAT 184 Growth % PAT Margin 17% Fixed Assets 892 Change in Fixed Assets (Current-Previous) Growth % % of Revenue 82% Current Assets 1183 Growth % % of Revenue 109% Current Liabilities 402 Growth % % of Revenue 37% Working Capital 781 Change in WC (Current-Previous) CAPEX (CHANGE IN FIXED ASSETS - DEP) FCFF (EBITDA Formula) (EBITDA(1-Tax Rate)+Dep(Tax Rate)-capex-change in WC) 245
- 24. WACC 7.5%
- 25. Mär.07 Mär.08 Mär.09 Mär.10 Mär.11 Mär.12 Mär.13 Mär.14 Mär.15 1,545 1,765 1,620 1,473 1,673 1,809 1,876 1,930 2,024 42% 14% -8% -9% 14% 8% 4% 3% 5% 1,170 1,244 1,348 1,373 1,510 1,629 1,702 1,761 1,873 33% 6% 8% 2% 10% 8% 4% 3% 6% 76% 70% 83% 93% 90% 90% 91% 91% 93% 91 85 94 104 108 114 125 122 118 39% -7% 11% 10% 4% 5% 10% -2% -4% 6% 5% 5% 5% 5% 6% 6% 6% 5% 98 101 122 175 146 112 105 99 89 124% 3% 21% 44% -17% -24% -6% -6% -9% 981 1,057 1,131 1,093 1,255 1,403 1,471 1,540 1,666 27% 8% 7% -3% 15% 12% 5% 5% 8% 64% 60% 70% 74% 75% 78% 78% 80% 82% 564 708 489 380 418 406 404 389 359 79% 26% -31% -22% 10% -3% 0% -4% -8% 36% 40% 30% 26% 25% 22% 22% 20% 18% 152 199 125 62 80 145 67 70 84 73% 31% -37% -50% 28% 81% -54% 4% 21% 27% 28% 25% 16% 19% 36% 17% 18% 23% 322 377 234 153 141 145 -277 -590 -82 75% 17% -38% -35% -8% 3% -290% 113% -86% 21% 21% 14% 10% 8% 8% -15% -31% -4% 1472 1637 1801 1931 2062 2068 2066 2129 2154 580 165 163 131 130 7 -3 64 24 65% 11% 10% 7% 7% 0% 0% 3% 1% 95% 93% 111% 131% 123% 114% 110% 110% 106% 901 1164 1630 2051 984 299 338 316 1056 -24% 29% 40% 26% -52% -70% 13% -7% 234% 58% 66% 101% 139% 59% 17% 18% 16% 52% 550 699 527 1130 1615 1192 806 1153 881 37% 27% -25% 114% 43% -26% -32% 43% -24% 36% 40% 33% 77% 97% 66% 43% 60% 44% 351 465 1,103 921 -631 -893 -468 -837 174 -430 114 638 -182 -1552 -262 426 -370 1012 488 80 69 27 22 -107 -128 -59 -93 378 339 -319 491 1,889 671 60 770 -616
- 26. 7.5% 7.5% 7.5% 7.5% 7.5% 7.5% 7.5% 7.5% 7.5% Current Market Price (31/03/16) Upside/Downside Indian Hospitality Industy is growing(7%) belo growth rate can Years (t) Discounted FCFF Sum of Discounted FCFF (Valuve of Company) Shares Outstanding FCFF per share
- 27. Mär.16 Mär.17 Mär.18 Mär.19 Mär.20 Mär.21 2,274 2456 2652 2838 3036 3249 12% 8% 8% 7% 7% 7% 2,060 2246 2428 2588 2775 2969 10% 9% 8% 7% 7% 7% 91% 91% 92% 91% 91% 91% 127 145 153 164 177 188 8% 14% 5% 7% 8% 6% 6% 6% 6% 6% 6% 6% 88 92 90 90 91 90 -1% 4% -2% 0% 1% -1% 1,845 2,009 2,184 2,335 2,508 2,691 11% 9% 9% 7% 7% 7% 81% 82% 82% 82% 83% 83% 429 447 468 503 528 558 19% 4% 5% 8% 5% 6% 19% 18% 18% 18% 17% 17% 111 100 112 121 124 133 32% -10% 12% 8% 2% 7% 26% 22% 24% 24% 23% 24% 201 109 113 129 137 147 -345% -46% 3% 14% 7% 7% 9% 4% 4% 5% 5% 5% 2212 2570 2726 2882 3128 3328 58 359 155 157 245 201 3% 16% 6% 6% 9% 6% 97% 105% 103% 102% 103% 102% 1130 968 1249 1288 1335 1478 7% -14% 29% 3% 4% 11% 50% 39% 47% 45% 44% 45% 1282 1307 1354 1520 1597 1703 45% 2% 4% 12% 5% 7% 56% 53% 51% 54% 53% 52% -152 -339 -105 -231 -263 -225 -326 -187 234 -126 -31 38 -69 213 2 -7 69 13 746 354 156 555 409 420 14620 Terminal Va
- 28. 7.5% 7.5% 7.5% 7.5% 7.5% 7.5% 7.5% Growth Rate 1 2 3 4 5 5 329 135 447 306 292 10184 11693 98.9 118.19 99.33 19% %) below GDP growth (7.6%). So the terminal rate can be 3-4%
- 29. al Value Formula FCFF of 5th Year *(1+g)/(WACC-g)
- 30. 4.5%
- 31. Ratios Mär.06 Mär.07 Mär.08 Mär.09 EPS (PAT/Shares Outstanding) 32.4 5.5 6.3 3.2 EPS Growth -83% 14% -48% Net Worth 1715 1797 2017 3048 Book Value (Net Worth/Shares) 302.6 30.6 33.5 42.1 Sales/Share 191.3 26.3 29.3 22.4 Operating Cashflows Operating Cashflow per share 0.00 0.00 0.00 0.00 DPS 13 1.6 1.9 1.2 Current Market Price 125.01 133.95 111.85 39.40 Debt (STB+LTB) 544 944 1134 1766 Cash and Cash Equivalents 90 67 74 23 Net Debt (STB+LTB-Cash) 454 877 1060 1743 Market Capitalization (CMP*Shares) 708.4 7857.9 6742.9 2850.5 Number of Shares Oustanding 5.667 58.66 60.29 72.35 EV (Mcap+Net Debt) 1163 8735 7803 4594 Operating Revenues 1,084 1,545 1,765 1,620 EBITDA (Revenue-Op Exp) 315 564 708 489 EBIT (EBITDA-Dep) 249 472 622 394 Price to Earnings (CMP/EPS) 3.9 24.4 17.9 12.2 Price to Book Value (CMP/Book Value) 0.4 4.4 3.3 0.9 Price to Sales (Price/Sales per Share) 0.7 5.1 3.8 1.8 Price to Operating Cashflow #DIV/0! #DIV/0! #DIV/0! #DIV/0! Price to Earnings Growth (P/E Ratio/EPS Growth*100) -1.6 8.0 -0.8 Dividend Yield (DPS/CMP) 10% 1% 2% 3% EV/Sales 1.07 5.65 4.42 2.84 EV/EBITDA 3.7 15.5 11.0 9.4 EV/EBIT 4.7 18.5 12.5 11.7
- 32. Mär.10 Mär.11 Mär.12 Mär.13 Mär.14 Mär.15 Mär.16 2.1 1.9 1.9 -3.4 -7.3 -1.0 2.0 -35% -12% 3% -279% 113% -86% -300% 2693 3229 3368 3308 2694 2615 3886 37.2 42.5 44.3 41.0 33.4 32.4 39.3 20.4 22.0 23.8 23.2 23.9 25.1 23.0 448.62 332.02 367.86 399.78 431.95 0.00 0.00 5.91 4.11 4.56 4.95 4.37 1 1 1 0.8 0 0 0 102.55 84.20 63.85 53.50 72.30 116.85 99.30 2651 1273 2163 2462 2315 2899 1566 447 90 23 49 43 356 22 2203 1182 2140 2413 2272 2543 1543 7419.2 6394.8 4849.2 4320.0 5838.0 9435.3 9823.5 72.35 75.95 75.95 80.75 80.75 80.75 98.93 9623 7577 6989 6733 8110 11979 11367 1,473 1,673 1,809 1,876 1,930 2,024 2,274 380 418 406 404 389 359 429 276 310 292 279 267 241 301 48.5 45.3 33.4 -15.6 -9.9 -115.0 48.9 2.8 2.0 1.4 1.3 2.2 3.6 2.5 5.0 3.8 2.7 2.3 3.0 4.7 4.3 #DIV/0! #DIV/0! 0.14 0.16 0.20 0.29 0.23 -3.0 -7.0 22.0 -0.2 0.6 -1.4 -0.3 1% 1% 2% 1% 0% 0% 0% 6.53 4.53 3.86 3.59 4.20 5.92 5.00 25.3 18.1 17.2 16.6 20.8 33.4 26.5 34.8 24.4 23.9 24.1 30.4 49.7 37.7
- 33. Mär.06 Profitability Ratios Gross Profit Ratio (GP/Sales) 78% Return on Sales (PAT/Sales) 17% Return on Assets (PAT/Assets) 7% Return on Equity (PAT/Networth) 11% Net Profit Ratio (NP/Sales) 17% Liquidity Ratios Current Ratio 2.9 Quick Ratio 2.9 Cash Ratio (Cash+Cash Equivalents+Invested Funds)/CL 0.2 Net Working Capital 780.9 Management Efficiency Ratios Receivable Turnover (Sales/Avg Acc Receivable) 13.6 Average Days outstanding (Net sales/365) 3.0 Day Sales Outstanding (Trade Recevivables/Average) 26.8 Inventory Turnover (COGS/Avg Inventory) 9.3 Average inventory outstanding (COGS/365) 0.7 Days Inventory Outstanding (Inventory/Average) 39.3 Accounts Payable Turnover (COGS/Avg Acc Payable) 1.8 Average payables outstanding (COGS/365) 0.7 Days Payable Outstanding (Acc Payable/Average) 200.7 Operating Cycle (Acc Rec+Inventory) 66.1 Cash Conversion Cycle (Acc Rec+Inventory-Acc Pay) -134.5 Total Asset Turnover (Sales/Average Total Assets) 0.4 Leverage Ratios Debt Ratio (Total Liabilities/Total Assets) (Provisions not included) 0.3 Equity Ratio (Total Equity/ Total Assets) 0.6 Debt-Equity Ratio (Total Liabilities/ Total Equity) (Provisions not included) 0.5 Times Interest Earned (EBIT/Interest Expense) 5.7
- 34. Mär.07 Mär.08 Mär.09 Mär.10 Mär.11 Mär.12 Mär.13 Mär.14 Mär.15 80% 79% 78% 76% 73% 71% 70% 69% 68% 21% 21% 14% 10% 8% 8% -15% -31% -4% 10% 10% 4% 2% 2% 2% -4% -9% -1% 18% 19% 8% 6% 4% 4% -8% -22% -3% 21% 21% 14% 10% 8% 8% -15% -31% -4% 1.6 1.7 3.1 1.8 0.6 0.3 0.4 0.3 1.2 1.6 1.6 3.0 1.8 0.6 0.2 0.4 0.2 1.1 0.1 0.1 0.0 0.4 0.4 0.0 0.1 0.0 0.9 351.2 465.0 1103.1 920.6 -631.2 -893.3 -467.8 -837.4 174.5 12.1 12.7 15.9 12.1 16.1 14.5 15.0 15.5 14.6 4.2 4.8 4.4 4.0 4.6 5.0 5.1 5.3 5.5 30.1 28.6 22.9 30.1 22.7 25.2 24.4 23.5 25.0 10.9 11.2 9.0 11.2 14.4 13.2 14.7 15.0 14.8 0.9 1.0 1.0 1.0 1.3 1.4 1.5 1.7 1.7 33.6 32.7 40.6 32.6 25.4 27.7 24.9 24.3 24.7 1.7 2.5 2.0 1.4 3.4 3.5 3.7 3.5 3.9 0.9 1.0 1.0 1.0 1.3 1.4 1.5 1.7 1.7 219.1 147.9 185.7 255.6 106.3 103.7 98.9 104.9 94.6 63.7 61.3 63.6 62.7 48.0 52.9 49.3 47.8 49.7 -155.5 -86.6 -122.1 -192.9 -58.3 -50.8 -49.7 -57.0 -44.9 0.5 0.5 0.3 0.2 0.2 0.2 0.3 0.3 0.3 0.4 0.5 0.4 0.5 0.4 0.4 0.4 0.5 0.6 0.5 0.5 0.6 0.4 0.5 0.5 0.5 0.4 0.4 0.8 0.8 0.7 1.2 0.9 1.0 0.9 1.2 1.7 4.8 6.1 3.2 1.6 2.1 2.6 2.7 2.7 2.7
- 36. Standalone Income Statement Mär.06 Mär.07 Mär.08 Mär.09 12 mths 12 mths 12 mths 12 mths INCOME Revenue From Operations [Gross] 153 232 353 393 Revenue From Operations [Net] 153 232 353 393 Other Operating Revenues 0 0 0 0 Total Operating Revenues 153 232 353 393 Other Income 4 7 20 51 Total Revenue 156 239 373 444 EXPENSES Operating And Direct Expenses 5 7 8 11 Employee Benefit Expenses 19 28 47 61 Finance Costs 2 1 1 4 Depreciation And Amortisation Expenses 8 9 11 17 Other Expenses 89 128 179 219 Total Expenses 123 173 247 312 Profit/Loss Before Exceptional, ExtraOrdinary Items And Tax 34 66 126 132 Exceptional Items 0 Profit/Loss Before Tax 34 66 126 132 Tax Expenses-Continued Operations Current Tax 0 13 40 39 Deferred Tax 11 10 4 6 Other Direct Taxes 1 2 2 4 Total Tax Expenses 13 25 45 48 Profit/Loss After Tax And Before ExtraOrdinary Items 21 42 81 83 Profit/Loss From Continuing Operations 21 42 81 83 Profit/Loss For The Period 21 42 81 83 148 226 345 382 COGS 5 7 8 11 Gross Profit (Sales-Cost of Materials Consumed-Purchase of Stock in Trade-Operating and Direct Expenses-Change in inventories
- 37. Mär.10 Mär.11 Mär.12 Mär.13 Mär.14 Mär.15 Mär.16 12 mths 12 mths 12 mths 12 mths 12 mths 12 mths 12 mths 469 487 574 659 730 734 885 469 487 574 659 730 734 885 0 0 0 0 47 61 67 469 487 574 659 778 795 952 47 47 63 57 21 13 11 516 534 637 716 799 808 963 16 0 0 0 0 0 0 74 85 126 150 174 162 192 1 0 0 2 1 0 0 19 20 20 21 38 65 71 230 280 344 385 444 453 528 339 385 491 557 658 681 791 177 149 146 159 141 127 172 0 0 0 -22 0 177 149 146 159 141 105 172 55 43 41 47 29 19 50 4 3 0 5 18 7 5 0 0 59 47 41 52 47 26 55 118 103 105 107 95 79 117 118 103 105 107 95 79 117 118 103 105 107 95 79 117 453 487 574 659 778 795 952 16 0 0 0 0 0 0
- 38. Standalone Balance Sheet Mär.06 Mär.07 Mär.08 Mär.09 12 mths 12 mths 12 mths 12 mths EQUITIES AND LIABILITIES SHAREHOLDER'S FUNDS Equity Share Capital 28 28 76 77 Preference Share Capital 0 0 0 0 Total Share Capital 28 28 76 77 Revaluation Reserves 0 0 0 0 Reserves and Surplus 18 49 65 121 Total Reserves and Surplus 18 49 65 121 Money Received Against Share Warrants 0 0 0 0 Employees Stock Options 0 0 0 0 Total Shareholders Funds 46 78 142 198 Equity Share Application Money 0 0 0 0 Government/Other Grants 0 0 0 0 NON-CURRENT LIABILITIES Long Term Borrowings 235 321 0 0 Deferred Tax Liabilities [Net] 18 20 24 30 Other Long Term Liabilities 0 Long Term Provisions 0 0 0 0 Total Non-Current Liabilities 254 341 24 30 CURRENT LIABILITIES Short Term Borrowings 14 6 20 25 Trade Payables 0 0 0 0 Other Current Liabilities 38 40 540 721 Short Term Provisions 0 13 17 32 Total Current Liabilities 52 58 577 777 Total Capital And Liabilities 352 477 742 1006 ASSETS NON-CURRENT ASSETS Tangible Assets 158 182 220 347 Intangible Assets 3 5 6 11 Capital Work-In-Progress 2 13 45 51 Intangible Assets Under Development 0 0 0 0 Fixed Assets 163 200 270 409 Non-Current Investments 0 0 0 1 Deferred Tax Assets [Net] 8 0 0 1 Long Term Loans And Advances 0 0 0 0 Other Non-Current Assets 0 0 0 0 Total Non-Current Assets 171 200 271 411 CURRENT ASSETS Current Investments 0 0 0 0 Inventories 1 2 3 5 Trade Receivables 146 219 403 484 Cash And Cash Equivalents 8 8 7 32 Short Term Loans And Advances 26 42 58 74 OtherCurrentAssets 0 6 0 0
- 39. Total Current Assets 180 277 471 595 Total Assets 352 477 742 1006
- 40. Mär.10 Mär.11 Mär.12 Mär.13 Mär.14 Mär.15 Mär.16 12 mths 12 mths 12 mths 12 mths 12 mths 12 mths 12 mths 83 84 84 84 88 88 88 0 0 0 0 0 0 0 83 84 84 84 88 88 88 0 0 0 0 0 0 0 356 420 485 550 702 643 604 356 420 485 550 702 643 604 0 0 0 0 0 0 0 0 0 0 0 0 0 0 439 503 569 634 790 731 692 0 0 0 0 0 0 0 0 1028 1123 0 0 0 0 0 0 0 0 0 0 0 34 37 37 41 59 60 66 0 1259 1400 1514 1689 0 1 1 4 4 5 7 34 38 38 1304 1463 1579 1763 10 2 1 2 3 6 0 142 64 85 77 92 114 126 806 83 117 185 221 241 266 41 40 40 42 42 43 54 999 188 243 306 358 404 446 1473 1757 1973 2244 2611 2714 2901 395 438 439 449 667 773 902 11 2 2 3 23 22 16 98 135 184 231 64 64 33 0 0 12 21 5 7 4 505 575 636 705 758 868 954 227 32 82 176 146 142 80 1 0 0 74 129 151 177 196 173 0 445 363 330 384 437 515 733 1126 1211 1361 1465 1642 1722 0 113 126 10 13 10 58 3 3 4 6 10 5 6 632 438 518 626 843 870 992 24 63 8 34 39 17 28 81 13 104 198 221 154 84 0 1 1 9 20 16 12
- 41. 740 631 762 883 1146 1072 1179 1473 1757 1973 2244 2611 2714 2901
- 42. Mär.06 Revenue 153 Growth % Total Expenses 123 Growth % % of Revenue 80% Depreciation 8 Growth % Depreciation to Fixed Assets 5% Finance Costs 1.93 Growth % Operating Costs (Total Expenses-Dep-Finance Costs) 113 Growth % % of Revenue 74% EBITDA (Revenue -Operating Expenses) 40 Growth % EBITDA Margin 26% Total Tax Expense 13 Growth % % of Tax to EBITDA 32% PAT 21 Growth % PAT Margin 14% Fixed Assets 163 Change in Fixed Assets (Current-Previous) Growth % % of Revenue 107% Current Assets 180 Growth % % of Revenue 118% Current Liabilities 52 Growth % % of Revenue 34% Working Capital 129 Change in WC (Current-Previous) CAPEX (CHANGE IN FIXED ASSETS - DEP) FCFF (EBITDA Formula) (EBITDA(1-Tax Rate)+Dep(Tax Rate)-capex-change in WC) 29
- 43. WACC 10.6%
- 44. Mär.07 Mär.08 Mär.09 Mär.10 Mär.11 Mär.12 Mär.13 Mär.14 Mär.15 232 353 393 469 487 574 659 778 795 52% 52% 11% 19% 4% 18% 15% 18% 2% 173 247 312 339 385 491 557 658 681 41% 43% 26% 9% 13% 28% 13% 18% 4% 74% 70% 79% 72% 79% 86% 85% 85% 86% 9 11 17 19 20 20 21 38 65 14% 27% 48% 14% 5% 1% 4% 79% 72% 4% 4% 4% 4% 3% 3% 3% 5% 8% 1.36 0.89 4.28 1.16 0.16 0.35 1.60 0.97 0.25 -30% -35% 381% -73% -86% 119% 357% -39% -74% 163 235 291 319 365 470 534 619 615 44% 44% 24% 10% 14% 29% 14% 16% -1% 70% 67% 74% 68% 75% 82% 81% 80% 77% 70 118 102 150 123 103 124 159 180 76% 69% -14% 47% -18% -16% 20% 28% 13% 30% 33% 26% 32% 25% 18% 19% 20% 23% 25 45 48 59 47 41 52 47 26 95% 84% 7% 21% -21% -12% 27% -10% -45% 35% 39% 48% 39% 38% 40% 42% 29% 14% 42 81 83 118 103 105 107 95 79 100% 93% 4% 41% -13% 2% 2% -12% -16% 18% 23% 21% 25% 21% 18% 16% 12% 10% 200 270 409 505 575 636 705 758 868 37 70 139 95 70 61 68 53 110 23% 35% 51% 23% 14% 11% 11% 8% 14% 86% 77% 104% 108% 118% 111% 107% 97% 109% 277 471 595 740 631 762 883 1146 1072 53% 70% 26% 24% -15% 21% 16% 30% -6% 119% 134% 151% 158% 130% 133% 134% 147% 135% 58 577 777 999 188 243 306 358 404 13% 887% 35% 29% -81% 29% 26% 17% 13% 25% 163% 198% 213% 39% 42% 47% 46% 51% 219 -105 -183 -259 443 519 577 788 668 90 -324 -77 -77 702 76 58 211 -119 28 59 122 76 50 41 47 15 44 -70 342 16 99 -669 -46 -24 -103 238
- 45. 10.6% 10.6% 10.6% 10.6% 10.6% 10.6% 10.6% 10.6% 10.6% Current Market Price (31/03/16) Upside/Downside Indian Hospitality Industy is growing(7%) belo growth rate can Years (t) Discounted FCFF Sum of Discounted FCFF (Valuve of Company) Shares Outstanding FCFF per share
- 46. Mär.16 Mär.17 Mär.18 Mär.19 Mär.20 Mär.21 952 952 952 952 952 952 20% 18% 18% 7% 19% 19% 791 803 803 799 802 801 16% 2% 0% 0% 0% 0% 83% 84% 84% 84% 84% 84% 71 65 71 69 69 70 9% -9% 10% -3% -1% 2% 7% 7% 7% 7% 7% 7% 0.08 0.43 0.25 0.26 0.31 0.27 -68% 442% -41% 1% 23% -13% 719 738 731 729 733 731 17% 3% -1% 0% 0% 0% 76% 78% 77% 77% 77% 77% 232 214 220 222 219 220 29% -8% 3% 1% -2% 1% 24% 22% 23% 23% 23% 23% 55 48 44 49 47 47 111% -12% -8% 10% -4% -1% 24% 22% 20% 22% 22% 21% 117 100 104 104 103 103 49% -15% 4% -1% -1% 1% 12% 11% 11% 11% 11% 11% 954 973 989 972 978 980 86 19 15 -17 6 2 10% 2% 2% -2% 1% 0% 100% 102% 104% 102% 103% 103% 1179 1288 1250 1239 1259 1249 10% 9% -3% -1% 2% -1% 124% 135% 131% 130% 132% 131% 446 456 462 455 457 458 10% 2% 1% -2% 1% 0% 47% 48% 49% 48% 48% 48% 733 832 788 784 802 791 65 99 -44 -4 17 -10 15 -46 -56 -86 -63 -68 115 126 290 278 232 267 5002 Terminal Va
- 47. 10.6% 10.6% 10.6% 10.6% 10.6% 10.6% 10.6% Growth Rate 1 2 3 4 5 5 114 237 206 155 161 3023 3896 8.8 442.43 386.85 14% %) below GDP growth (7.6%). So the terminal rate can be 3-4%
- 48. al Value Formula FCFF of 5th Year *(1+g)/(WACC-g)
- 49. 5.0%
- 50. Ratios Mär.06 Mär.07 Mär.08 Mär.09 EPS (PAT/Shares Outstanding) 7.3 14.7 10.5 10.8 EPS Growth 100% -28% 3% Net Worth 46 78 142 198 Book Value (Net Worth/Shares) 16.3 27.4 18.5 25.7 Sales/Share 53.8 81.8 46.2 51.1 Operating Cashflows Operating Cashflow per share 0.0 0.0 0.0 0.0 DPS 0 3 3 3 Current Market Price 317.10 317.10 317.10 317.10 Debt (STB+LTB) 249 326 20 25 Cash and Cash Equivalents 8 8 7 32 Net Debt (STB+LTB-Cash) 241 318 13 -7 Market Capitalization (CMP*Shares) 900.6 900.6 2423.3 2441.0 Number of Shares Oustanding 2.840 2.840 7.642 7.698 EV (Mcap+Net Debt) 1142 1219 2437 2434 Operating Revenues 153 232 353 393 EBITDA (Revenue-Op Exp) 40 70 118 102 EBIT (EBITDA-Dep) 32 61 107 85 Price to Earnings (CMP/EPS) 43.2 21.6 30.1 29.3 Price to Book Value (CMP/Book Value) 19.5 11.6 17.1 12.3 Price to Sales (Price/Sales per Share) 5.9 3.9 6.9 6.2 Price to Operating Cashflow #DIV/0! #DIV/0! #DIV/0! #DIV/0! Price to Earnings Growth (P/E Ratio/EPS Growth*100) 3.2 -11.2 111.8 Dividend Yield (DPS/CMP) 0% 1% 1% 1% EV/Sales 7.48 5.25 6.91 6.19 EV/EBITDA 28.90 17.49 20.67 23.87 EV/EBIT 35.95 20.04 22.86 28.55
- 51. Mär.10 Mär.11 Mär.12 Mär.13 Mär.14 Mär.15 Mär.16 14.1 12.3 12.5 12.8 10.7 9.0 13.3 31% -13% 2% 2% -16% -16% 48% 439 503 569 634 790 731 692 52.7 60.2 67.8 75.6 89.7 83.0 78.6 56.3 58.3 68.4 78.5 88.3 90.3 108.1 189.89 212.88 31.77 269.09 118.60 0.0 0.0 22.6 25.4 3.6 30.6 13.5 4 4 4 4 4 4 5 543.85 353.35 301.60 257.00 232.35 257.05 386.85 10 2 1 2 3 6 0 24 63 8 34 39 17 28 -14 -61 -8 -32 -36 -10 -28 4529.7 2954.4 2528.9 2155.7 2045.1 2262.8 3406.6 8.329 8.361 8.385 8.388 8.802 8.803 8.806 4515 2893 2521 2124 2009 2253 3379 469 487 574 659 778 795 952 150 123 103 124 159 180 232 131 102 83 103 121 114 161 38.4 28.8 24.2 20.2 21.6 28.6 29.0 10.3 5.9 4.4 3.4 2.6 3.1 4.9 9.7 6.1 4.4 3.3 2.6 2.8 3.6 #DIV/0! #DIV/0! 1.6 1.2 7.3 1.0 3.3 17.8 -26.9 196.1 116.8 -14.7 -15.7 8.0 1% 1% 1% 2% 2% 2% 1% 9.63 5.94 4.39 3.23 2.58 2.83 3.55 30.12 23.62 24.37 17.09 12.64 12.53 14.54 34.52 28.25 30.33 20.61 16.61 19.69 20.97
- 52. Mär.06 Profitability Ratios Gross Profit Ratio (GP/Sales) 97% Return on Sales (PAT/Sales) 14% Return on Assets (PAT/Assets) 6% Return on Equity (PAT/Networth) 45% Net Profit Ratio (NP/Sales) 14% Liquidity Ratios Current Ratio 3.5 Quick Ratio 3.5 Cash Ratio (Cash+Cash Equivalents+Invested Funds)/CL 0.1 Net Working Capital 128.7 Management Efficiency Ratios Receivable Turnover (Sales/Avg Acc Receivable) 1.0 Average Days outstanding (Net sales/365) 0.4 Day Sales Outstanding (Trade Recevivables/Average) 348.3 Inventory Turnover (COGS/Avg Inventory) 5.3 Average inventory outstanding (COGS/365) 0.01 Days Inventory Outstanding (Inventory/Average) 68.6 Accounts Payable Turnover (COGS/Avg Acc Payable) Average payables outstanding (COGS/365) 0.01 Days Payable Outstanding (Acc Payable/Average) 0.0 Operating Cycle (Acc Rec+Inventory) 416.9 Cash Conversion Cycle (Acc Rec+Inventory-Acc Pay) 416.9 Total Asset Turnover (Sales/Average Total Assets) 0.4 Leverage Ratios Debt Ratio (Total Liabilities/Total Assets) (Provisions not included) 0.9 Equity Ratio (Total Equity/ Total Assets) 0.1 Debt-Equity Ratio (Total Liabilities/ Total Equity) (Provisions not included) 6.6 Times Interest Earned (EBIT/Interest Expense) 16.5
- 53. Mär.07 Mär.08 Mär.09 Mär.10 Mär.11 Mär.12 Mär.13 Mär.14 Mär.15 97% 98% 97% 97% 100% 100% 100% 100% 100% 18% 23% 21% 25% 21% 18% 16% 12% 10% 9% 11% 8% 8% 6% 5% 5% 4% 3% 54% 57% 42% 27% 20% 18% 17% 12% 11% 18% 23% 21% 25% 21% 18% 16% 12% 10% 4.7 0.8 0.8 0.7 3.4 3.1 2.9 3.2 2.7 4.7 0.8 0.8 0.7 3.3 3.1 2.9 3.2 2.6 0.1 0.0 0.0 0.0 0.9 0.6 0.1 0.1 0.1 218.5 -105.4 -182.5 -259.1 443.2 518.8 576.7 787.7 668.3 1.1 0.9 0.8 0.7 1.1 1.1 1.1 0.9 0.9 0.6 1.0 1.1 1.3 1.3 1.6 1.8 2.1 2.2 343.7 417.5 449.6 491.8 328.1 329.5 347.0 395.9 399.7 3.7 2.4 2.1 5.3 0.0 0.0 0.0 0.0 0.0 0.02 0.02 0.03 0.04 0.0 0.0 0.0 0.0 0.0 97.6 153.8 172.3 69.5 0.1 0.0 0.0 0.0 0.0 0.0 0.02 0.02 0.03 0.04 0.00 0.00 0.00 0.00 0.00 0.00 0.00 0.00 3328.29 441.2 571.2 621.9 561.2 328.1 329.5 347.0 395.9 399.7 441.2 571.2 621.9 -2767.0 328.1 329.5 347.0 395.9 399.7 0.5 0.5 0.4 0.3 0.3 0.3 0.3 0.3 0.3 0.8 0.8 0.8 0.7 0.1 0.1 0.7 0.7 0.7 0.2 0.2 0.2 0.3 0.3 0.3 0.3 0.3 0.3 5.0 4.1 3.9 2.3 0.4 0.4 2.5 2.2 2.6 44.7 119.8 19.9 112.8 640.1 237.5 64.4 124.7 457.6
- 55. Company Profiles Indian Hotels Company EIH Limited Mahindra Holidays and Resorts India Limited Discounted Cash Flow Valuation Analysis Revenue Growth: The revenue growth of the companies have been assumed as fo o Indian Hotels Company: A growth rate of 8% has been assumed or FY17 and o EIH Limited: A growth rate of 7.5% has been assumed for FY17 and FY18, 7 o Mahindra Hotels and Resorts India Limited: A growth rate of 18% has been assum The other financials are based on the revenue and the average of the last three y WACC (Weighted Average Cost of Capital) for the companies is taken as follows: o Indian Hotels Company: 7.5% o EIH Limited: 8.5% o Mahindra Hotels and Resorts India Limited: 10.6% The Indian Hospitality industry is growing at 7% and the GDP growth is 7.6%. The After calculating the value of the company the following recommendation can be Investors are recommended to BUY the stock of Indian Hotels Company with a targ Investors are recommended to BUY the stock of EIH Limited with a target of Rs12 Investors are recommended to BUY the stock of Mahindra Holidays with a target Relative Valuation Analysis I dia Hotels Co pa a d its su sidia ies olle ti el k o as Taj G oup of Hotels, o ed Tata G oup company was incorporated in 1903 and completed a century in 2003. It has 100 hotels in 62 Maldives, Malaysia, the UK, USA, Bhutan, Sri Lan EIH Limited backed by the Oberoi Group, operates hotels and cruisers in five countries und 1934 and is also engaged in flight catering, airport restaurants, travel and tour serv Mahindra Holidays & Resorts India Ltd., (MHRIL) is a part of the Leisure and Hospitality secto a d Clu Mahi d a Holida s a d toda has a fast g o i g usto e ase of o e , e e s a d India and abroad. Price to Earnings: The ratio tells how much investors are willing to pay per rupee of earnings. A h is currently undervalued and can be a good investment opportunity for the investors. Indian Ho invest in Mahindra Holidays than EIH and Indian Hotels Company.
- 56. EV/Sales: EV-to-sales gives investors a quantifiable metric of how much it costs to purchase the c prospects are not very attractive. EV-to-sales values usually are between 1 and 3. Indian Hote Hotels Company will greatly increase in the future. EV/EBITDA: EV-to-EBITDA is a valuation multiple which gives the value of the company along w indicates that the company might be overvalued. Indian Hotels Company, EIH Limited and Mah all the companies. EV/EBIT: EV-to-EBIT is a aluatio ultiple hi h a s e s the uestio What is a o pa ei g alued pe e Limited and Mahindra Holidays have EV/EBIT multiple of 37.7, 42.2, 20.97 respectively in 201 Price to Earnings Growth: The ratio is a valuation metric for determining the relative trade-off betw the sto k i a o da e ith the sto k s u e t esti ated EP“ g o th. If the atio is less tha the sto k s EP aluatio a d the sto k is o e alued. I dia Hotels Co pa , EIH Li ited a d Mahi d a Holida s ha e a P/E Price to Sales: The P/S ratio measures the price of a company's stock against its annual sales. P company is overvalued. Indian Hotels Company, EIH Limited and Mahindra Holidays have a P/ Price to Cash Flow: This ratio compares the stock's market price to the amount of cash flow the c a high price but is not generating enough cash flows to support its operations. Indian Hotels Co Dividend Yield Ratio: The dividend yield is a financial ratio that measures the amount of cash di companies with low dividend yield and for investors who are looking for dividend as a regular are looking for capital appreciation can invest in these companies. This is because every rupee Price to Book Value: This ratio tells how many times a company's stock is trading per share co Company, EIH Limited and Mahindra Holidays have a P/B of 2.5, 2.2 and 4.9 respectively in 20
- 57. ed as follows: r FY17 and FY18 and 7% for FY19, FY20 and FY21. FY18, 7% for FY19 and 6% for FY20 and FY21. as been assumed for FY17 and FY18, 7% for FY19 and 19% for FY20 and FY21. ree years. ws: . The hospitality industry is growing marginally below GDP growth rate so a terminal growth rate between 4-5% an be given for each of the companies: a target of Rs118.19 and an upside of 19% on the current market price (31/3/2016). f Rs127.75 and an upside of 22% on the current market price (31/3/2016). target of Rs442.43 and an upside of 14% on the current market price (31/3/2016). f Hotels, o ed Tata G oup is o e of the Asia s la gest a d fi est g oup of hotels. The ls in 62 locations across India and its international presence includes 15 hotels in the tan, Sri Lanka, Africa and the Middle East. tries under the luxury 'Oberoi' and five-star 'Trident' brands. Its history dates back to r services, car rentals, project management and corporate air charters. sector of the Mahindra Group. It started its operations in 1996 with its flagship of o e , e e s a d 6 eautiful eso ts at so e of the ost e oti lo atio s i abroad. ings. A high P/E ratio means that the investors are expecting higher earnings from the company when compared ian Hotels Company, EIH Limited and Mahindra Holidays have a P/E of 48.9, 59.1 and 29 respectively in 2016
- 58. ase the company's sales. A high EV-to-sales can be a sign that investors believe the future sales will greatly increase. A lo Hotels Company, EIH Limited and Mahindra Holidays have EV/Sales multiple of 5, 4.4, 3.55 respectively in 20 ng with the debt of the company. It is a common ratio which is used for valuation of takeovers. A low ratio ind Mahindra Holidays have EV/EBITDA multiple of 26.5, 23.4, 14.54 respectively in 2016. This indicates that M a o pa ei g alued pe ea h upee of EBIT? A high ultiple ea s the o pa is o e alued a d lo ultiple ea s the o in 2016. It is costlier to takeover Indian Hotels Company and EIH Limited when compared to Mahindra Holidays e-off between the price of a stock, the earnings generated per share (EPS), and the company's expected growt io is less tha the sto k s EP“ g o th ill su pass a ket s aluatio a d the sto k is u de alued. If the atio is g eate tha the Mahi d a Holida s ha e a P/E G o th of . , . a d espe ti el i 6. I dia Hotels Co pa s sto k is u de alued hile the al sales. P/S reflects how many times investors are paying for every rupee of a company's sales. A lower ratio means the a P/S of 4.3, 4.2 and 3.6 respectively in 2016. f cash flow the company generates on a per-share basis. A smaller ratio is considered better than a higher multiple. This is becau tels Company, EIH Limited and Mahindra Holidays have a P/B of 0.23, 0.50 and 3.3 respectively in 2016. f cash dividends distributed to common shareholders relative to the market value per share. Investors who are a regular income will prefer companies with high dividend yield. Indian Hotels Company, EIH Limited and Mahind rupee that is not distributed as dividend is used for the growth of the company. per share compared to the company's book value per share. A lower P/B ratio is considered good for investment as in 2016. By considering the P/B ratio investors are recommended to invest in EIH than Indian Hotels Compan
- 59. n 4-5% can be assumed for each of the companies. mpared to companies with lower P/E. A lower P/E means the company in 2016. By considering the P/E ratio investors are recommended to
- 60. reatly increase. A lower EV-to-sales can signal that the future sales in 2016. This indicates that the investors believe that the sales of Indian ratio indicates that a company might be undervalued, and a high ratio that Mahindra Holidays can be a potential target for a takeover among d lo ultiple ea s the o pa is u de alued. I dia Hotels Co pa , EIH lidays. ed growth. If the ratio is 1 it means that the market is correctly valuing he atio is g eate tha the the sto k s EP“ g o th is less tha the a ket s sto k is u de alued hile the othe t o a e o e alued. r ratio means the company is undervalued and a high ratio means the ltiple. This is because a high P/CF ratio would mean the firm is trading at are looking for a capital appreciation as the main return will prefer ahindra Holidays have a dividend yield of 0-1% in 2016. Investors who ent as the stock is undervalued and it is good to invest. Indian Hotels pany and Mahindra Holidays.