
Empfohlen
Weitere ähnliche Inhalte
Was ist angesagt?
Was ist angesagt? (20)
Andere mochten auch
Andere mochten auch (18)
Ähnlich wie What is business analytics
Ähnlich wie What is business analytics (20)
Kürzlich hochgeladen
Kürzlich hochgeladen (20)
What is business analytics
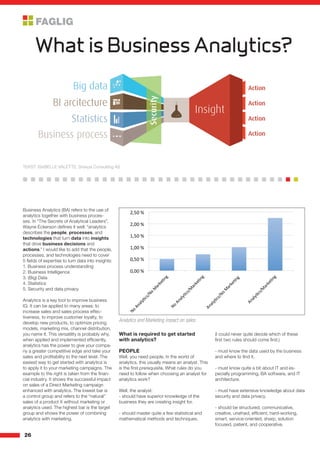
- 1. 26 What is Business Analytics? TEKST: ISABELLE VALETTE, Sherpa Consulting AS ■ ■ ■ ■ ■ ■ ■ ■ ■ ■ ■ ■ ■ ■ ■ ■ ■ ■ ■ ■ ■ ■ ■ ■ ■ ■ ■ ■ ■ ■ ■ ■ ■ ■ ■ Business Analytics (BA) refers to the use of analytics together with business proces- ses. In “The Secrets of Analytical Leaders”, Wayne Eckerson defines it well: “analytics describes the people, processes, and technologies that turn data into insights that drive business decisions and actions.” I would like to add that the people, processes, and technologies need to cover 5 fields of expertise to turn data into insights: 1. Business process understanding 2. Business Intelligence 3. (Big) Data 4. Statistics 5. Security and data privacy Analytics is a key tool to improve business IQ. It can be applied to many areas: to increase sales and sales process effec- tiveness, to improve customer loyalty, to develop new products, to optimize pricing models, marketing mix, channel distribution, you name it. This versatility is probably why, when applied and implemented efficiently, analytics has the power to give your compa- ny a greater competitive edge and take your sales and profitability to the next level. The easiest way to get started with analytics is to apply it to your marketing campaigns. The example to the right is taken from the finan- cial industry. It shows the successful impact on sales of a Direct Marketing campaign enhanced with analytics. The lowest bar is a control group and refers to the “natural” sales of a product X without marketing or analytics used. The highest bar is the target group and shows the power of combining analytics with marketing. What is required to get started with analytics? PEOPLE Well, you need people. In the world of analytics, this usually means an analyst. This is the first prerequisite. What rules do you need to follow when choosing an analyst for analytics work? Well, the analyst: - should have superior knowledge of the business they are creating insight for. - should master quite a few statistical and mathematical methods and techniques. (I could never quite decide which of these first two rules should come first.) - must know the data used by the business and where to find it. - must know quite a bit about IT and es- pecially programming, BA software, and IT architecture. - must have extensive knowledge about data security and data privacy. - should be structured, communicative, creative, unafraid, efficient, hard-working, smart, service-oriented, sharp, solution focused, patient, and cooperative. Analytics and Marketing impact on sales
- 2. 27 This very sexy job has recently found a fancy tittle to go with it: data scientist. BUSINESS PROCESSES There are 4 proces- ses involved in creating analytics: a statistical process, a data process, an IT process, and a business process like sales, marketing, or HR. The statistical process is a must to produce analytics and often refers to a statistical methodology. CRISP-DM (Cross Industry Standard Process for Data Mining) is a methodology often used by analysts to create analytics. It focuses on the workflow that extracts insight out of data using ap- plied statistics (econometric modeling), mathematics (multivariate analysis), and/or machine learning (data mining). When you start out with analytics, it is often best to minimize the complexity around the processes involved. The statistical process, as we have seen, is a must. When it comes to the other processes, try to simplify them as much as possible to begin with. That’s because, once the size of data and the number of processes increase, analytics be- comes more than just statistical techniques. Why? Because this is when the require- ments for analytics also increase in comple- xity. If you have one task with little data, use excel. If you have many tasks with a lot of data, then you need the big analytical guns: an IT architecture to handle massive data- sets, analytics software to perform complex analytical processes efficiently, and people who know how to make all this stuff work. IT or BUSINESS INTELLIGENCE ARCHITECTURE Business intelli- gence (BI) covers the processes, methods, and IT-solutions used to provide fact based insight to the busi- ness. BI is normally used in the company or organization as a decision support system. The platforms for BA and BI are intimately connected with one another and the line between the two can be vague. To simplify: BI is like a magical hat, and the business analyst is the magician pulling out the rabbit (i.e. insights). There are many ways to get started with BA. I have seen amazing business insights created with only the statistics tool’s func- tionalities (Analysis ToolPak) in Excel, and in the beginning, that might be sufficient to produce insight. You can also download Analytics software for free, such as RapidMi- ner, R, or Python. If you are not very familiar with various programming languages, I would recommend RapidMiner; the user in- terface is easiest to learn, the online tutorials are sufficient, and the software runs on both Windows and Mac OS X. (BIG) DATA Data refers to a piece of information or a fact. The terms data, information, and knowledge are frequently used for overlapping concepts. They represent, however, different level of abstraction and reasoning. Data is the lowest level, informa- tion comes next, and finally, knowledge is the highest level among all three. Predictions are often seen as the highest form of know- ledge creation. Predicting the future with predictive analytics has been what one often associates with analytics; however, it is only one dimension of analytics. Descriptive and prescriptive analytics can also create a lot of value for your business. “What is Big Data?” is a question that I get asked a lot lately. In May 2011, the McKin- sey Global Institute released a paper that defines “Big Data” as “data sets whose size is beyond the ability of typical software da- tabase tools to capture, store, manage and analyze.” Here we are not talking about gi- gabytes, or a few terabytes, but hundreds or even thousands of terabytes. In “Taming the big data tidal wave”, Bill Franks digs into the characteristics of this new source of data: Volume, velocity, variety, and complexity. IBM added another characteristic to “Big Data”: Veracity. The volume of “Big Data” is huge, no doubt about it. However, it is not because it is big that it is insightful. So, what is all the fuss around “Big Data”, and how does it relate to analytics? “Big Data” is nothing but a new source of data (Twitter, Internet and phone logs, etc.) fed into the analytical processes. Traditionally, analytics started with building statistical models on historical data. Past events, past information, and past history were used to predict the future. “Big Data” is a powerful new source of information because it relates very much to real time events and real time action that, combined with all the history, can become an explosively accurate and informative input to create analytics. “Big Data” can enhance the power of analytics. It may also contribute to a change in the tradi- tional way of looking at a customer; we may see a swift change in the future: from valuing the most loyal and/or the most profitable customers to valuing the most loyal, profita- ble, and/or the most influential customers. Isabelle Valette Head of Business Analytics Sherpa Consulting STATISTICS/ MATHEMATICS TECHNIQUES AND METHODS The goal of analytics is to create insights generating true business impact. Every field of research that helps you achieve this is part of the analy- tics methodology. The analyst must at all times chose the tools that are best suited and most appropriate to solve the busi- ness problems at hands. John Chambers, the eminent and distinguished statistician, explains: “Greater Statistics can be defined simply, if loosely, as everything connected to learning from data, from the first plan- ning or collection to the last presentation and report.” In this aspect, many disciplines will cross the path of “Greater Statistics” to help extract insights from data: econometric modeling, MapReduce algorithms, multi- variate analysis, data mining, mathematical or linguistic computation, SQL or Java programming, geocoding, anthropology, etc. The analyst would be wise to open his mind to many fields to improve his/her insight creation skills. Therefore debating the diffe- rences between, and the respective value of, different fields of insight creation is pointless, since they have different role, purpose, and benefits. The question anyone should ask is “is this method or technique contributing to the insight creation process?” If the answer is yes, than this tool should be included in the analytics methodology. SECURITY & DATA PRIVACY The elephant in the room is usually rela- ted to privacy and se- curity issues around data usage. It is es- pecially relevant with the emergence of “Big Data” technology. Compliance challenges are a great opportunity for resources from different departments to come together, brainstorm, and find consensus on how the data is going to be used and not used. Once consensus has been reached, one would be advised to anchor the data usage guidelines with top management to secure under- standing, ownership, and approval on data usage, privacy, and security. To summarize, analytics is ultimately about creating business value and having a busi- ness impact. I wish you all the best with your analytical ambition.