Passing Frequency and the Effect on Scoring Variables and Outcomes in Basketball
•Als PPTX, PDF herunterladen•
1 gefällt mir•357 views

University of Canberra Performance Analysis in Sport research poster.
Empfohlen

Empfohlen
Weitere ähnliche Inhalte
Kürzlich hochgeladen
Kürzlich hochgeladen (16)
Empfohlen
Empfohlen (20)
Passing Frequency and the Effect on Scoring Variables and Outcomes in Basketball
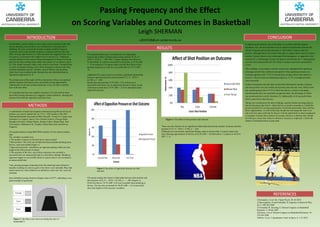
- 1. Passing Frequency and the Effect on Scoring Variables and Outcomes in Basketball Leigh SHERMAN INTRODUCTION CONCLUSION u3037038@uni.canberra.edu.au In basketball, a team’s ability to score relies on the transition of the ball In addressing the primary aim of the study, it was shown that the original into an attacking court position via a combination of passing and/or dribbling. Previous research has looked at simple variable frequency RESULTS hypothesis was incorrect and there was no statistical significance between the number of passes and scoring outcomes or the number of passes and shot occurrence such as the number of passes in isolation and how this may affect scoring opportunities (1). Other literature has suggested that one to position. Although there were trends in the data to suggest there may be a certain Chi-squared analysis gave no indication of a relationship two passes is associated with a higher level of success (2). Additional between the number of passes and scoring outcome X² (6, N= number of passes that are more advantages/disadvantageous, as suggested in the research alludes to fewer passes being advantageous in broken fast break 1035) = 8.430, p = .208. The 7+ passes category was shown to research (2): of all passages of play, the analysis showed that the 7+ passing plays play but also that winning teams make more passes in set offensive plays be least likely to result in a successful scoring play at 31.6% (SR were the most unsuccessful at31.6% while 3-4 passes were most successful at (3). This simple frequency data is only useful to an extent. Currently there = -.5) in contrast to 3-4 passes which was the most likely of the 37.6%. is a lack of research looking at how these frequencies interact with other passing categories to result in a successful shot at 37.6 % (SR = common basketball specific variables, such as defence and shooting, .4). Other findings, in accordance with the research (4), highlighted the significant which have been included as the literature has also identified them as advantage earned from a defensive perspective when applying pressure on a important components (4, 5). Additional Chi-square analysis revealed a significant relationship shooting opponent with 77.4% of missed shots coming while under defensive between opposition pressure and outcomeX² (2, N= 1035) = pressure. Likewise from an attacking perspective; 35.3% of unopposed shots The primary aim of this study will be to determine if there is an optimal 63.249, p = <.001. were successful. number of passes that lead to more successful scoring opportunities. Results also showed that 35.3% (SR = 4.2) of shots were Additionally it will look at what interaction, if any, the other variables successful when there was no opposition pressure (Figure 2) and Further investigation into the data revealed that although the number of passes have with each other. of all unsuccessful shots 77.4% (SR = .5) were attempted under and shot position were not related, shot position and outcome were. When in the opposition pressure. key, attacking teams drew 79.5% of their free throws, a massive advantage It is hypothesised that a low number of passes (1-2) will result in more considering that they are essentially unopposed shots, the advantage of which successful scoring outcomes as it suggests a faster transition , drawing less was mentioned above and in literature (5). Additionally of all successful shots pressure from both the opposition and shot clock. 40.6% came from within the key. Taking into consideration the above findings, coaches should encourage players METHODS and develop plans that look to attack the key as much as possible as it holds the greatest potential for scoring opportunities, from both general play shots and free A combination of hand and computer notational (using Microsoft Excel) throw opportunities. As well as this they should also encourage the team to try analysis was used in lapsed time on 15 (n = 1035) games of the 2011 and work into space and look for players with the opportunity to shoot unopposed National Basketball Association (NBA) Playoffs. A total of 11 teams were as it greatly increases their chances of scoring. Likewise in defence they should included (Los Angeles Lakers, New Orleans Hornets, Chicago Bulls, be looking to ensure that whatever defensive structure is employed, it limits the Figure 3: The affect of shot position and outcome Memphis Grizzlies, Atlanta Hawks, Boston Celtics, Miami Heat, New chances of attacking teams to gain open York Knicks, Oklahoma City Thunder, Dallas Mavericks and Denver Nuggets). There was also found to be no significant relationship between the number of passes and shot position X² (6, N= 1035) = 5.943, p = .430 Chi-squared analysis using IBM SPSS statistics 19 was used to analyse Although not a statistically significant finding, analysis showed that 3-4 passes lead to the date. most shooting opportunities in the key at 42.4% (SR = .0) followed by 1-2 passes at 34.6%% The variables recorded were: (SR = 1.1) 1.The number of passes in the lead up to a shot on goal* 2.Shot position. The court was divided into three possible shooting areas: the key, zone and outside (Figure 1) 3.Opposition pressure: classified as an opponent getting within one arm length of the ball at point of release 4.The outcome of the shot, one of three outcomes was recorded: a successful shot, an unsuccessful shot or a free throw attempt. Should an opponent happen to successfully block or reject a shot it was recorded as an unsuccessful shot. *only passing passages originating from the attacking teams defensive baseline resulting in a shot on goal or free throw were included. Plays that Figure 2: the affect of opposition pressure on shot lead to turnovers, fouls (offensive or defensive), time-out’s etc. were not outcome. included. Intra-reliability testing returned a Kappa value of 0.977, indicating a very Chi-square testing also found a relationship between shot position and good strength of agreement. shot outcome X²(4, N = 1035) = 63.249, p = < .001 (Figure 3). Of all free throws 79.5% (SR= 6.4) were awarded when attacking in the key. The key also accounted for 40.6% (SR= -.5) of successful shots (the highest of the outcome variables). REFERENCES 1)Fernandez, J et al. Int. J Sport Psych. 28: 65 2010 2) Stavroppulos, N and Foundalis, H. Inquiries in Sports & Phys. Ed. 3: 298-304 2005 3) Fernandez R, Ducoing, E. Iberian Congress on Basketball . Research. 4: 58-60, 2007 4)Alvarez, A et al. Iberian Congress on Basketball Research. 18: 370-384 2009 5)Piette, J et al. J. Quantitative Anal. In Sport. 6: 1-23 2010 Figure 1: the three court zones according the rules of basketball(1)