SlideShare ist ein Scribd-Unternehmen logo
1 von 6
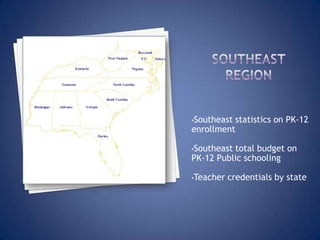
•Southeaststatistics on PK-12
enrollment

•Southeasttotal budget on
PK-12 Public schooling

•Teacher   credentials by state
2,399,000     2,223,409
2,199,000
1,999,000
1,799,000         1,679,998
1,599,000                     1,481,177
                                                      2009/2010
1,399,000                               1,245,153     enrollment
1,199,000                                             2010/2011
                                     985,302
  999,000                832,076                      Enrollment
  799,000740,405      679,192     717,185             Variance
  599,000                   502,454
  399,000                                   282,544
  199,000    69,878
   -1,000
           VA
           FL
           GA


           TN
           MS
           NC


           WV
           DC


           SC
           AL


           KY
           MD
25,000,000,000


20,000,000,000

                                               All instructional
15,000,000,000
                                               Materials
                                               Expenditures
10,000,000,000                                 Current
                                               Expenditures

 5,000,000,000


            0
                 AL   FL   KY   MS   SC   VA
Percentage distribution of public school students enrolled in prekindergarten through 12th grade,
     by race/ethnicity and state or jurisdiction: 2009

  State      Total     White        Black      Hispanic     Asian     Pacific     Am.            Two or
                                                                      Islander    Indian/AK      more races
                                                                                  Native

United        100.0       53.5       15.3         22.7        4.0        0.2          0.8            3.2
States
Alabama       100.0       57.8        34.4        4.1         1.0         ‡            0.5           2.2

DC            100.0        8.4        76.5        12.5        12.8       3.2            -           1.31

FL            100.0       46.7        22.1        25.7        2.3        0.11          0.2           2.5

GA            100.0       47.0        35.7        11.7        2.8        0.11          0.1           2.4

KY            100.0       80.9        10.1        4.3         1.2         ‡            0.3           3.0
MD            100.0       46.4        35.6        9.7         4.5         ‡           0.11           3.2

MS            100.0       44.2        50.7        2.4         0.4         ‡           0.31           1.8

NC            100.0       55.1        26.4        11.4        2.2         #            1.2           3.4

SC            100.0       53.5        36.7        5.8         1.2         ‡           0.21           2.4

TN            100.0       67.1        22.7        6.0         1.2        0.11          0.1           2.6
VA            100.0       57.3        23.3        9.8         4.9         #            0.3           4.1

WV            100.0       91.6        3.8         1.6         0.6         --          0.11           2.2
-- Not available
# Rounds to zero
‡ Reporting standards not met
All states require that certified teachers at a minimum have a Bachelor’s degree. All
pre-requisite coursework. All states require that you satisfactorily complete the Basic Skills Test
requirement and any Subject Area Competence assessments needed for your desired area of
instruction.

Alabama
Basic Skills Test
The APTTP consists of basic skills assessments from the ACT WorkKeys System and subject assessments
from the ETS Praxis II: Subject Tests.
Subject Area Competence
Praxis II: Subject Test in your specialty area

Florida
Basic Skills Test:
FTCE (Florida Teacher Certification Examinations): Florida General Knowledge Test (GK)
Subject Area Competence:
FTCE (Florida Teacher Certification Examinations): Florida Subject Area Examinations(PEd)
Professional Skills Test:F
TCE (Florida Teacher Certification Examinations): Florida Professional Education Test

Georgia
Basic Skills Test
Georgia does not require a basic skills test for student teaching or for certification.
Subject Area Competence
GACE Content and Professional Tests
"2009-2010 Public School Expenditures." Schooldata.com. MDR a D&B
Company, 2011. Web. 16 Dec. 2011.
http://www.schooldata.com/mdrreports.asp#expend.


Aud, S., Hussar, W., Kena, G., Bianco, K., Frohlich, L., Kemp, J.,
Tahan, K. (2011). The Condition of Education 2011 (NCES 2011-033).
U.S. Department of Education, National Center for Education
Statistics. Washington, DC: U.S. Government Printing Office.


Teacher Certification Map | Become a Teacher. Mat@usc, 2009. Web.
16 Dec. 2011. <http://certificationmap.com/.


U.S. Census Bureau. 2005. School Enrollment— Social and Economic
Characteristics of Students: October 2003, Current Population Report
P20-554, Washington, D.C.: U.S. Census Bureau.


.

Weitere ähnliche Inhalte

Ähnlich wie Clc week 3

BC Real Estate Forecast October 2012
BC Real Estate Forecast October 2012BC Real Estate Forecast October 2012
BC Real Estate Forecast October 2012Matt Collinge
 
InnovateED
InnovateEDInnovateED
InnovateEDmzb269
 
2012 Mid Year Industrial Market Report
2012 Mid Year Industrial Market Report2012 Mid Year Industrial Market Report
2012 Mid Year Industrial Market Reportbrianparrish
 
Old Florida National Bank Economic Update
Old Florida National Bank Economic UpdateOld Florida National Bank Economic Update
Old Florida National Bank Economic Updateteresadonaldson
 
Selecting Corn Silage Hybrids
Selecting Corn Silage HybridsSelecting Corn Silage Hybrids
Selecting Corn Silage Hybridsnick_roy00
 
Strong Fund Reserves Diminish Need For Venture Capitalists to Raise Additiona...
Strong Fund Reserves Diminish Need For Venture Capitalists to Raise Additiona...Strong Fund Reserves Diminish Need For Venture Capitalists to Raise Additiona...
Strong Fund Reserves Diminish Need For Venture Capitalists to Raise Additiona...mensa25
 
Economic Recap Bozeman Chamber of Commerce 2009
Economic Recap Bozeman Chamber of Commerce 2009Economic Recap Bozeman Chamber of Commerce 2009
Economic Recap Bozeman Chamber of Commerce 2009eralandmark
 
Wgr sw presentation
Wgr sw presentationWgr sw presentation
Wgr sw presentationkrgc
 

Ähnlich wie Clc week 3 (13)

Charlotte's stats
Charlotte's statsCharlotte's stats
Charlotte's stats
 
BC Real Estate Forecast October 2012
BC Real Estate Forecast October 2012BC Real Estate Forecast October 2012
BC Real Estate Forecast October 2012
 
2010 State of the Community
2010 State of the Community2010 State of the Community
2010 State of the Community
 
InnovateED
InnovateEDInnovateED
InnovateED
 
2012 Mid Year Industrial Market Report
2012 Mid Year Industrial Market Report2012 Mid Year Industrial Market Report
2012 Mid Year Industrial Market Report
 
Old Florida National Bank Economic Update
Old Florida National Bank Economic UpdateOld Florida National Bank Economic Update
Old Florida National Bank Economic Update
 
Selecting Corn Silage Hybrids
Selecting Corn Silage HybridsSelecting Corn Silage Hybrids
Selecting Corn Silage Hybrids
 
Strong Fund Reserves Diminish Need For Venture Capitalists to Raise Additiona...
Strong Fund Reserves Diminish Need For Venture Capitalists to Raise Additiona...Strong Fund Reserves Diminish Need For Venture Capitalists to Raise Additiona...
Strong Fund Reserves Diminish Need For Venture Capitalists to Raise Additiona...
 
2012 Orange County Development Briefing
2012 Orange County Development Briefing2012 Orange County Development Briefing
2012 Orange County Development Briefing
 
Economic Recap Bozeman Chamber of Commerce 2009
Economic Recap Bozeman Chamber of Commerce 2009Economic Recap Bozeman Chamber of Commerce 2009
Economic Recap Bozeman Chamber of Commerce 2009
 
Wgr sw presentation
Wgr sw presentationWgr sw presentation
Wgr sw presentation
 
Roy Fisher Outlook 2012
Roy Fisher Outlook 2012Roy Fisher Outlook 2012
Roy Fisher Outlook 2012
 
Race Breakdown 2009
Race Breakdown 2009Race Breakdown 2009
Race Breakdown 2009
 

Clc week 3

  • 1. •Southeaststatistics on PK-12 enrollment •Southeasttotal budget on PK-12 Public schooling •Teacher credentials by state
  • 2. 2,399,000 2,223,409 2,199,000 1,999,000 1,799,000 1,679,998 1,599,000 1,481,177 2009/2010 1,399,000 1,245,153 enrollment 1,199,000 2010/2011 985,302 999,000 832,076 Enrollment 799,000740,405 679,192 717,185 Variance 599,000 502,454 399,000 282,544 199,000 69,878 -1,000 VA FL GA TN MS NC WV DC SC AL KY MD
  • 3. 25,000,000,000 20,000,000,000 All instructional 15,000,000,000 Materials Expenditures 10,000,000,000 Current Expenditures 5,000,000,000 0 AL FL KY MS SC VA
  • 4. Percentage distribution of public school students enrolled in prekindergarten through 12th grade, by race/ethnicity and state or jurisdiction: 2009 State Total White Black Hispanic Asian Pacific Am. Two or Islander Indian/AK more races Native United 100.0 53.5 15.3 22.7 4.0 0.2 0.8 3.2 States Alabama 100.0 57.8 34.4 4.1 1.0 ‡ 0.5 2.2 DC 100.0 8.4 76.5 12.5 12.8 3.2 - 1.31 FL 100.0 46.7 22.1 25.7 2.3 0.11 0.2 2.5 GA 100.0 47.0 35.7 11.7 2.8 0.11 0.1 2.4 KY 100.0 80.9 10.1 4.3 1.2 ‡ 0.3 3.0 MD 100.0 46.4 35.6 9.7 4.5 ‡ 0.11 3.2 MS 100.0 44.2 50.7 2.4 0.4 ‡ 0.31 1.8 NC 100.0 55.1 26.4 11.4 2.2 # 1.2 3.4 SC 100.0 53.5 36.7 5.8 1.2 ‡ 0.21 2.4 TN 100.0 67.1 22.7 6.0 1.2 0.11 0.1 2.6 VA 100.0 57.3 23.3 9.8 4.9 # 0.3 4.1 WV 100.0 91.6 3.8 1.6 0.6 -- 0.11 2.2 -- Not available # Rounds to zero ‡ Reporting standards not met
  • 5. All states require that certified teachers at a minimum have a Bachelor’s degree. All pre-requisite coursework. All states require that you satisfactorily complete the Basic Skills Test requirement and any Subject Area Competence assessments needed for your desired area of instruction. Alabama Basic Skills Test The APTTP consists of basic skills assessments from the ACT WorkKeys System and subject assessments from the ETS Praxis II: Subject Tests. Subject Area Competence Praxis II: Subject Test in your specialty area Florida Basic Skills Test: FTCE (Florida Teacher Certification Examinations): Florida General Knowledge Test (GK) Subject Area Competence: FTCE (Florida Teacher Certification Examinations): Florida Subject Area Examinations(PEd) Professional Skills Test:F TCE (Florida Teacher Certification Examinations): Florida Professional Education Test Georgia Basic Skills Test Georgia does not require a basic skills test for student teaching or for certification. Subject Area Competence GACE Content and Professional Tests
  • 6. "2009-2010 Public School Expenditures." Schooldata.com. MDR a D&B Company, 2011. Web. 16 Dec. 2011. http://www.schooldata.com/mdrreports.asp#expend. Aud, S., Hussar, W., Kena, G., Bianco, K., Frohlich, L., Kemp, J., Tahan, K. (2011). The Condition of Education 2011 (NCES 2011-033). U.S. Department of Education, National Center for Education Statistics. Washington, DC: U.S. Government Printing Office. Teacher Certification Map | Become a Teacher. Mat@usc, 2009. Web. 16 Dec. 2011. <http://certificationmap.com/. U.S. Census Bureau. 2005. School Enrollment— Social and Economic Characteristics of Students: October 2003, Current Population Report P20-554, Washington, D.C.: U.S. Census Bureau. .

Hinweis der Redaktion

  1. Southeast region by Sharon Hatcher
  2. The southeast covers ¼ of the total U.S. enrollment which is the highest among the five regions. Each state had an increase in enrollment from 2009-2010 school year to 2010-2011 school year except for Mississippi. Among the top ten states as a percentage of total U.S. Enrollment for 2010-2011 Florida in 4th with 4.6%, Georgia in 8th with 3.5%, and North Carolina in 10th with 3.1% increase in enrollment. (Aud, Kena, Bianco, Frohlich, Kemp &amp; Tahan, pg 11-12)
  3. “2008-2009 national current expenditures increased a modest 3% over prior year to a total of $446.6 billion, all instructional material (AIM) spending significantly declined by 6% to a total of $12 billion, about the level of spending in 2006.” (Aud, Kena, Bianco, Frohlich, Kemp &amp; Tahan, pg 29)
  4. “The District of Columbia and Mississippi had the largest enrollment in black students.” (U.S. Census Bureau, 160-161)