National Survey Results - Iran Sanctions
•
1 gefällt mir•218 views

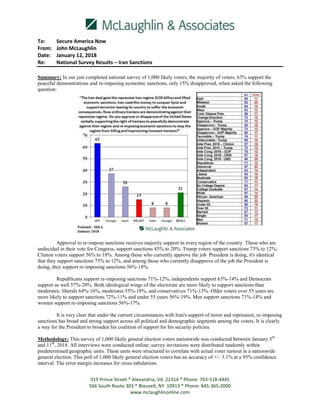
In our just completed national survey of 1,000 likely voters, the majority of voters, 63% support the peaceful demonstrations and re-imposing economic sanctions, only 15% disapproved.

Empfohlen
Empfohlen
Weitere ähnliche Inhalte
Was ist angesagt?
Was ist angesagt? (12)
Ähnlich wie National Survey Results - Iran Sanctions
Ähnlich wie National Survey Results - Iran Sanctions (20)
Kürzlich hochgeladen
Kürzlich hochgeladen (20)
National Survey Results - Iran Sanctions
- 1. 919 Prince Street * Alexandria, VA 22314 * Phone: 703-518-4445 566 South Route 303 * Blauvelt, NY 10913 * Phone: 845-365-2000 www.mclaughlinonline.com To: Secure America Now From: John McLaughlin Date: January 12, 2018 Re: National Survey Results – Iran Sanctions Summary: In our just completed national survey of 1,000 likely voters, the majority of voters, 63% support the peaceful demonstrations and re-imposing economic sanctions, only 15% disapproved, when asked the following question: Approval to re-impose sanctions receives majority support in every region of the country. Those who are undecided in their vote for Congress, support sanctions 45% to 20%. Trump voters support sanctions 73% to 12%; Clinton voters support 56% to 18%. Among those who currently approve the job President is doing, it's identical that they support sanctions 73% to 12%, and among those who currently disapprove of the job the President is doing, they support re-imposing sanctions 56%-18%. Republicans support re-imposing sanctions 71%-12%; independents support 63%-14% and Democrats support as well 57%-20%. Both ideological wings of the electorate are more likely to support sanctions than moderates: liberals 64%-16%, moderates 55%-18%, and conservatives 71%-13%. Older voters over 55 years are more likely to support sanctions 72%-11% and under 55 years 56%-19%. Men support sanctions 71%-14% and women support re-imposing sanctions 56%-17%. It is very clear that under the current circumstances with Iran's support of terror and repression, re-imposing sanctions has broad and strong support across all political and demographic segments among the voters. It is clearly a way for the President to broaden his coalition of support for his security policies. Methodology: This survey of 1,000 likely general election voters nationwide was conducted between January 5th and 11th , 2018. All interviews were conducted online; survey invitations were distributed randomly within predetermined geographic units. These units were structured to correlate with actual voter turnout in a nationwide general election. This poll of 1,000 likely general election voters has an accuracy of +/- 3.1% at a 95% confidence interval. The error margin increases for cross-tabulations.
- 2. 919 Prince Street * Alexandria, VA 22314 * Phone: 703-518-4445 566 South Route 303 * Blauvelt, NY 10913 * Phone: 845-365-2000 www.mclaughlinonline.com Demographics: Party TOTAL Republican 33.0 Democrat 36.0 Independent 31.0 Race TOTAL Hispanic 11.1 African American 12.1 Asian 4.0 White 71.0 Age TOTAL 18 – 29 18.9 30 – 40 18.8 41 – 55 26.5 56 – 65 19.6 Over 65 16.2 Gender TOTAL Male 47.0 Female 53.0