Financial Analysis - Technip SA designs and constructs industrial facilities. The Company designs and builds factories which produce and process petroleum products, natural gas, and chemicals, and generate electricity
•
0 gefällt mir•486 views

Financial Analysis - Technip SA designs and constructs industrial facilities. The Company designs and builds factories which produce and process petroleum products, natural gas, and chemicals, and generate electricity

Empfohlen
Empfohlen
Weitere ähnliche Inhalte
Was ist angesagt?
Was ist angesagt? (19)
Ähnlich wie Financial Analysis - Technip SA designs and constructs industrial facilities. The Company designs and builds factories which produce and process petroleum products, natural gas, and chemicals, and generate electricity
Ähnlich wie Financial Analysis - Technip SA designs and constructs industrial facilities. The Company designs and builds factories which produce and process petroleum products, natural gas, and chemicals, and generate electricity (20)
Mehr von BCV
Mehr von BCV (20)
Kürzlich hochgeladen
Kürzlich hochgeladen (20)
Financial Analysis - Technip SA designs and constructs industrial facilities. The Company designs and builds factories which produce and process petroleum products, natural gas, and chemicals, and generate electricity
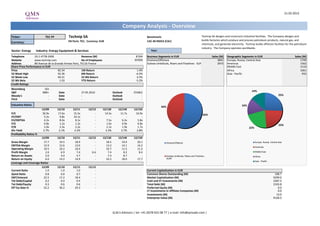
- 1. 21.02.2013 Company Analysis - Overview Ticker: TEC FP Technip SA Benchmark: Technip SA designs and constructs industrial facilities. The Company designs and EN Paris: TEC, Currency: EUR CAC 40 INDEX (CAC) builds factories which produce and process petroleum products, natural gas, and Currency: chemicals, and generate electricity. Technip builds offshore facilities for the petroleum industry. The Company operates worldwide. Sector: Energy Industry: Energy Equipment & Services Year: Telephone 33-1-4778-2400 Revenue (M) 8'204 Business Segments in EUR Sales (M) Geographic Segments in EUR Sales (M) Website www.technip.com No of Employees 30'000 Onshore/Offshore 3841 Europe, Russia, Central Asia 1749 Address 89 Avenue de la Grande Armee Paris, 75116 France Subsea Umbilicals, Risers and Flowlines - SURF 2972 Americas 1562 Share Price Performance in EUR Middle East 1510 Price 82.34 1M Return 1.4% Africa 1061 52 Week High 92.36 6M Return -6.5% Asia - Pacific 932 52 Week Low 69.21 52 Wk Return 4.3% 52 Wk Beta 1.03 YTD Return -5.2% Credit Ratings Bloomberg IG5 S&P BBB+ Date 27.05.2010 Outlook STABLE 14% Moody's - Date - Outlook - 25% Fitch - Date - Outlook - Valuation Ratios 16% 44% 12/09 12/10 12/11 12/12 12/13E 12/14E 12/15E P/E 30.9x 17.6x 15.5x - 14.5x 11.7x 10.9x 56% EV/EBIT 5.2x 9.8x 10.1x - - - - EV/EBITDA 4.2x 8.0x 8.1x - 7.5x 6.2x 5.8x P/S 0.8x 1.2x 1.2x - 1.0x 0.9x 0.8x 23% P/B 2.0x 2.3x 2.2x - 2.1x 1.9x 1.7x 22% Div Yield 2.7% 2.1% 2.2% - 2.3% 2.7% 2.8% Profitability Ratios % 12/09 12/10 12/11 12/12 12/13E 12/14E 12/15E Gross Margin 17.7 19.5 18.9 - 18.5 19.4 20.1 Onshore/Offshore Europe, Russia, Central Asia EBITDA Margin 12.9 12.6 13.0 - 13.2 14.1 14.2 Americas Operating Margin 10.5 10.2 10.4 - 10.7 11.5 11.2 Profit Margin 2.6 6.9 7.4 6.6 7.4 8.2 8.4 Middle East Return on Assets 2.0 4.4 4.7 - 7.3 8.7 - Subsea Umbilicals, Risers and Flowlines - Africa Return on Equity 6.6 14.2 14.9 - 16.5 18.0 17.7 SURF Asia - Pacific Leverage and Coverage Ratios 12/09 12/10 12/11 12/12 Current Ratio 1.0 1.0 1.0 - Current Capitalization in EUR Quick Ratio 0.8 0.8 0.7 - Common Shares Outstanding (M) 108.7 EBIT/Interest 22.5 17.2 18.4 - Market Capitalization (M) 9299.0 Tot Debt/Capital 0.2 0.4 0.4 - Cash and ST Investments (M) 2287.3 Tot Debt/Equity 0.3 0.6 0.6 - Total Debt (M) 2103.8 Eff Tax Rate % 52.2 30.2 29.3 - Preferred Equity (M) 0.0 LT Investments in Affiliate Companies (M) 0.0 Investments (M) 13.0 Enterprise Value (M) 9128.5 Q.M.S Advisors | tel: +41 (0)78 922 08 77 | e-mail: info@qmsadv.com |
- 2. Company Analysis - Analysts Ratings Technip SA Target price in EUR Broker Recommendation Buy and Sell Recommendations vs Price and Target Price Price Brokers' Target Price 120 140 100% 12% 8% 8% 8% 12% 15% 15% 15% 15% 14% 14% 13% 120 100 80% 27% 31% 22% 23% 100 23% 38% 38% 35% 27% 23% 25% 25% 80 80 60% 60 60 40% 40 63% 63% 40 62% 62% 62% 58% 62% 61% 61% 54% 54% 54% 20 20% 20 0 Day by Day Morgan Stanley Genuity Corp Barclays Raymond Main First Bank S&P Capital IQ CA Cheuvreux DNB Markets Natixis Securities(ESN) Fox-Davies Liberum Capital Kepler Capital RBC Capital JPMorgan Macquarie Oddo & Cie RS Platou ABN Amro Bank Exane BNP Generale HSBC Nomura AlphaValue Dimensions Goldman Sachs Societe Markets Canaccord James Paribas Capital Markets Markets CM - CIC 0% 0 EVA N.V. AG Ltd févr.12 mars.12 avr.12 mai.12 juin.12 juil.12 août.12 sept.12 oct.12 nov.12 déc.12 janv.13 Buy Hold Sell Price Target Price Date Buy Hold Sell Date Price Target Price Broker Analyst Recommendation Target Date 31-Jan-13 63% 23% 13% 21-Feb-13 82.34 99.74 Societe Generale GUILLAUME DELABY buy 107.00 21-Feb-13 31-Dec-12 61% 25% 14% 20-Feb-13 78.95 99.95 Goldman Sachs HENRY TARR neutral/neutral 94.00 21-Feb-13 30-Nov-12 61% 25% 14% 19-Feb-13 80.00 99.95 RBC Capital Markets KATHERINE TONKS outperform 105.00 21-Feb-13 31-Oct-12 63% 22% 15% 18-Feb-13 79.68 99.95 JPMorgan ANDREW DOBBING overweight 114.00 21-Feb-13 28-Sep-12 62% 23% 15% 15-Feb-13 80.02 99.95 HSBC PHILLIP LINDSAY overweight 106.00 21-Feb-13 31-Aug-12 58% 27% 15% 14-Feb-13 78.45 99.95 CM - CIC Securities(ESN) JEAN-LUC ROMAIN buy 98.00 21-Feb-13 31-Jul-12 54% 35% 12% 13-Feb-13 78.89 99.95 Oddo & Cie JEAN-FRANCOIS GRANJON buy 93.00 21-Feb-13 29-Jun-12 54% 38% 8% 12-Feb-13 78.14 99.45 Canaccord Genuity Corp JAMES EVANS buy 107.00 21-Feb-13 31-May-12 54% 38% 8% 11-Feb-13 78.38 98.74 Main First Bank AG BERND POMREHN outperform 100.00 21-Feb-13 30-Apr-12 62% 23% 15% 8-Feb-13 79.99 97.80 AlphaValue GAETAN DUPONT reduce 80.40 21-Feb-13 30-Mar-12 62% 31% 8% 7-Feb-13 80.20 97.37 ABN Amro Bank N.V. MARK VAN DER GEEST hold 83.00 21-Feb-13 29-Feb-12 62% 27% 12% 6-Feb-13 81.00 97.50 Exane BNP Paribas ALEXANDRE MARIE neutral 92.00 19-Feb-13 5-Feb-13 81.25 97.50 CA Cheuvreux GEOFFROY STERN outperform 90.00 15-Feb-13 4-Feb-13 80.80 97.50 DNB Markets EIRIK RONOLD MATHISEN buy 105.00 12-Feb-13 1-Feb-13 81.00 97.50 Natixis ANNE PUMIR buy 95.00 7-Feb-13 31-Jan-13 79.86 97.72 Nomura CHRISTYAN MALEK neutral 90.00 29-Jan-13 30-Jan-13 77.47 97.72 S&P Capital IQ CHRISTINE TISCARENO buy 96.00 29-Jan-13 29-Jan-13 83.37 97.72 Macquarie DAVID FARRELL outperform 94.00 25-Jan-13 28-Jan-13 83.57 99.21 Barclays MICK PICKUP overweight 116.00 25-Jan-13 25-Jan-13 84.82 98.25 Day by Day VALERIE GASTALDY hold 24-Jan-13 24-Jan-13 83.30 97.62 Morgan Stanley ROBERT PULLEYN Overwt/Attractive 121.00 18-Jan-13 23-Jan-13 82.89 97.78 EVA Dimensions CRAIG STERLING sell 17-Jan-13 22-Jan-13 81.28 97.78 RS Platou Markets GORAN ANDREASSEN buy 95.00 15-Jan-13 21-Jan-13 81.20 97.78 Raymond James BERTRAND HODEE underperform 80.00 8-Nov-12 18-Jan-13 81.70 97.78 Liberum Capital Ltd ANDREW WHITTOCK hold 78.70 26-Oct-12 17-Jan-13 82.09 98.40 Kepler Capital Markets TEAM COVERAGE buy 101.00 27-Apr-12 16-Jan-13 82.77 98.40 Fox-Davies Capital PAUL SINGER hold 2-Aug-11 15-Jan-13 82.17 98.40 14-Jan-13 80.76 98.40 11-Jan-13 80.24 98.68 Q.M.S Advisors | tel: +41 (0)78 922 08 77 | e-mail: info@qmsadv.com |
- 3. 21.02.2013 Technip SA Company Analysis - Ownership Ownership Type Ownership Statistics Geographic Ownership Distribution Geographic Ownership 0% Shares Outstanding (M) 108.7 United States 44.22% Float 88.8% France 33.72% 3% 1% 4% 4% Short Interest (M) Luxembourg 5.33% Short Interest as % of Float 39% Britain 5.23% 5% Days to Cover Shorts Norway 3.80% 44% 5% Institutional Ownership 60.99% Switzerland 2.55% Retail Ownership 38.96% 61% Germany 1.17% Insider Ownership 0.05% Others 3.99% Institutional Ownership Distribution 34% Investment Advisor 71.03% Government 11.91% Mutual Fund Manager 10.93% Institutional Ownership Retail Ownership Insider Ownership Corporation 5.44% United States France Luxembourg Britain Pricing data is in EUR Others 0.69% Norway Switzerland Germany Others Top 20 Owners: TOP 20 ALL Institutional Ownership Holder Name Position Position Change Market Value % of Ownership Report Date Source Country CAPITAL GROUP COMPAN 10'888'250 -1'555'250 896'538'505 9.64% 31.12.2012 ULT-AGG UNITED STATES 5% 1% BLACKROCK 8'753'684 379'586 720'778'341 7.75% 20.02.2013 ULT-AGG UNITED STATES CAISSE DES DEPOTS ET 5'929'398 0 488'226'631 5.25% 31.12.2011 Co File FRANCE 11% AMUNDI 4'146'278 601'110 341'404'531 3.67% 15.05.2012 Research FRANCE BNP PARIBAS INV PART 3'942'407 -160'916 324'617'792 3.49% 30.11.2012 ULT-AGG FRANCE NATIXIS 3'361'789 0 276'809'706 2.98% 31.12.2011 Co File FRANCE OPPENHEIMERFUNDS INC 3'219'635 0 265'104'746 2.85% 31.12.2011 Co File UNITED STATES 12% IFP ENERGIES NOUVELL 2'830'917 0 233'097'706 2.51% 31.12.2011 Co File FRANCE 71% NORGES BANK INVESTME 2'750'873 0 226'506'883 2.44% 31.12.2011 Co File NORWAY VANGUARD GROUP INC 2'152'163 139'045 177'209'101 1.91% 31.12.2012 MF-AGG UNITED STATES NATIXIS ASSET MANAGE 1'816'844 -203'806 149'598'935 1.61% 31.12.2012 MF-AGG FRANCE AXA INVESTMENT MANAG 1'673'439 0 137'790'967 1.48% 31.12.2011 Co File BRITAIN CAUSEWAY CAPITAL MAN 1'596'029 0 131'417'028 1.41% 31.12.2011 Co File UNITED STATES CREDIT SUISSE 1'326'090 0 109'190'251 1.17% 31.12.2011 Co File SWITZERLAND Investment Advisor Government Mutual Fund Manager Corporation Others ALLIANZ ASSET MANAGE 1'309'685 -6'160 107'839'463 1.16% 31.01.2013 ULT-AGG GERMANY T ROWE PRICE ASSOCIA 1'259'670 0 103'721'228 1.12% 31.12.2011 Co File UNITED STATES ALLIANCE BERNSTEIN 1'190'548 0 98'029'722 1.05% 31.12.2011 ULT-AGG UNITED STATES GRYPHON 1'132'066 0 93'214'314 1.00% 31.12.2011 Co File UNITED STATES WILLIAM BLAIR & COMP 950'406 158'316 78'256'430 0.84% 31.12.2012 13F UNITED STATES FMR LLC 757'901 -53'277 62'405'568 0.67% 31.12.2012 ULT-AGG UNITED STATES Top 5 Insiders: Holder Name Position Position Change Market Value % of Ownership Report Date Source PILENKO THIERRY 44'900 3'697'066 0.04% 29.02.2012 Co File HAUSER GERARD 1'700 139'978 0.00% 29.02.2012 Co File APPERT OLIVIER 904 74'435 0.00% 29.02.2012 Co File O'LEARY JOHN C G 800 65'872 0.00% 29.02.2012 Co File COLOMBANI PASCAL 400 32'936 0.00% 29.02.2012 Co File Q.M.S Advisors | tel: +41 (0)78 922 08 77 | e-mail: info@qmsadv.com |
- 4. Company Analysis - Financials I/IV Technip SA Financial information is in EUR (M) Equivalent Estimates Periodicity: Fiscal Year 12/02 12/03 12/04 12/05 12/06 12/07 12/08 12/09 12/10 12/11 12/12 12/13E 12/14E 12/15E Income Statement Revenue 4'452 4'711 5'141 5'376 6'927 7'887 7'481 6'456 6'082 6'813 8'204 9'246 10'416 11'054 - Cost of Goods Sold 6'202 7'245 6'342 5'314 4'897 5'526 Gross Income 724 641 1'140 1'142 1'185 1'287 1'707 2'024 2'222 - Selling, General & Admin Expenses 4'366 4'597 4'907 5'145 364 374 483 465 565 577 (Research & Dev Costs) 37 33 30 29 35 42 45 54 57 65 Operating Income 87 114 234 231 360 267 657 677 620 710 990 1'199 1'234 - Interest Expense 16 12 18 30 30 42 38 30 36 39 - Foreign Exchange Losses (Gains) 13 3 7 10 6 21 -21 35 -9 -33 - Net Non-Operating Losses (Gains) 45 36 40 48 28 -1 -8 238 -1 -8 Pretax Income 13 63 168 144 296 205 648 373 595 711 974 1'206 1'318 - Income Tax Expense 46 82 54 44 94 77 194 195 179 209 Income Before XO Items -33 -19 114 100 202 128 454 179 415 503 - Extraordinary Loss Net of Tax 0 0 0 5 0 0 0 0 0 0 0 - Minority Interests -4 1 2 2 2 2 6 8 -2 -5 Diluted EPS Before XO Items 0.28 1.00 1.88 1.20 4.25 1.59 3.81 4.41 Net Income Adjusted* -29 -20 112 98 200 136 448 356 418 519 547 686 851 929 EPS Adjusted (0.27) (0.21) 1.18 0.98 1.88 1.32 4.30 3.30 3.81 4.70 4.47 5.70 7.02 7.56 Dividends Per Share 1.24 1.24 0.83 0.92 1.05 1.20 1.20 1.35 1.45 1.58 1.91 2.22 2.33 Payout Ratio % 71.1 92.5 55.7 102.0 28.5 84.4 38.3 33.9 0.33 0.32 0.31 Total Shares Outstanding 93 94 95 97 105 104 106 106 107 109 Diluted Shares Outstanding 114 117 116 115 106 105 105 107 110 117 122 EBITDA 348 346 369 374 520 430 808 831 766 884 1'224 1'468 1'566 *Net income excludes extraordinary gains and losses and one-time charges. Q.M.S Advisors | tel: +41 (0)78 922 08 77 | e-mail: info@qmsadv.com |
- 5. Company Analysis - Financials II/IV Periodicity: 12/02 12/03 12/04 12/05 12/06 12/07 12/08 12/09 12/10 12/11 12/12 12/13E 12/14E 12/15E Balance Sheet Total Current Assets 7084.6001 8762.09961 3079.9 3919.6 4645.7 4635.5 4542.8 4660.2 5751.4 5808.5 + Cash & Near Cash Items 642 782 695 1'566 612 586 477 516 779 919 + Short Term Investments 96 110 739 622 1'791 1'816 1'927 2'141 2'327 1'890 + Accounts & Notes Receivable 726 756 349 440 584 783 1'124 1'061 1'277 1'280 + Inventories 81 74 87 101 134 174 226 215 222 255 + Other Current Assets 5'540 7'041 1'210 1'191 1'525 1'277 788 727 1'148 1'465 Total Long-Term Assets 3'518 3'246 3'338 3'377 3'418 3'464 3'589 3'910 4'471 5'624 + Long Term Investments 12 6 3 12 17 38 27 34 26 30 Gross Fixed Assets 1'604 1'499 1'471 1'592 1'690 1'844 1'936 2'414 2'777 3'843 Accumulated Depreciation 743 761 735 821 932 1'026 991 1'220 1'305 1'534 + Net Fixed Assets 861 739 737 771 758 818 945 1'195 1'472 2'308 + Other Long Term Assets 2'645 2'502 2'598 2'595 2'643 2'608 2'617 2'681 2'972 3'285 Total Current Liabilities 7'198 8'749 2'905 3'817 4'666 4'965 4'656 4'783 5'673 5'811 + Accounts Payable 721 783 853 978 1'658 1'866 1'704 1'476 1'862 2'135 + Short Term Borrowings 301 226 192 214 186 44 26 28 681 544 + Other Short Term Liabilities 6'176 7'740 1'861 2'625 2'822 3'055 2'926 3'279 3'130 3'132 Total Long Term Liabilities 1'365 1'312 1'651 1'512 981 937 980 1'070 1'347 1'948 + Long Term Borrowings 946 903 1'409 1'305 677 653 734 845 1'092 1'544 + Other Long Term Borrowings 419 409 242 207 304 284 246 225 255 404 Total Liabilities 8'563 10'061 4'556 5'329 5'647 5'903 5'636 5'853 7'020 7'759 + Long Preferred Equity 0 0 0 0 0 0 0 0 0 0 + Minority Interest 16 9 10 14 16 18 22 30 22 22 + Share Capital & APIC 1'322 1'372 1'349 1'412 1'685 1'722 1'793 1'794 1'834 1'976 + Retained Earnings & Other Equity 701 566 503 542 716 457 680 893 1'346 1'676 Total Shareholders Equity 2'039 1'947 1'861 1'968 2'417 2'197 2'496 2'717 3'202 3'673 Total Liabilities & Equity 10'603 12'008 6'418 7'297 8'063 8'099 8'132 8'570 10'222 11'432 Book Value Per Share 21.65 20.53 19.47 20.08 22.92 20.89 23.28 25.28 29.62 33.58 38.38 43.55 48.76 Tangible Book Value Per Share -6.58 -5.92 -6.53 -5.12 -0.21 -2.31 0.60 2.62 6.94 8.62 Q.M.S Advisors | tel: +41 (0)78 922 08 77 | e-mail: info@qmsadv.com |
- 6. Company Analysis - Financials III/IV Periodicity: 12/02 12/03 12/04 12/05 12/06 12/07 12/08 12/09 12/10 12/11 12/12 12/13E 12/14E 12/15E Cash Flows Net Income -29 -20 112 93 200 126 448 170 418 507 692 867 975 + Depreciation & Amortization 261 232 135 143 160 163 151 154 146 174 + Other Non-Cash Adjustments 9 17 61 39 -8 -97 83 48 -24 101 + Changes in Non-Cash Capital 193 119 90 618 594 634 -227 262 -501 -131 Cash From Operating Activities 433 349 398 894 947 826 455 634 38 652 + Disposal of Fixed Assets 112 105 6 19 40 1 3 1 2 3 + Capital Expenditures -124 -122 -119 -167 -151 -250 -389 -413 -361 -339 -453 -449 -414 + Increase in Investments -0 -3 -1 -0 -0 -115 -13 + Decrease in Investments 31 2 17 3 20 2 2 20 1 + Other Investing Activities 0 30 -33 2 -9 55 -27 -19 -54 -609 Cash From Investing Activities 19 11 -128 -145 -120 -174 -411 -429 -508 -958 + Dividends Paid -80 -77 -130 -32 -142 -275 -125 -128 -144 -156 + Change in Short Term Borrowings -161 -65 0 0 + Increase in Long Term Borrowings 795 77 673 51 76 22 128 110 969 888 + Decrease in Long Term Borrowings -952 -97 -242 -141 -82 -198 -49 -26 -74 -755 + Increase in Capital Stocks 12 0 26 64 30 37 72 1 40 35 + Decrease in Capital Stocks 0 0 -23 -20 -368 -86 -2 + Other Financing Activities -88 -45 -9 83 -126 -152 -69 92 131 -3 Cash From Financing Activities -474 -208 296 5 -612 -653 -43 50 920 9 Net Changes in Cash -22 151 566 754 215 -1 0 255 451 -297 Free Cash Flow (CFO-CAPEX) 308 226 279 727 796 575 66 221 -323 312 392 606 788 Free Cash Flow To Firm 268 223 292 747 816 601 92 235 -298 340 Free Cash Flow To Equity 102 245 716 656 830 400 147 306 574 448 Free Cash Flow per Share 2.88 2.41 2.96 7.59 7.54 5.54 0.62 2.08 -3.03 2.89 Q.M.S Advisors | tel: +41 (0)78 922 08 77 | e-mail: info@qmsadv.com |
- 7. Company Analysis - Financials IV/IV Periodicity: 12/02 12/03 12/04 12/05 12/06 12/07 12/08 12/09 12/10 12/11 12/12 12/13E 12/14E 12/15E Ratio Analysis Valuation Ratios Price Earnings 115.3x 49.2x 27.4x 44.7x 5.1x 30.9x 17.6x 15.5x 14.5x 11.7x 10.9x EV to EBIT 24.4x 19.9x 14.6x 18.6x 10.9x 15.0x 1.1x 5.2x 9.8x 10.1x EV to EBITDA 6.1x 6.6x 9.2x 11.5x 7.5x 9.3x 0.9x 4.2x 8.0x 8.1x 7.5x 6.2x 5.8x Price to Sales 0.4x 0.4x 0.6x 0.9x 0.8x 0.7x 0.3x 0.8x 1.2x 1.2x 1.0x 0.9x 0.8x Price to Book 0.8x 1.0x 1.7x 2.5x 2.3x 2.6x 0.9x 2.0x 2.3x 2.2x 2.1x 1.9x 1.7x Dividend Yield 7.3% 5.8% 2.4% 1.8% 2.0% 2.2% 5.5% 2.7% 2.1% 2.2% 2.3% 2.7% 2.8% Profitability Ratios Gross Margin 10.5% 8.1% 15.2% 17.7% 19.5% 18.9% 18.5% 19.4% 20.1% EBITDA Margin 7.8% 7.3% 7.2% 7.0% 7.5% 5.5% 10.8% 12.9% 12.6% 13.0% 13.2% 14.1% 14.2% Operating Margin 1.9% 2.4% 4.5% 4.3% 5.2% 3.4% 8.8% 10.5% 10.2% 10.4% 10.7% 11.5% 11.2% Profit Margin -0.7% -0.4% 2.2% 1.7% 2.9% 1.6% 6.0% 2.6% 6.9% 7.4% 6.6% 7.4% 8.2% 8.4% Return on Assets -0.3% -0.2% 1.2% 1.4% 2.6% 1.6% 5.5% 2.0% 4.4% 4.7% 7.3% 8.7% Return on Equity -1.4% -1.0% 5.9% 4.9% 9.2% 5.5% 19.3% 6.6% 14.2% 14.9% 16.5% 18.0% 17.7% Leverage & Coverage Ratios Current Ratio 0.98 1.00 1.06 1.03 1.00 0.93 0.98 0.97 1.01 1.00 Quick Ratio 0.20 0.19 0.61 0.69 0.64 0.64 0.76 0.78 0.77 0.70 Interest Coverage Ratio (EBIT/I) 5.46 9.82 12.70 7.67 11.96 6.44 17.42 22.48 17.18 18.38 Tot Debt/Capital 0.38 0.37 0.46 0.44 0.26 0.24 0.23 0.24 0.36 0.36 Tot Debt/Equity 0.61 0.58 0.86 0.77 0.36 0.32 0.30 0.32 0.55 0.57 Others Asset Turnover 0.39 0.42 0.56 0.78 0.90 0.98 0.92 0.77 0.65 0.63 Accounts Receivable Turnover 6.69 6.36 9.31 13.63 13.53 11.54 7.85 5.91 5.20 5.33 Accounts Payable Turnover 4.73 4.13 3.58 3.34 2.94 2.78 Inventory Turnover 52.69 47.03 31.72 24.07 22.42 23.22 Effective Tax Rate 356.2% 130.0% 32.2% 30.3% 31.8% 37.6% 29.9% 52.2% 30.2% 29.3% Q.M.S Advisors | tel: +41 (0)78 922 08 77 | e-mail: info@qmsadv.com |
- 8. Company Analysis - Peers Comparision AKER SOLUTIONS SBM OFFSHORE SCHLUMBERGER WOOD GROUP TECHNIP SA CIE GENERALE DE SUBSEA 7 SA SAIPEM SPA HALLIBURTON CO HELIX ENERGY SOL PETROFAC LTD AMEC PLC PETROLEUM GEO SEADRILL LTD A NV LTD (JOHN Latest Fiscal Year: 12/2012 12/2011 12/2011 12/2012 12/2012 12/2012 12/2012 12/2012 12/2011 12/2012 12/2011 12/2012 12/2012 12/2011 52-Week High 92.36 25.76 148.39 40.12 43.96 124.60 16.41 82.00 883.50 25.49 1'784.00 1'189.00 104.50 246.90 52-Week High Date 22.10.2012 09.10.2012 02.04.2012 17.09.2012 14.02.2013 25.01.2013 08.03.2012 14.02.2013 19.10.2012 14.02.2013 20.04.2012 14.03.2012 02.11.2012 21.08.2012 52-Week Low 69.21 15.58 106.91 18.61 26.28 72.20 7.73 59.12 649.00 14.90 1'324.00 914.00 64.30 188.50 52-Week Low Date 04.06.2012 04.06.2012 25.06.2012 30.01.2013 26.06.2012 26.06.2012 20.11.2012 26.06.2012 26.06.2012 26.06.2012 27.06.2012 01.06.2012 26.06.2012 04.06.2012 Daily Volume 1'210'954 1'059'002 1'447'616 2'231'494 8'851'289 757'884 2'558'627 6'397'047 573'571 1'476'885 1'356'007 1'428'656 2'068'517 1'408'521 Current Price (2/dd/yy) 82.34 20.29 132.90 20.40 40.47 108.30 10.35 78.53 793.50 23.00 1'572.00 1'032.00 94.20 207.10 52-Week High % Change -10.8% -21.2% -10.4% -49.2% -7.9% -13.1% -36.9% -4.2% -10.2% -9.8% -11.9% -13.2% -9.9% -16.1% 52-Week Low % Change 19.0% 30.3% 24.3% 9.6% 54.0% 50.0% 33.9% 32.8% 22.3% 54.4% 18.7% 12.9% 46.5% 9.9% Total Common Shares (M) 108.7 159.2 338.7 441.4 929.0 270.5 189.1 1'328.0 371.3 105.3 340.1 300.7 217.8 467.8 Market Capitalization 9'299.0 3'579.0 46'753.4 9'005.6 37'555.6 29'674.2 1'957.6 104'307.9 2'961.1 2'422.8 5'437.4 3'065.7 20'516.8 97'181.9 Total Debt 2'087.9 1'501.0 893.4 4'278.0 4'820.0 7'691.0 2'531.0 11'630.0 230.5 1'019.2 77.2 176.0 916.8 10'428.0 Preferred Stock - - - - - - - - - - - - - - Minority Interest 21.7 67.5 51.5 148.0 25.0 157.0 71.3 107.0 10.0 - 3.1 4.0 0.0 325.0 Cash and Equivalents 2'808.7 410.7 803.4 1'029.0 2'484.0 1'214.0 748.3 6'274.0 226.6 437.1 1'602.0 275.0 393.3 507.0 Enterprise Value 9'128.5 4'941.2 8'621.6 13'532.6 39'916.6 36'308.2 4'438.5 109'770.9 4'633.1 3'004.9 7'520.7 2'970.7 4'149.6 28'129.4 Valuation Total Revenue LFY 8'203.9 2'267.7 5'476.5 13'369.0 28'503.0 44'922.0 3'695.2 42'149.0 5'666.8 846.1 5'800.7 4'158.0 1'518.3 4'191.0 LTM 8'203.9 2'594.7 6'103.3 13'369.0 28'503.0 44'922.0 3'695.2 42'841.0 6'547.2 1'293.3 6'331.4 4'158.0 1'518.3 4'208.0 CY+1 9'246.1 2'720.7 6'243.0 13'566.9 29'769.0 49'190.0 4'005.2 46'176.7 6'838.8 1'074.3 6'437.8 4'256.4 1'754.0 4'385.8 CY+2 10'416.4 3'559.7 6'756.9 14'063.2 32'970.3 54'738.2 4'028.9 51'872.0 7'292.4 1'223.5 6'765.6 4'538.8 1'992.6 5'040.5 EV/Total Revenue LFY 1.2x 2.2x 1.5x 1.6x 1.2x 0.8x 1.2x 2.3x 0.7x 3.3x 1.2x 0.7x 2.8x 7.0x LTM 1.2x 1.9x 1.4x 1.6x 1.2x 0.8x 1.2x 2.3x 0.6x 2.1x 1.1x 0.7x 2.8x 7.0x CY+1 0.9x 1.8x 1.4x 1.0x 1.3x 0.7x 1.2x 2.3x 0.7x - 1.2x 0.7x 2.4x 6.4x CY+2 0.8x 1.4x 1.2x 0.9x 1.2x 0.6x 1.2x 2.0x 0.6x - 1.2x 0.6x 2.1x 5.9x EBITDA LFY 883.5 596.1 870.8 2'207.0 5'787.0 4'739.0 - 11'020.0 396.0 52.7 764.0 363.0 777.3 2'315.0 LTM 1'012.6 753.5 1'050.1 2'186.0 5'787.0 4'701.0 - 11'055.0 460.5 361.5 888.8 363.0 777.3 2'382.0 CY+1 1'224.1 844.1 1'137.7 1'540.5 6'184.6 5'332.1 873.1 12'404.7 511.3 391.5 924.7 368.8 1'000.8 2'441.5 CY+2 1'467.8 1'200.4 1'274.6 1'973.7 7'544.0 6'490.9 929.0 14'531.9 596.0 468.5 1'088.9 410.8 1'149.4 2'903.3 EV/EBITDA LFY 10.9x 8.5x 9.7x 9.5x 6.0x 7.8x - 8.8x 10.4x 52.3x 8.8x 8.0x 5.5x 12.6x LTM 9.5x 6.7x 8.1x 9.4x 6.0x 7.9x - 8.8x 8.9x 7.6x 7.6x 8.0x 5.5x 12.3x CY+1 7.1x 5.8x 7.5x 8.6x 6.4x 6.6x 5.3x 8.7x 9.0x - 8.4x 7.8x 4.2x 11.5x CY+2 5.5x 4.0x 6.6x 6.3x 5.1x 5.3x 5.0x 7.1x 7.4x - 7.2x 6.9x 3.6x 10.3x EPS LFY 0.00 -0.21 1.26 2.04 3.02 8.30 - 4.16 0.40 0.49 1.57 0.82 0.15 - LTM 4.59 0.40 2.14 2.05 3.08 8.25 -0.46 4.19 0.33 1.57 1.82 0.67 0.86 2.18 CY+1 5.70 0.74 1.65 1.00 3.02 9.69 2.17 4.74 0.84 1.46 1.85 0.88 1.56 2.67 CY+2 7.02 1.73 1.62 1.65 3.96 12.77 2.46 5.83 1.00 1.86 2.08 0.98 2.00 3.22 P/E LFY 17.9x 51.8x 11.0x 9.9x 13.1x 13.1x - 18.7x 36.3x 14.6x 13.2x 15.4x 19.4x 16.8x LTM 25.1x 51.8x 11.0x - 13.1x 13.2x - 18.7x 24.3x 14.6x 13.3x 12.6x - - CY+1 14.5x 27.1x 14.3x 20.3x 13.4x 11.2x 6.3x 16.6x 14.4x 15.7x 12.9x 11.8x 10.7x 13.7x CY+2 11.7x 11.6x 14.5x 12.3x 10.2x 8.5x 5.6x 13.5x 12.1x 12.4x 11.5x 10.5x 8.3x 11.4x Revenue Growth 1 Year 20.4% 3.7% 131.2% 6.2% 14.8% 25.9% 17.1% 14.0% 38.7% (39.5%) 33.2% 27.5% 21.1% 4.4% 5 Year 3.4% 3.1% 35.4% 8.3% 14.5% 3.1% 6.7% 14.7% 11.5% (1.8%) 26.2% 12.5% 11.0% 29.1% EBITDA Growth 1 Year - 2.5% 81.8% 5.0% (5.1%) 36.8% - 12.5% 39.0% (92.2%) 19.8% 29.2% 44.2% 11.4% 5 Year 11.2% 5.1% 23.6% 14.0% 7.5% 3.9% - 5.5% 7.3% (40.3%) 30.8% 22.7% (0.8%) 42.5% EBITDA Margin LTM 12.8% 29.0% 17.2% 16.4% 20.3% 10.5% - 25.8% 7.0% 28.0% 14.0% 8.7% 51.2% 56.6% CY+1 13.2% 31.0% 18.2% 11.4% 20.8% 10.8% 21.8% 26.9% 7.5% 36.4% 14.4% 8.7% 57.1% 55.7% CY+2 14.1% 33.7% 18.9% 14.0% 22.9% 11.9% 23.1% 28.0% 8.2% 38.3% 16.1% 9.1% 57.7% 57.6% Leverage/Coverage Ratios Total Debt / Equity % 57.2% 51.1% 15.5% 79.1% 30.6% 65.1% 172.3% 33.5% 11.7% 71.8% 6.9% 16.3% 47.7% 174.5% FALSE Total Debt / Capital % 36.2% 33.3% 13.3% 43.5% 23.4% 39.1% 62.2% 25.0% 10.5% 41.8% 6.5% 14.0% 32.3% 62.3% FALSE Total Debt / EBITDA 2.078x 2.044x 0.861x 1.957x 0.833x 1.636x - 1.052x 0.624x 2.819x 0.075x 0.485x 1.180x 4.730x FALSE Net Debt / EBITDA -0.181x 1.699x 0.303x 1.957x 0.404x 1.378x - 0.484x 0.233x 1.610x -0.872x -0.273x 0.674x 4.410x FALSE EBITDA / Int. Expense 22.889x 4.716x 21.554x 18.112x 19.419x 10.132x - 32.412x 28.905x 0.800x 115.768x 45.375x 20.569x 7.847x FALSE Credit Ratings S&P LT Credit Rating BBB+ BB- - - A - - A+ - B+ - - BB - FALSE S&P LT Credit Rating Date 27.05.2010 29.11.2012 - - 20.08.2007 - - 11.12.2002 - 19.09.2011 - - 02.12.2010 - FALSE Moody's LT Credit Rating - Ba3 *- - - A2 - - A1 - B3 - - Ba2 - FALSE Moody's LT Credit Rating Date - 25.09.2012 - - 01.05.2007 - - 03.06.2003 - 05.08.2009 - - 16.11.2011 - FALSE Q.M.S Advisors | tel: +41 (0)78 922 08 77 | e-mail: info@qmsadv.com |