SlideShare ist ein Scribd-Unternehmen logo
1 von 8
Downloaden Sie, um offline zu lesen
04.03.2013


                                                                                         Company Analysis - Overview
Ticker:                    lnkd un           LinkedIn Corp                                                 Benchmark:                                      LinkedIn Corporation operates a social networking website used for professional
                                             New York: LNKD, Currency: USD                                 S&P 500 INDEX (SPX)                             networking. The Company's website allows members to post a profile of their
Currency:
                                                                                                                                                           professional expertise and accomplishments. LinkedIn allows members to be
                                                                                                                                                           introduced to potential clients, service providers, and subject experts.
Sector: Information Technology        Industry: Internet Software & Services                                  Year:
Telephone         1-650-687-3600                        Revenue (M)                                  972   Business Segments in USD                                Sales (M)   Geographic Segments in USD                              Sales (M)
Website           www.linkedin.com                      No of Employees                            3'458   Hiring Solutions                                              524   United States                                                 619
Address           2029 Stierlin Court Mountain View, CA 94043 United States                                Marketing Solutions                                           258   EMEA                                                          217
Share Price Performance in USD                                                                             Premium Subscriptions                                         190   APAC                                                           69
Price                               173.39              1M Return                                 40.6%                                                                        Other Americas                                                 66
52 Week High                        173.78              6M Return                                 61.5%                                                                        All Other Countries
52 Week Low                           84.10             52 Wk Return                              98.2%
52 Wk Beta                             1.33             YTD Return                                51.0%
Credit Ratings
Bloomberg                  IG4                                                                                                                                                                            7%
S&P                          -       Date                -                        Outlook              -                     20%                                                                  7%
Moody's                      -       Date                -                        Outlook              -
Fitch                        -       Date                -                        Outlook              -
Valuation Ratios
                         12/09       12/10      12/11        12/12      12/13E        12/14E     12/15E                                                                                    22%
P/E                          -           -      572.8x       604.3x     130.2x         84.0x      56.2x                                                     53%
EV/EBIT                      -           -      218.7x       208.3x           -             -          -
EV/EBITDA                    -           -       82.0x        86.6x      53.4x         34.6x      23.4x                                                                                                                       64%
                                                                                                                       27%
P/S                          -           -        9.3x        12.4x      12.5x           8.9x       6.9x
P/B                          -           -       10.2x        13.9x      18.7x         15.3x      12.8x
Div Yield                    -           -       0.0%         0.0%        0.0%          0.0%       0.0%
Profitability Ratios %
                       12/09         12/10      12/11        12/12      12/13E        12/14E     12/15E
Gross Margin            78.5          81.6       84.4         87.1        87.3          87.4       87.6                            Hiring Solutions
EBITDA Margin             7.1         16.1       13.2         14.1        22.5          24.7       28.3                                                                                            United States   EMEA
Operating Margin         -2.8          8.1        4.9          5.8         7.6          12.0       16.0
                                                                                                                                   Marketing Solutions
Profit Margin            -3.3          6.3        2.3          2.2        10.5          11.8       13.4
Return on Assets         -2.9          8.0        2.1          1.9         7.1          10.3       14.8
                                                                                                                                                                                                   APAC            Other Americas
Return on Equity            -            -        3.7          2.8        10.3          15.7       20.8                            Premium Subscriptions
Leverage and Coverage Ratios
                       12/09         12/10      12/11        12/12
Current Ratio             2.5          1.6        3.2          2.5                                         Current Capitalization in USD
Quick Ratio               2.3          1.4        3.0          2.3                                         Common Shares Outstanding (M)                                                                              109.7
EBIT/Interest               -            -          -            -                                         Market Capitalization (M)                                                                                18635.9
Tot Debt/Capital          0.0          0.0        0.0          0.0                                         Cash and ST Investments (M)                                                                                749.5
Tot Debt/Equity           0.0          0.0        0.0          0.0                                         Total Debt (M)                                                                                               0.0
Eff Tax Rate %              -         18.9       48.1         62.2                                         Preferred Equity (M)                                                                                         0.0
                                                                                                           LT Investments in Affiliate Companies (M)                                                                    0.0
                                                                                                           Investments (M)                                                                                              0.0
                                                                                                           Enterprise Value (M)                                                                                     17886.3


                                                                                  Q.M.S Advisors | tel: +41 (0)78 922 08 77 | e-mail: info@qmsadv.com |
Company Analysis - Analysts Ratings
LinkedIn Corp
Target price in USD
Broker Recommendation


                                                             Buy and Sell Recommendations vs Price and Target Price


                                                                                                                                                                      Price
                                                                                                                                                                                                                           Brokers' Target Price
                                                                                                                                                                200           250
                        100%      5%        4%       4%       0%         0%         0%        0%       0%          0%           0%         0%        0%
                                                                                                                                                                180
                                                                                                       35%                                                      160           200
                        80%                                   42%        39%       39%       40%                  39%           39%        41%
                                  38%       44%      40%                                                                                            48%
                                                                                                                                                                140
                                                                                                                                                                              150
                        60%                                                                                                                                     120
                                                                                                                                                                100           100
                        40%                                                                                                                                     80
                                                                         61%       61%       60%
                                                                                                       65%        61%           61%        59%                  60              50
                                  57%                56%      58%
                                            52%                                                                                                     52%
                        20%                                                                                                                                     40
                                                                                                                                                                                  0
                                                                                                                                                                20


                                                                                                                                                                                       Telsey Advisory
                                                                                                                                                                                       Morgan Stanley


                                                                                                                                                                                         Genuity Corp


                                                                                                                                                                                                                                                                                               Barclays
                                                                                                                                                                                             Fitzgerald


                                                                                                                                                                                                                                                                                         Lazard Capital
                                                                                                                                                                                          BMO Capital


                                                                                                                                                                                                                                                                                           Piper Jaffray
                                                                                                                                                                                      Daiwa Securities


                                                                                                                                                                                                                                                                       Raymond James


                                                                                                                                                                                                                                                                                       Securities (USA)
                                                                                                                                                                                              Evercore


                                                                                                                                                                                                                                                                                             Macquarie
                                                                                                                                                                                                                                                                                        Sterne, Agee &
                                                                                                                                                                                         Partners LLC
                                                                                                                                                                                         Securities Inc


                                                                                                                                                                                            JPMorgan


                                                                                                                                                                                                                                                                                            Cowen and


                                                                                                                                                                                                                                                                                                                                                          Securities
                                                                                                                                                                                                                                                                                       Financial Group
                                                                                                                                                                                                                                              Needham & Co


                                                                                                                                                                                                                                                                                                               EVA Dimensions


                                                                                                                                                                                                                                                                                                                                                   IPOfinancial.com
                                                                                                                                                                                             Robinson


                                                                                                                                                                                      Argus Research


                                                                                                                                                                                                                                                                                                                                   Goldman Sachs
                                                                                                                                                                                                                                  Jefferies


                                                                                                                                                                                                                                                                                                                 William Blair &
                                                                                                                                                                                                                                                                                                               Wedge Partners
                                                                                                                                                                                           Wunderlich


                                                                                                                                                                                                                                                             Wedbush
                                                                                                                                                                                             SunTrust


                                                                                                                                                                                                                                                                                                                                                          Montrose
                                                                                                                                                                                              Partners
                                                                                                                                                                                            Securities


                                                                                                                                                                                                                                                                                             Company


                                                                                                                                                                                                                                                                                        Credit Agricole
                                                                                                                                                                                                                                                                                        Susquehanna
                                                                                                                                                                                           Canaccord
                                                                                                                                                                                              Cantor


                                                                                                                                                                                           Northland
                                                                                                                                                                                           Avondale


                                                                                                                                                                                            Markets


                                                                                                                                                                                                                                                                                            Markets
                         0%                                                                                                                                     0


                                                                                                                                                                                          Co. Ltd.


                                                                                                                                                                                                                                                                                             Leach
                                                                                                                                                                                            Group
                                                                                                                                                                                            Corp


                                                                                                                                                                                                                                                                                                                       Co
                               mars.12     avr.12   mai.12   juin.12    juil.12   août.12   sept.12   oct.12     nov.12        déc.12    janv.13   févr.13
                                                                       Buy        Hold        Sell       Price            Target Price

                               Date                    Buy              Hold                Sell                     Date                Price Target Price                   Broker                             Analyst                                                               Recommendation         Target                                   Date
                               28-Feb-13               52%                48%               0%                      4-Mar-13             173.39        158.42                 Cantor Fitzgerald                  YOUSSEF H SQUALI                                                                hold          143.00                               1-Mar-13
                               31-Jan-13               59%                41%               0%                      1-Mar-13             170.46        158.42                 Wunderlich Securities              BLAKE T HARPER                                                                  buy           195.00                              27-Feb-13
                               31-Dec-12               61%                39%               0%                     28-Feb-13             168.18        158.42                 Evercore Partners                  KEN SENA                                                                    overweight        200.00                              27-Feb-13
                               30-Nov-12               61%                39%               0%                     27-Feb-13             168.55        158.42                 Morgan Stanley                     SCOTT W DEVITT                                                           Overwt/Attractive    180.00                              26-Feb-13
                               31-Oct-12               65%                35%               0%                     26-Feb-13             157.77        156.32                 SunTrust Robinson Humphrey         SO YOUNG LEE                                                                    buy           150.00                              21-Feb-13
                               28-Sep-12               60%                40%               0%                     25-Feb-13             156.05        156.32                 Daiwa Securities Co. Ltd.          KAZUYA NISHIMURA                                                              neutral         165.00                              19-Feb-13
                               31-Aug-12               61%                39%               0%                     22-Feb-13             160.44        156.32                 Canaccord Genuity Corp             MICHAEL GRAHAM                                                                  buy           150.00                              18-Feb-13
                               31-Jul-12               61%                39%               0%                     21-Feb-13             157.36        156.32                 Argus Research Corp                JOSEPH F BONNER                                                                 hold                                              11-Feb-13
                               29-Jun-12               58%                42%               0%                     20-Feb-13             158.09        156.32                 Avondale Partners LLC              RANDLE G REECE                                                           market outperform    180.00                              11-Feb-13
                               31-May-12               56%                40%               4%                     19-Feb-13             160.76        155.53                 Northland Securities Inc           BILL SUTHERLAND                                                           market perform      145.00                              11-Feb-13
                               30-Apr-12               52%                44%               4%                     18-Feb-13             162.66        153.00                 Telsey Advisory Group              THOMAS FORTE                                                             no rating system     165.00                              10-Feb-13
                               30-Mar-12               57%                38%               5%                     15-Feb-13             162.66        153.00                 BMO Capital Markets                DANIEL SALMON                                                             market perform      130.00                               8-Feb-13
                                                                                                                   14-Feb-13             161.34        153.00                 JPMorgan                           DOUGLAS ANMUTH                                                              overweight        163.00                               8-Feb-13
                                                                                                                   13-Feb-13             157.71        153.00                 Jefferies                          BRIAN J PITZ                                                                    buy           175.00                               8-Feb-13
                                                                                                                   12-Feb-13             155.00        153.00                 Needham & Co                       KERRY RICE                                                                      hold                                               8-Feb-13
                                                                                                                   11-Feb-13             155.41        153.00                 Wedbush                            MICHAEL PACHTER                                                               neutral         140.00                               8-Feb-13
                                                                                                                    8-Feb-13             150.48        151.42                 Raymond James                      AARON M KESSLER                                                           market perform                                           8-Feb-13
                                                                                                                    7-Feb-13             124.09        134.72                 Macquarie                          THOMAS WHITE                                                                outperform        160.00                               8-Feb-13
                                                                                                                    6-Feb-13             125.77        133.71                 Sterne, Agee & Leach               ARVIND BHATIA                                                                 neutral                                              8-Feb-13
                                                                                                                    5-Feb-13             124.45        133.31                 Cowen and Company                  JOHN BLACKLEDGE                                                               neutral                                              8-Feb-13
                                                                                                                    4-Feb-13             123.30        133.31                 Lazard Capital Markets             WILLIAM BIRD                                                                  neutral                                              8-Feb-13
                                                                                                                    1-Feb-13             123.82        135.00                 Susquehanna Financial Group        DEEPAK MATHIVANAN                                                            Positive         155.00                               8-Feb-13
                                                                                                                   31-Jan-13             123.79        135.00                 Piper Jaffray                      EUGENE E MUNSTER                                                            overweight        176.00                               8-Feb-13
                                                                                                                   30-Jan-13             123.46        135.00                 Credit Agricole Securities (USA)   JAMES LEE                                                                       buy           161.00                               8-Feb-13
                                                                                                                   29-Jan-13             124.53        135.00                 Barclays                           MARK MAY                                                                   equalweight        135.00                               8-Feb-13
                                                                                                                   28-Jan-13             127.20        135.00                 Wedge Partners                     MARTIN PYYKKONEN                                                         no rating system                                          8-Feb-13
                                                                                                                   25-Jan-13             123.78        135.00                 William Blair & Co                 TIMOTHY J MCHUGH                                                          market perform                                           7-Feb-13
                                                                                                                   24-Jan-13             121.22        135.00                 EVA Dimensions                     ANDREW S ZAMFOTIS                                                               hold                                              15-Jan-13
                                                                                                                   23-Jan-13             120.26        135.00                 Goldman Sachs                      HEATH P TERRY                                                             buy/attractive      157.00                               3-Aug-12
                                                                                                                   22-Jan-13             119.29        135.00                 IPOfinancial.com                   TEAM COVERAGE                                                                   buy                                               17-Feb-12

                                                                                                               Q.M.S Advisors | tel: +41 (0)78 922 08 77 | e-mail: info@qmsadv.com |
04.03.2013


LinkedIn Corp
                                                                             Company Analysis - Ownership
                                                                                    Ownership Type
Ownership Statistics                                                                                                                 Geographic Ownership Distribution                                             Geographic Ownership
                                                                                         1%
                                                                                        2%
Shares Outstanding (M)                         109.7                                                                                 United States                             93.97%
                                                                                                                                                                                                                      1%     1%0% 0%
Float                                          98.5%                                                                                 Britain                                   1.34%                                 1%            1%
Short Interest (M)                                4.5                                                                                Canada                                    0.99%                                1%
Short Interest as % of Float                   4.17%                                                                                 Japan                                     0.86%
Days to Cover Shorts                             1.13                                                                                Unknown Country                           0.75%
Institutional Ownership                      101.52%                                                                                 Switzerland                               0.44%
Retail Ownership                              -2.28%                                                                                 Luxembourg                                0.44%
Insider Ownership                              0.76%                                                                                 Others                                    1.20%

                                                                                                                                     Institutional Ownership Distribution
                                                                                             97%                                                                                                                                         95%
                                                                                                                                     Investment Advisor                        87.38%
                                                                                                                                     Hedge Fund Manager                        8.60%
                                                                                                                                     Pension Fund (Erisa)                      0.97%
                                                                                                                                                                                                         United States         Britain            Canada
                                                          Institutional Ownership      Retail Ownership   Insider Ownership          Individual                                0.75%
                                                                                                                                                                                                         Japan                 Unknown Country    Switzerland
Pricing data is in USD                                                                                                               Others                                    2.32%                     Luxembourg            Others
Top 20 Owners:                 TOP 20 ALL

                                                                                                                                                                                                                  Institutional Ownership
Holder Name                                   Position   Position Change                      Market Value          % of Ownership   Report Date                  Source       Country
T ROWE PRICE ASSOCIA                        7'833'170          1'466'654                      1'358'193'346              8.75%                      31.12.2012     13F      UNITED STATES                                 1%         2%
                                                                                                                                                                                                                         1%
JENNISON ASSOCIATES                         7'705'593             82'273                      1'336'072'770              8.61%                      31.12.2012     13F      UNITED STATES
FMR LLC                                     5'083'134          2'948'557                        881'364'604              5.68%                      31.12.2012   ULT-AGG    UNITED STATES                          9%
MORGAN STANLEY                              4'016'541           -434'658                        696'428'044              4.49%                      31.12.2012   ULT-AGG    UNITED STATES
AMERIPRISE FINANCIAL                        3'998'973            175'610                        693'381'928              4.47%                      31.12.2012     13F      UNITED STATES
JP MORGAN                                   3'703'400            981'364                        642'132'526              4.14%                      31.12.2012   ULT-AGG
VANGUARD GROUP INC                          3'578'026            720'002                        620'393'928              4.00%                      31.12.2012     13F      UNITED STATES
WELLINGTON MANAGEMEN                        3'413'977            727'331                        591'949'472              3.81%                      31.12.2012     13F      UNITED STATES
CAPITAL GROUP COMPAN                        2'544'120             20'000                        441'124'967              2.84%                      31.12.2012   ULT-AGG    UNITED STATES
BLACKROCK                                   2'427'438            132'541                        420'893'475              2.71%                      28.02.2013   ULT-AGG    UNITED STATES                                                 87%
HARBOR CAPITAL ADVIS                        2'381'116             10'273                        412'861'703              2.66%                      31.12.2012   MF-AGG     UNITED STATES
ALLIANCE BERNSTEIN                          1'721'263            965'169                        298'449'792              1.92%                      31.12.2012   ULT-AGG    UNITED STATES
ARTISAN PARTNERS HOL                        1'598'200            259'900                        277'111'898              1.79%                      31.12.2012     13F      UNITED STATES
AMERICAN CENTURY COM                        1'444'680            291'230                        250'493'065              1.61%                      31.12.2012     13F      UNITED STATES   Investment Advisor           Hedge Fund Manager      Pension Fund (Erisa)
                                                                                                                                                                                            Individual                   Others
MANAGED ACCOUNT ADVI                        1'407'827           -237'663                        244'103'124              1.57%                      31.12.2012     13F      UNITED STATES
WELLS FARGO                                 1'312'350            640'126                        227'548'367              1.47%                      31.12.2012   ULT-AGG
FRANKLIN RESOURCES                          1'277'750            581'660                        221'549'073              1.43%                      31.12.2012   ULT-AGG    UNITED STATES
STATE STREET                                1'072'678             68'511                        185'991'638              1.20%                      01.03.2013   ULT-AGG    UNITED STATES
GILDER GAGNON HOWE                          1'047'375           -133'817                        181'604'351              1.17%                      31.12.2012     13F      UNITED STATES
NEUBERGER BERMAN LLC                        1'014'523           -983'863                        175'908'143              1.13%                      31.12.2012     13F      UNITED STATES
Top 5 Insiders:


Holder Name                                  Position    Position Change                      Market Value          % of Ownership   Report Date                  Source
SZE DAVID                                    409'557               -15'937                        71'013'088              0.46%                     19.02.2013    Form 4
WEINER JEFFREY                                85'770                -3'303                        14'871'660              0.10%                     19.02.2013    Form 4
SORDELLO STEVEN J                             41'268                -1'211                         7'155'459              0.05%                     19.02.2013    Form 4
NISHAR DIPCHAND                               37'620               -12'500                         6'522'932              0.04%                     20.02.2013    Form 4
HENKE DAVID                                   35'758                                               6'200'080              0.04%                     05.02.2013    Form 4


                                                                              Q.M.S Advisors | tel: +41 (0)78 922 08 77 | e-mail: info@qmsadv.com |
Company Analysis - Financials I/IV
LinkedIn Corp
Financial information is in USD (M)                                                                                                                                             Equivalent Estimates
Periodicity:             Fiscal Year                 12/02         12/03    12/04      12/05        12/06       12/07        12/08       12/09       12/10   12/11   12/12   12/13E      12/14E        12/15E
Income Statement
Revenue                                                                                                            32           79         120        243     522     972     1'491       2'088         2'702
  - Cost of Goods Sold                                                                                              7           19          26         45      81     126

Gross Income                                                                                                       25           60          94        198     441     847     1'302       1'826         2'367
  - Selling, General & Admin Expenses                                                                              26           66          98        179     415     790
          (Research & Dev Costs)                                                                                   12           29          39         65     132     257

Operating Income                                                                                                    -0          -6           -3        20      26      57      114          250          433
  - Interest Expense                                                                                                 0           0            0         0       0       0
  - Foreign Exchange Losses (Gains)                                                                                  0           0            0         0       0       0
  - Net Non-Operating Losses (Gains)                                                                                -1          -1           -0         1       3      -0

Pretax Income                                                                                                       0           -4           -3        19      23      57      176          324          521
  - Income Tax Expense                                                                                              0            0            1         4      11      36

Income Before XO Items                                                                                              0           -5           -4        15      12      22
   - Extraordinary Loss Net of Tax                                                                                  0            0            0         0       0       0
   - Minority Interests                                                                                             0            0            0         0       0       0

Diluted EPS Before XO Items                                                                                      0.00        (0.11)      (0.10)      0.07    0.11    0.19

Net Income Adjusted*                                                                                                                                             7      28     156          247          361
EPS Adjusted                                                                                                                                                 0.06    0.25     1.33         2.06         3.08
Dividends Per Share                                                                                              0.00        0.00         0.00       0.00    0.00    0.00     0.00         0.00         0.00
        Payout Ratio %                                                                                                                                0.0     0.0     0.0     0.00         0.00         0.00

Total Shares Outstanding                                                                                                        42          42         43     101     110
Diluted Shares Outstanding                                                                                         39           42          41         46     104     113

EBITDA                                                                                                              2            1           8         39      69     137      335          517          765

*Net income excludes extraordinary gains and losses and one-time charges.


                                                                             Q.M.S Advisors | tel: +41 (0)78 922 08 77 | e-mail: info@qmsadv.com |
Company Analysis - Financials II/IV
Periodicity:                           12/02   12/03   12/04      12/05        12/06       12/07        12/08       12/09        12/10     12/11      12/12    12/13E   12/14E   12/15E
Balance Sheet
Total Current Assets                                                                                   99.211     121.158       172.206   725.927   1018.797
  + Cash & Near Cash Items                                                                                 80          90            93       339        270
  + Short Term Investments                                                                                  0           0             0       238        479
  + Accounts & Notes Receivable                                                                            15          24            58       111        204
  + Inventories                                                                                             0           0             0         0          0
  + Other Current Assets                                                                                    4           7            21        37         66

Total Long-Term Assets                                                                                     23          27           66       148        364
  + Long Term Investments                                                                                                            0         0          0
         Gross Fixed Assets                                                                                31          47           95       192        328
         Accumulated Depreciation                                                                           9          21           38        77        142
  + Net Fixed Assets                                                                                       22          26           57       115        187
  + Other Long Term Assets                                                                                  1           2            9        33        177

Total Current Liabilities                                                                                  28          49          105       227        415
  + Accounts Payable                                                                                        3           5            2        28         54
  + Short Term Borrowings                                                                                   0           0            0         0          0
  + Other Short Term Liabilities                                                                           25          44          103       198        362

Total Long Term Liabilities                                                                                 1           2            8        22         59
  + Long Term Borrowings                                                                                    0           1            2         0          0
  + Other Long Term Borrowings                                                                              1           2            7        22         59

Total Liabilities                                                                                          29          51          114       249        474
  + Long Preferred Equity                                                                                 103         103          104                    0
  + Minority Interest                                                                                       0           0            0                    0
  + Share Capital & APIC                                                                                    6          14           25       618        879
  + Retained Earnings & Other Equity                                                                      -16         -20           -5         7         29

Total Shareholders Equity                                                                                  93          97          124       625        908

Total Liabilities & Equity                                                                                122         149          238       874       1'382

Book Value Per Share                                                                                    -0.24        -0.15         0.47      6.16       8.28     9.28    11.31    13.50
  Tangible Book Value Per Share                                                                         -0.26        -0.16         0.35      5.96       6.93


                                                        Q.M.S Advisors | tel: +41 (0)78 922 08 77 | e-mail: info@qmsadv.com |
Company Analysis - Financials III/IV
Periodicity:                           12/02   12/03   12/04      12/05        12/06       12/07        12/08       12/09       12/10   12/11   12/12   12/13E   12/14E   12/15E
Cash Flows
Net Income                                                                                     0           -5          -4         15      12      22       38      108      250
  + Depreciation & Amortization                                                                2            6          12         20      43      80
  + Other Non-Cash Adjustments                                                                 2            5           7         11      31      51
  + Changes in Non-Cash Capital                                                                3            2           7          9      47     114

Cash From Operating Activities                                                                 8            9          21         54      133     267
  + Disposal of Fixed Assets                                                                                                                0       0
  + Capital Expenditures                                                                       -8         -20          -13        -50     -89    -125     -183     -216     -256
  + Increase in Investments                                                                                                              -251    -444
  + Decrease in Investments                                                                                                                12     199
  + Other Investing Activities                                                                             -1           0          -6     -10     -62

Cash From Investing Activities                                                                 -8         -20          -13        -56    -338    -433
  + Dividends Paid                                                                                                                          0       0
  + Change in Short Term Borrowings                                                                                                         0       0
  + Increase in Long Term Borrowings                                                                                                        0       0
  + Decrease in Long Term Borrowings                                                                                                        0       0
  + Increase in Capital Stocks                                                                15           78            2          5     269      97
  + Decrease in Capital Stocks                                                                -0           -4           -1         -0      -0      -0
  + Other Financing Activities                                                                -0           -0            0         -0     183       0

Cash From Financing Activities                                                                14           74           1          4     451      97

Net Changes in Cash                                                                           14           63           9          3     246      -69

Free Cash Flow (CFO-CAPEX)                                                                     -0         -10           8          4      44     142      164      241      326

Free Cash Flow To Firm                                                                         -0                                  4      44     142
Free Cash Flow To Equity
Free Cash Flow per Share                                                                    -0.01       -0.25         0.20       0.10    0.58    1.35


                                                        Q.M.S Advisors | tel: +41 (0)78 922 08 77 | e-mail: info@qmsadv.com |
Company Analysis - Financials IV/IV
Periodicity:                         12/02   12/03   12/04      12/05        12/06       12/07        12/08       12/09       12/10   12/11    12/12    12/13E   12/14E   12/15E
Ratio Analysis

Valuation Ratios
  Price Earnings                                                                                                                      572.8x   604.3x   130.2x    84.0x    56.2x
  EV to EBIT                                                                                                                          218.7x   208.3x
  EV to EBITDA                                                                                                                         82.0x    86.6x    53.4x    34.6x    23.4x
  Price to Sales                                                                                                                        9.3x    12.4x    12.5x     8.9x     6.9x
  Price to Book                                                                                                                        10.2x    13.9x    18.7x    15.3x    12.8x
  Dividend Yield                                                                                                                       0.0%     0.0%     0.0%     0.0%     0.0%

Profitability Ratios
  Gross Margin                                                                           77.3%        76.4%       78.5%       81.6%   84.4%    87.1%    87.3%    87.4%    87.6%
  EBITDA Margin                                                                           5.2%         1.1%        7.1%       16.1%   13.2%    14.1%    22.5%    24.7%    28.3%
  Operating Margin                                                                       -1.3%        -7.0%       -2.8%        8.1%    4.9%     5.8%     7.6%    12.0%    16.0%
  Profit Margin                                                                           1.0%        -5.7%       -3.3%        6.3%    2.3%     2.2%    10.5%    11.8%    13.4%
  Return on Assets                                                                                                -2.9%        8.0%    2.1%     1.9%     7.1%    10.3%    14.8%
  Return on Equity                                                                                                                     3.7%     2.8%    10.3%    15.7%    20.8%

Leverage & Coverage Ratios
  Current Ratio                                                                                        3.58         2.46       1.63     3.20     2.45
  Quick Ratio                                                                                          3.44         2.32       1.43     3.04     2.29
  Interest Coverage Ratio (EBIT/I)                                                       -36.00
  Tot Debt/Capital                                                                                     0.00         0.01       0.01     0.00     0.00
  Tot Debt/Equity                                                                                      0.00         0.01       0.01     0.00     0.00

Others
  Asset Turnover                                                                                                    0.89       1.26     0.94     0.86
  Accounts Receivable Turnover                                                                                      6.11       5.89     6.16     6.17
  Accounts Payable Turnover                                                                                         6.96      12.84     5.38     3.07
  Inventory Turnover

  Effective Tax Rate                                                                      3.8%                                18.9%   48.1%    62.2%


                                                      Q.M.S Advisors | tel: +41 (0)78 922 08 77 | e-mail: info@qmsadv.com |
Company Analysis - Peers Comparision
                                                                             MONSTER
                                         LINKEDIN CORP-A FACEBOOK INC-A                      GOOGLE INC-CL A    YAHOO! INC           EBAY INC         AMAZON.COM INC        YELP INC           GROUPON INC          ZYNGA INC- CL A
                                                                             WORLDWID

Latest Fiscal Year:                             12/2012         12/2012          12/2012            12/2012          12/2012              12/2012             12/2012            12/2012               12/2012             12/2012
52-Week High                                      173.78           45.00            10.40             814.47            22.62                57.27              284.72              31.96                 19.21               14.48
52-Week High Date                             04.03.2013      18.05.2012       26.03.2012         04.03.2013       04.03.2013           01.02.2013          25.01.2013         28.03.2012            05.03.2012          21.03.2012
52-Week Low                                        84.10           17.55              4.94            556.52            14.35                34.83              178.04              14.10                   2.60                2.09
52-Week Low Date                              06.03.2012      04.09.2012       04.03.2013         14.06.2012       06.03.2012           06.03.2012          06.03.2012         04.06.2012            12.11.2012          09.11.2012
Daily Volume                                     166'440      12'825'634          442'852            887'636       10'465'454            2'539'774             732'834            201'086            11'541'690          15'699'751
  Current Price (3/dd/yy)                        173.39            27.55             4.96             813.54            22.36                54.59             268.84               22.68                  5.24                 3.55
  52-Week High % Change                            -0.2%          -38.8%           -52.3%               -0.1%            -1.2%                -4.7%              -5.6%             -29.0%               -72.7%               -75.5%
  52-Week Low % Change                           106.2%            57.0%             0.4%              46.2%            55.8%                56.7%              51.0%               60.9%               101.5%                69.9%
Total Common Shares (M)                           109.7          2'372.0            111.1              330.0          1'182.7              1'294.0              454.0                63.5                656.9                779.3
  Market Capitalization                        18'637.7        65'627.8            579.5          269'393.6         26'439.6             70'776.6          122'201.5             1'435.6               3'436.0             2'788.5
Total Debt                                          -            2'356.0           164.2             5'537.0              -                4'519.0            4'218.0                 -                     -                 100.0
Preferred Stock                                     -                -               -                   -                -                    -                  -                   -                     -                   -
Minority Interest                                   -                -               -                   -               45.4                  -                  -                   -                    (1.9)                  -
Cash and Equivalents                              749.5          9'626.0           148.2            49'557.0          6'022.4              9'408.0           11'448.0                95.1               1'209.3             1'652.3
   Enterprise Value                            17'888.1        58'357.8            595.6          225'373.5         20'462.6             65'887.6          114'971.5             1'340.5               2'224.7             1'236.2
                                                                                                                                                         Valuation
Total Revenue                      LFY             972.3         5'089.0           890.4            50'175.0          4'986.6             14'072.0           61'093.0               137.6               2'334.5             1'281.3
                                  LTM              972.3         5'089.0           916.0            51'379.0          4'986.6             14'071.0           61'093.0               137.6               2'334.5             1'281.3
                                 CY+1            1'490.8         6'677.7           831.8            49'451.2          4'674.1             16'345.5           75'751.6               211.4               2'561.5             1'057.4
                                 CY+2            2'088.2         8'434.7           849.6            57'163.0          4'845.7             18'730.9           93'067.6               294.9               2'833.0             1'101.9
EV/Total Revenue                   LFY              12.2x           11.0x             0.7x               3.8x              3.5x                4.3x               1.7x                 8.0x                 0.8x                0.2x
                                  LTM               12.2x           11.0x             0.7x               3.7x              3.5x                4.3x               1.7x                 8.0x                 0.8x                0.2x
                                 CY+1               11.9x            8.5x             0.6x               4.4x              4.6x                3.9x               1.5x                 6.3x                 0.8x                1.4x
                                 CY+2                8.4x            6.6x             0.5x               3.6x              4.2x                3.2x               1.2x                 4.4x                 0.6x                1.3x
EBITDA                             LFY             136.7         1'187.0           142.5            15'722.0          1'457.1              4'088.0            2'835.0                (10.3)               155.4                54.0
                                  LTM              136.7         1'187.0           118.0            15'684.0          1'457.1              4'090.0            2'834.0                (10.3)               143.7                54.0
                                 CY+1              335.2         3'400.1           152.4            22'087.3          1'664.4              5'383.4            4'646.4                 21.1                254.9                58.9
                                 CY+2              516.7         4'479.8           161.4            25'944.5          1'740.8              6'241.8            6'384.0                 46.6                319.3               122.6
EV/EBITDA                          LFY              86.6x           47.1x             4.5x              12.0x            12.0x                14.9x              37.6x             -107.2x                 12.8x                5.3x
                                  LTM               86.6x           47.1x             5.4x              12.1x            12.0x                14.9x              37.6x                     -               13.8x                5.3x
                                 CY+1               53.1x           16.7x             3.3x              10.0x            12.9x                11.9x              24.6x                62.7x                 7.8x               25.8x
                                 CY+2               33.9x           12.3x             2.4x               7.9x            11.7x                 9.6x              17.1x                27.8x                 5.2x               11.5x
EPS                                LFY               0.19            0.01             0.71              34.02             1.17                 1.95               0.05                -0.33                -0.03               -0.20
                                  LTM                0.19            0.02             0.21              33.74             1.17                 1.94               0.36                -0.44                -0.08               -0.23
                                 CY+1               1.33            0.57             0.36              45.71             1.16                 2.75               3.13                 0.09                 0.20               (0.04)
                                 CY+2               2.06            0.78             0.42              53.86             1.27                 3.21               5.54                 0.37                 0.29                0.00
P/E                                LFY             912.6x        1377.5x             23.6x              24.1x            19.1x                28.1x            746.8x                      -                    -                   -
                                  LTM              912.6x        1377.5x             23.6x              24.1x            19.1x                28.1x            746.8x                      -                    -                   -
                                 CY+1              130.2x           48.2x            13.9x              17.8x            19.4x                19.8x              85.9x              257.7x                 26.3x                    -
                                 CY+2               84.0x           35.2x            11.8x              15.1x            17.6x                17.0x              48.6x                61.6x                18.1x            3550.0x
Revenue Growth                  1 Year             86.2%           37.1%          (10.4%)              32.4%              0.0%               20.8%              27.1%               65.2%                 45.0%               12.4%
                                5 Year                   -               -         (8.6%)              24.7%            (5.8%)               13.7%              30.6%                      -                    -                   -
EBITDA Growth                   1 Year             98.3%         (42.9%)          (17.7%)              15.7%            (1.1%)               23.4%              45.8%               13.9%                       -                   -
                                5 Year            141.2%                 -        (12.8%)              21.0%              1.5%                9.4%              25.8%                      -                    -                   -
EBITDA Margin                     LTM              14.1%           23.3%            12.9%              30.5%            29.2%                29.1%               4.6%               (7.5%)                 6.2%                4.2%
                                 CY+1              22.5%           50.9%            18.3%              44.7%            35.6%                32.9%               6.1%               10.0%                 10.0%                5.6%
                                 CY+2              24.7%           53.1%            19.0%              45.4%            35.9%                33.3%               6.9%               15.8%                 11.3%               11.1%
                                                                                                                                                Leverage/Coverage Ratios
Total Debt / Equity %                               0.0%          20.0%            18.7%                7.7%             0.0%               21.7%               51.5%                  0.0%                0.0%                 5.5%    FALSE    FALSE    FALSE    FALSE    FALSE
Total Debt / Capital %                              0.0%          16.7%            15.7%                7.2%             0.0%               17.8%               34.0%                  0.0%                0.0%                 5.2%    FALSE    FALSE    FALSE    FALSE    FALSE
Total Debt / EBITDA                               0.000x          1.985x           1.392x             0.353x           0.000x               1.105x              1.488x                     -             0.000x               1.852x    FALSE    FALSE    FALSE    FALSE    FALSE
Net Debt / EBITDA                                -5.483x         -6.125x           0.136x            -2.807x          -4.133x              -1.195x             -2.551x                     -            -8.416x             -28.746x    FALSE    FALSE    FALSE    FALSE    FALSE
EBITDA / Int. Expense                                   -        23.275x                -           187.167x                 -             64.889x             30.815x                     -                   -                    -   FALSE    FALSE    FALSE    FALSE    FALSE
                                                                                                                                                       Credit Ratings
S&P LT Credit Rating                                    -               -               -                AA               NR                    A                  AA-                    -                    -                   -    FALSE    FALSE    FALSE    FALSE    FALSE
S&P LT Credit Rating Date                                -               -               -        19.11.2012       18.04.2008           02.03.2010          26.11.2012                     -                    -                   -    FALSE    FALSE    FALSE    FALSE    FALSE
Moody's LT Credit Rating                                -               -               -               Aa2                 -                  A2                Baa1                     -                    -                   -    FALSE    FALSE    FALSE    FALSE    FALSE
Moody's LT Credit Rating Date                            -               -               -        16.05.2011                 -          21.10.2010          26.11.2012                     -                    -                   -    FALSE    FALSE    FALSE    FALSE    FALSE


                                                                                                                             Q.M.S Advisors | tel: +41 (0)78 922 08 77 | e-mail: info@qmsadv.com |

Weitere ähnliche Inhalte

Was ist angesagt?

Financial analysis total sa - total sa explores for, produces, refines, tra...
Financial analysis   total sa - total sa explores for, produces, refines, tra...Financial analysis   total sa - total sa explores for, produces, refines, tra...
Financial analysis total sa - total sa explores for, produces, refines, tra...BCV
 
Financial Analysis - China State Construction Engineering Corporation Limited...
Financial Analysis - China State Construction Engineering Corporation Limited...Financial Analysis - China State Construction Engineering Corporation Limited...
Financial Analysis - China State Construction Engineering Corporation Limited...BCV
 
Financial analysis sony corp - sony corporation manufactures audio, home vi...
Financial analysis   sony corp - sony corporation manufactures audio, home vi...Financial analysis   sony corp - sony corporation manufactures audio, home vi...
Financial analysis sony corp - sony corporation manufactures audio, home vi...BCV
 
Financial analysis nobel biocare holding ag develops and produces dental im...
Financial analysis   nobel biocare holding ag develops and produces dental im...Financial analysis   nobel biocare holding ag develops and produces dental im...
Financial analysis nobel biocare holding ag develops and produces dental im...BCV
 
Financial Analysis - Banque Cantonale Vaudoise - Banque Cantonale Vaudoise (B...
Financial Analysis - Banque Cantonale Vaudoise - Banque Cantonale Vaudoise (B...Financial Analysis - Banque Cantonale Vaudoise - Banque Cantonale Vaudoise (B...
Financial Analysis - Banque Cantonale Vaudoise - Banque Cantonale Vaudoise (B...BCV
 
Financial analysis paladin energy ltd - paladin energy limited primarily ex...
Financial analysis   paladin energy ltd - paladin energy limited primarily ex...Financial analysis   paladin energy ltd - paladin energy limited primarily ex...
Financial analysis paladin energy ltd - paladin energy limited primarily ex...BCV
 
Financial analysis kinross gold corp - kinross gold corporation is involved...
Financial analysis   kinross gold corp - kinross gold corporation is involved...Financial analysis   kinross gold corp - kinross gold corporation is involved...
Financial analysis kinross gold corp - kinross gold corporation is involved...BCV
 
Financial Analysis - Shanghai Construction Co., ltd. undertakes a variety …
Financial Analysis - Shanghai Construction Co., ltd. undertakes a variety …Financial Analysis - Shanghai Construction Co., ltd. undertakes a variety …
Financial Analysis - Shanghai Construction Co., ltd. undertakes a variety …BCV
 
Financial Analysis - Osisko Mining Corporation is a gold exploration compa…
Financial Analysis - Osisko Mining Corporation is a gold exploration compa…Financial Analysis - Osisko Mining Corporation is a gold exploration compa…
Financial Analysis - Osisko Mining Corporation is a gold exploration compa…BCV
 
Financial Analysis - Technip SA designs and constructs industrial facilities....
Financial Analysis - Technip SA designs and constructs industrial facilities....Financial Analysis - Technip SA designs and constructs industrial facilities....
Financial Analysis - Technip SA designs and constructs industrial facilities....BCV
 
P&G 2002 Annual Report
P&G 2002 Annual ReportP&G 2002 Annual Report
P&G 2002 Annual Reportfinance3
 
P&G 2000 Annual Report
P&G 2000 Annual ReportP&G 2000 Annual Report
P&G 2000 Annual Reportfinance3
 
P&G 2003 Annual Report
P&G 2003 Annual ReportP&G 2003 Annual Report
P&G 2003 Annual Reportfinance3
 
Financial Analysis - CSR Corp ltd. provides a wide range of rolling stock p…
Financial Analysis - CSR Corp ltd. provides a wide range of rolling stock p…Financial Analysis - CSR Corp ltd. provides a wide range of rolling stock p…
Financial Analysis - CSR Corp ltd. provides a wide range of rolling stock p…BCV
 
Dividend idea Philip Morris (PM) By http://long-term-investments.blogspot.com
Dividend idea Philip Morris (PM) By http://long-term-investments.blogspot.comDividend idea Philip Morris (PM) By http://long-term-investments.blogspot.com
Dividend idea Philip Morris (PM) By http://long-term-investments.blogspot.comDividend Yield
 
Financial Analysis - Commerzbank AG attracts deposits and offers retail an…
Financial Analysis - Commerzbank AG attracts deposits and offers retail an…Financial Analysis - Commerzbank AG attracts deposits and offers retail an…
Financial Analysis - Commerzbank AG attracts deposits and offers retail an…BCV
 
allstateFinancial Highlights, Shareholder Letter and Our Customer Family 1998
allstateFinancial Highlights, Shareholder Letter and Our Customer Family 1998allstateFinancial Highlights, Shareholder Letter and Our Customer Family 1998
allstateFinancial Highlights, Shareholder Letter and Our Customer Family 1998finance7
 
whirlpool Annual Report2000
whirlpool Annual Report2000whirlpool Annual Report2000
whirlpool Annual Report2000finance13
 
Public Meeting 2Q11 ing
Public Meeting 2Q11 ingPublic Meeting 2Q11 ing
Public Meeting 2Q11 ingLocaliza
 
SEB's first-quarter 2012 results presentation
SEB's first-quarter 2012 results presentationSEB's first-quarter 2012 results presentation
SEB's first-quarter 2012 results presentationSEBgroup
 

Was ist angesagt? (20)

Financial analysis total sa - total sa explores for, produces, refines, tra...
Financial analysis   total sa - total sa explores for, produces, refines, tra...Financial analysis   total sa - total sa explores for, produces, refines, tra...
Financial analysis total sa - total sa explores for, produces, refines, tra...
 
Financial Analysis - China State Construction Engineering Corporation Limited...
Financial Analysis - China State Construction Engineering Corporation Limited...Financial Analysis - China State Construction Engineering Corporation Limited...
Financial Analysis - China State Construction Engineering Corporation Limited...
 
Financial analysis sony corp - sony corporation manufactures audio, home vi...
Financial analysis   sony corp - sony corporation manufactures audio, home vi...Financial analysis   sony corp - sony corporation manufactures audio, home vi...
Financial analysis sony corp - sony corporation manufactures audio, home vi...
 
Financial analysis nobel biocare holding ag develops and produces dental im...
Financial analysis   nobel biocare holding ag develops and produces dental im...Financial analysis   nobel biocare holding ag develops and produces dental im...
Financial analysis nobel biocare holding ag develops and produces dental im...
 
Financial Analysis - Banque Cantonale Vaudoise - Banque Cantonale Vaudoise (B...
Financial Analysis - Banque Cantonale Vaudoise - Banque Cantonale Vaudoise (B...Financial Analysis - Banque Cantonale Vaudoise - Banque Cantonale Vaudoise (B...
Financial Analysis - Banque Cantonale Vaudoise - Banque Cantonale Vaudoise (B...
 
Financial analysis paladin energy ltd - paladin energy limited primarily ex...
Financial analysis   paladin energy ltd - paladin energy limited primarily ex...Financial analysis   paladin energy ltd - paladin energy limited primarily ex...
Financial analysis paladin energy ltd - paladin energy limited primarily ex...
 
Financial analysis kinross gold corp - kinross gold corporation is involved...
Financial analysis   kinross gold corp - kinross gold corporation is involved...Financial analysis   kinross gold corp - kinross gold corporation is involved...
Financial analysis kinross gold corp - kinross gold corporation is involved...
 
Financial Analysis - Shanghai Construction Co., ltd. undertakes a variety …
Financial Analysis - Shanghai Construction Co., ltd. undertakes a variety …Financial Analysis - Shanghai Construction Co., ltd. undertakes a variety …
Financial Analysis - Shanghai Construction Co., ltd. undertakes a variety …
 
Financial Analysis - Osisko Mining Corporation is a gold exploration compa…
Financial Analysis - Osisko Mining Corporation is a gold exploration compa…Financial Analysis - Osisko Mining Corporation is a gold exploration compa…
Financial Analysis - Osisko Mining Corporation is a gold exploration compa…
 
Financial Analysis - Technip SA designs and constructs industrial facilities....
Financial Analysis - Technip SA designs and constructs industrial facilities....Financial Analysis - Technip SA designs and constructs industrial facilities....
Financial Analysis - Technip SA designs and constructs industrial facilities....
 
P&G 2002 Annual Report
P&G 2002 Annual ReportP&G 2002 Annual Report
P&G 2002 Annual Report
 
P&G 2000 Annual Report
P&G 2000 Annual ReportP&G 2000 Annual Report
P&G 2000 Annual Report
 
P&G 2003 Annual Report
P&G 2003 Annual ReportP&G 2003 Annual Report
P&G 2003 Annual Report
 
Financial Analysis - CSR Corp ltd. provides a wide range of rolling stock p…
Financial Analysis - CSR Corp ltd. provides a wide range of rolling stock p…Financial Analysis - CSR Corp ltd. provides a wide range of rolling stock p…
Financial Analysis - CSR Corp ltd. provides a wide range of rolling stock p…
 
Dividend idea Philip Morris (PM) By http://long-term-investments.blogspot.com
Dividend idea Philip Morris (PM) By http://long-term-investments.blogspot.comDividend idea Philip Morris (PM) By http://long-term-investments.blogspot.com
Dividend idea Philip Morris (PM) By http://long-term-investments.blogspot.com
 
Financial Analysis - Commerzbank AG attracts deposits and offers retail an…
Financial Analysis - Commerzbank AG attracts deposits and offers retail an…Financial Analysis - Commerzbank AG attracts deposits and offers retail an…
Financial Analysis - Commerzbank AG attracts deposits and offers retail an…
 
allstateFinancial Highlights, Shareholder Letter and Our Customer Family 1998
allstateFinancial Highlights, Shareholder Letter and Our Customer Family 1998allstateFinancial Highlights, Shareholder Letter and Our Customer Family 1998
allstateFinancial Highlights, Shareholder Letter and Our Customer Family 1998
 
whirlpool Annual Report2000
whirlpool Annual Report2000whirlpool Annual Report2000
whirlpool Annual Report2000
 
Public Meeting 2Q11 ing
Public Meeting 2Q11 ingPublic Meeting 2Q11 ing
Public Meeting 2Q11 ing
 
SEB's first-quarter 2012 results presentation
SEB's first-quarter 2012 results presentationSEB's first-quarter 2012 results presentation
SEB's first-quarter 2012 results presentation
 

Ähnlich wie Financial Analysis - LinkedIn Corporation operates a social networking website used for professional networking. The Company's website allows members to post a profile of their professional expertise and accomplishments

Financial analysis - MBIA Inc. provides financial guarantee insurance and …
Financial analysis - MBIA Inc. provides financial guarantee insurance and …Financial analysis - MBIA Inc. provides financial guarantee insurance and …
Financial analysis - MBIA Inc. provides financial guarantee insurance and …BCV
 
Fundamental Analysis & Financial Analyst Recommandations - Google Inc - US382...
Fundamental Analysis & Financial Analyst Recommandations - Google Inc - US382...Fundamental Analysis & Financial Analyst Recommandations - Google Inc - US382...
Fundamental Analysis & Financial Analyst Recommandations - Google Inc - US382...BCV
 
Financial Analysis - Facebook Inc. operates a social networking website. The ...
Financial Analysis - Facebook Inc. operates a social networking website. The ...Financial Analysis - Facebook Inc. operates a social networking website. The ...
Financial Analysis - Facebook Inc. operates a social networking website. The ...BCV
 
Financial Analysis - Assured Guaranty Ltd. provides financial guaranty insura...
Financial Analysis - Assured Guaranty Ltd. provides financial guaranty insura...Financial Analysis - Assured Guaranty Ltd. provides financial guaranty insura...
Financial Analysis - Assured Guaranty Ltd. provides financial guaranty insura...BCV
 
Financial Analysis - Zhejiang Expressway Co., ltd., through its subsidiari…
Financial Analysis - Zhejiang Expressway Co., ltd., through its subsidiari…Financial Analysis - Zhejiang Expressway Co., ltd., through its subsidiari…
Financial Analysis - Zhejiang Expressway Co., ltd., through its subsidiari…BCV
 
Financial Analysis - Two Harbors Investment Corporation is a re…
Financial Analysis - Two Harbors Investment Corporation is a re…Financial Analysis - Two Harbors Investment Corporation is a re…
Financial Analysis - Two Harbors Investment Corporation is a re…BCV
 
Financial Analysis - PetroChina Company Limited explores, develops, and produ...
Financial Analysis - PetroChina Company Limited explores, develops, and produ...Financial Analysis - PetroChina Company Limited explores, develops, and produ...
Financial Analysis - PetroChina Company Limited explores, develops, and produ...BCV
 
Financial analysis cresud sacif y a is an argentine agricultural company, w...
Financial analysis   cresud sacif y a is an argentine agricultural company, w...Financial analysis   cresud sacif y a is an argentine agricultural company, w...
Financial analysis cresud sacif y a is an argentine agricultural company, w...BCV
 
Financial analysis chesapeake energy corp - chesapeake energy corporation p...
Financial analysis   chesapeake energy corp - chesapeake energy corporation p...Financial analysis   chesapeake energy corp - chesapeake energy corporation p...
Financial analysis chesapeake energy corp - chesapeake energy corporation p...BCV
 
Financial analysis adecoagro sa - adecoagro s.a. is an agricultural company...
Financial analysis   adecoagro sa - adecoagro s.a. is an agricultural company...Financial analysis   adecoagro sa - adecoagro s.a. is an agricultural company...
Financial analysis adecoagro sa - adecoagro s.a. is an agricultural company...BCV
 
Presentation of 4 q06 results
Presentation of 4 q06 resultsPresentation of 4 q06 results
Presentation of 4 q06 resultsCSURIWEB
 
Financial Analysis - China Communications Construction Company Ltd. is a tran...
Financial Analysis - China Communications Construction Company Ltd. is a tran...Financial Analysis - China Communications Construction Company Ltd. is a tran...
Financial Analysis - China Communications Construction Company Ltd. is a tran...BCV
 
Financial Analysis - EFG Financial Products Holding AG provides financial ser...
Financial Analysis - EFG Financial Products Holding AG provides financial ser...Financial Analysis - EFG Financial Products Holding AG provides financial ser...
Financial Analysis - EFG Financial Products Holding AG provides financial ser...BCV
 
Financial Analysis - Veolia environnement operates utility and public tran…
Financial Analysis - Veolia environnement operates utility and public tran…Financial Analysis - Veolia environnement operates utility and public tran…
Financial Analysis - Veolia environnement operates utility and public tran…BCV
 
Goldman Sachs Conference London
Goldman Sachs Conference LondonGoldman Sachs Conference London
Goldman Sachs Conference LondonWEG
 
CS Conference 2012
CS Conference 2012CS Conference 2012
CS Conference 2012WEG
 
Financial Analysis - EDF SA (Electricite de France) produces, transmits, dist...
Financial Analysis - EDF SA (Electricite de France) produces, transmits, dist...Financial Analysis - EDF SA (Electricite de France) produces, transmits, dist...
Financial Analysis - EDF SA (Electricite de France) produces, transmits, dist...BCV
 
POINTWEST Careers
POINTWEST CareersPOINTWEST Careers
POINTWEST CareersPointwest
 
Second Annual Analysts & Investors Presentation - Financial Presentation
Second Annual Analysts & Investors Presentation - Financial PresentationSecond Annual Analysts & Investors Presentation - Financial Presentation
Second Annual Analysts & Investors Presentation - Financial PresentationEmbraer RI
 
2002* Segundo Encontro Anual Com Analistas E Investidores ApresentaçãO Fina...
2002* Segundo Encontro Anual Com Analistas E Investidores   ApresentaçãO Fina...2002* Segundo Encontro Anual Com Analistas E Investidores   ApresentaçãO Fina...
2002* Segundo Encontro Anual Com Analistas E Investidores ApresentaçãO Fina...Embraer RI
 

Ähnlich wie Financial Analysis - LinkedIn Corporation operates a social networking website used for professional networking. The Company's website allows members to post a profile of their professional expertise and accomplishments (20)

Financial analysis - MBIA Inc. provides financial guarantee insurance and …
Financial analysis - MBIA Inc. provides financial guarantee insurance and …Financial analysis - MBIA Inc. provides financial guarantee insurance and …
Financial analysis - MBIA Inc. provides financial guarantee insurance and …
 
Fundamental Analysis & Financial Analyst Recommandations - Google Inc - US382...
Fundamental Analysis & Financial Analyst Recommandations - Google Inc - US382...Fundamental Analysis & Financial Analyst Recommandations - Google Inc - US382...
Fundamental Analysis & Financial Analyst Recommandations - Google Inc - US382...
 
Financial Analysis - Facebook Inc. operates a social networking website. The ...
Financial Analysis - Facebook Inc. operates a social networking website. The ...Financial Analysis - Facebook Inc. operates a social networking website. The ...
Financial Analysis - Facebook Inc. operates a social networking website. The ...
 
Financial Analysis - Assured Guaranty Ltd. provides financial guaranty insura...
Financial Analysis - Assured Guaranty Ltd. provides financial guaranty insura...Financial Analysis - Assured Guaranty Ltd. provides financial guaranty insura...
Financial Analysis - Assured Guaranty Ltd. provides financial guaranty insura...
 
Financial Analysis - Zhejiang Expressway Co., ltd., through its subsidiari…
Financial Analysis - Zhejiang Expressway Co., ltd., through its subsidiari…Financial Analysis - Zhejiang Expressway Co., ltd., through its subsidiari…
Financial Analysis - Zhejiang Expressway Co., ltd., through its subsidiari…
 
Financial Analysis - Two Harbors Investment Corporation is a re…
Financial Analysis - Two Harbors Investment Corporation is a re…Financial Analysis - Two Harbors Investment Corporation is a re…
Financial Analysis - Two Harbors Investment Corporation is a re…
 
Financial Analysis - PetroChina Company Limited explores, develops, and produ...
Financial Analysis - PetroChina Company Limited explores, develops, and produ...Financial Analysis - PetroChina Company Limited explores, develops, and produ...
Financial Analysis - PetroChina Company Limited explores, develops, and produ...
 
Financial analysis cresud sacif y a is an argentine agricultural company, w...
Financial analysis   cresud sacif y a is an argentine agricultural company, w...Financial analysis   cresud sacif y a is an argentine agricultural company, w...
Financial analysis cresud sacif y a is an argentine agricultural company, w...
 
Financial analysis chesapeake energy corp - chesapeake energy corporation p...
Financial analysis   chesapeake energy corp - chesapeake energy corporation p...Financial analysis   chesapeake energy corp - chesapeake energy corporation p...
Financial analysis chesapeake energy corp - chesapeake energy corporation p...
 
Financial analysis adecoagro sa - adecoagro s.a. is an agricultural company...
Financial analysis   adecoagro sa - adecoagro s.a. is an agricultural company...Financial analysis   adecoagro sa - adecoagro s.a. is an agricultural company...
Financial analysis adecoagro sa - adecoagro s.a. is an agricultural company...
 
Presentation of 4 q06 results
Presentation of 4 q06 resultsPresentation of 4 q06 results
Presentation of 4 q06 results
 
Financial Analysis - China Communications Construction Company Ltd. is a tran...
Financial Analysis - China Communications Construction Company Ltd. is a tran...Financial Analysis - China Communications Construction Company Ltd. is a tran...
Financial Analysis - China Communications Construction Company Ltd. is a tran...
 
Financial Analysis - EFG Financial Products Holding AG provides financial ser...
Financial Analysis - EFG Financial Products Holding AG provides financial ser...Financial Analysis - EFG Financial Products Holding AG provides financial ser...
Financial Analysis - EFG Financial Products Holding AG provides financial ser...
 
Financial Analysis - Veolia environnement operates utility and public tran…
Financial Analysis - Veolia environnement operates utility and public tran…Financial Analysis - Veolia environnement operates utility and public tran…
Financial Analysis - Veolia environnement operates utility and public tran…
 
Goldman Sachs Conference London
Goldman Sachs Conference LondonGoldman Sachs Conference London
Goldman Sachs Conference London
 
CS Conference 2012
CS Conference 2012CS Conference 2012
CS Conference 2012
 
Financial Analysis - EDF SA (Electricite de France) produces, transmits, dist...
Financial Analysis - EDF SA (Electricite de France) produces, transmits, dist...Financial Analysis - EDF SA (Electricite de France) produces, transmits, dist...
Financial Analysis - EDF SA (Electricite de France) produces, transmits, dist...
 
POINTWEST Careers
POINTWEST CareersPOINTWEST Careers
POINTWEST Careers
 
Second Annual Analysts & Investors Presentation - Financial Presentation
Second Annual Analysts & Investors Presentation - Financial PresentationSecond Annual Analysts & Investors Presentation - Financial Presentation
Second Annual Analysts & Investors Presentation - Financial Presentation
 
2002* Segundo Encontro Anual Com Analistas E Investidores ApresentaçãO Fina...
2002* Segundo Encontro Anual Com Analistas E Investidores   ApresentaçãO Fina...2002* Segundo Encontro Anual Com Analistas E Investidores   ApresentaçãO Fina...
2002* Segundo Encontro Anual Com Analistas E Investidores ApresentaçãO Fina...
 

Mehr von BCV

Vers la couverture des risques systémiques
Vers la couverture des risques systémiquesVers la couverture des risques systémiques
Vers la couverture des risques systémiquesBCV
 
Le plus convexe des investissements linéaires
Le plus convexe des investissements linéairesLe plus convexe des investissements linéaires
Le plus convexe des investissements linéairesBCV
 
Keine angst vor zinsanstieg
Keine angst vor zinsanstiegKeine angst vor zinsanstieg
Keine angst vor zinsanstiegBCV
 
Des performances stables avec les certificats de primes de risque
Des performances stables avec les certificats de primes de risqueDes performances stables avec les certificats de primes de risque
Des performances stables avec les certificats de primes de risqueBCV
 
Evaluation de l'incidence des produits structurés sur les marchés actions
Evaluation de l'incidence des produits structurés sur les marchés actionsEvaluation de l'incidence des produits structurés sur les marchés actions
Evaluation de l'incidence des produits structurés sur les marchés actionsBCV
 
Erfolg ohne Absturzrisiko - Derivate machen es möglich
Erfolg ohne Absturzrisiko - Derivate machen es möglichErfolg ohne Absturzrisiko - Derivate machen es möglich
Erfolg ohne Absturzrisiko - Derivate machen es möglichBCV
 
Vers la couverture des risques systémiques?
Vers la couverture des risques systémiques?Vers la couverture des risques systémiques?
Vers la couverture des risques systémiques?BCV
 
qCIO Global Macro Hedge Fund Strategy - March 2015
qCIO Global Macro Hedge Fund Strategy - March 2015qCIO Global Macro Hedge Fund Strategy - March 2015
qCIO Global Macro Hedge Fund Strategy - March 2015BCV
 
qCIO Global Macro Hedge Fund Strategy - November 2014
qCIO Global Macro Hedge Fund Strategy - November 2014qCIO Global Macro Hedge Fund Strategy - November 2014
qCIO Global Macro Hedge Fund Strategy - November 2014BCV
 
Le Temps - 20 Octobre 2014 - Eclairage psychologique d'un choix rationnel
Le Temps - 20 Octobre 2014 - Eclairage psychologique d'un choix rationnelLe Temps - 20 Octobre 2014 - Eclairage psychologique d'un choix rationnel
Le Temps - 20 Octobre 2014 - Eclairage psychologique d'un choix rationnelBCV
 
Le Temps - 21 octobre 2013 - Benchmarker un produit structuré
Le Temps - 21 octobre 2013 - Benchmarker un produit structuréLe Temps - 21 octobre 2013 - Benchmarker un produit structuré
Le Temps - 21 octobre 2013 - Benchmarker un produit structuréBCV
 
Le temps - 30 juin 2014 - Des instruments plus flexibles dans l'obligataire
Le temps - 30 juin 2014 - Des instruments plus flexibles dans l'obligataireLe temps - 30 juin 2014 - Des instruments plus flexibles dans l'obligataire
Le temps - 30 juin 2014 - Des instruments plus flexibles dans l'obligataireBCV
 
INDICES Mai 2014 Produits financiers - Surévaluation de la volatilité implicit...
INDICES Mai 2014 Produits financiers - Surévaluation de la volatilité implicit...INDICES Mai 2014 Produits financiers - Surévaluation de la volatilité implicit...
INDICES Mai 2014 Produits financiers - Surévaluation de la volatilité implicit...BCV
 
Fundamental analysis & recommendations qms advisors flex index spi index - ...
Fundamental analysis & recommendations   qms advisors flex index spi index - ...Fundamental analysis & recommendations   qms advisors flex index spi index - ...
Fundamental analysis & recommendations qms advisors flex index spi index - ...BCV
 
Fundamental Analysis & Recommendations - QMS Advisors FlexIndex KOSPI 100
Fundamental Analysis & Recommendations - QMS Advisors FlexIndex KOSPI 100 Fundamental Analysis & Recommendations - QMS Advisors FlexIndex KOSPI 100
Fundamental Analysis & Recommendations - QMS Advisors FlexIndex KOSPI 100 BCV
 
Fundamental Equity Analysis - QMS Advisors HDAX FlexIndex 110
Fundamental Equity Analysis - QMS Advisors HDAX FlexIndex 110Fundamental Equity Analysis - QMS Advisors HDAX FlexIndex 110
Fundamental Equity Analysis - QMS Advisors HDAX FlexIndex 110BCV
 
Fundamental Analysis & Recommendations - OEX Index - The Standard & Poor's 10...
Fundamental Analysis & Recommendations - OEX Index - The Standard & Poor's 10...Fundamental Analysis & Recommendations - OEX Index - The Standard & Poor's 10...
Fundamental Analysis & Recommendations - OEX Index - The Standard & Poor's 10...BCV
 
Fundamental analysis & recommendations spi index - the swiss performance in...
Fundamental analysis & recommendations   spi index - the swiss performance in...Fundamental analysis & recommendations   spi index - the swiss performance in...
Fundamental analysis & recommendations spi index - the swiss performance in...BCV
 
Fundamental Equity Analysis - QMS Global Agriculture FlexIndex - The QMS Advi...
Fundamental Equity Analysis - QMS Global Agriculture FlexIndex - The QMS Advi...Fundamental Equity Analysis - QMS Global Agriculture FlexIndex - The QMS Advi...
Fundamental Equity Analysis - QMS Global Agriculture FlexIndex - The QMS Advi...BCV
 
Fundamental Equity Analysis and Analyst Recommandations - MSCI Emerging Marke...
Fundamental Equity Analysis and Analyst Recommandations - MSCI Emerging Marke...Fundamental Equity Analysis and Analyst Recommandations - MSCI Emerging Marke...
Fundamental Equity Analysis and Analyst Recommandations - MSCI Emerging Marke...BCV
 

Mehr von BCV (20)

Vers la couverture des risques systémiques
Vers la couverture des risques systémiquesVers la couverture des risques systémiques
Vers la couverture des risques systémiques
 
Le plus convexe des investissements linéaires
Le plus convexe des investissements linéairesLe plus convexe des investissements linéaires
Le plus convexe des investissements linéaires
 
Keine angst vor zinsanstieg
Keine angst vor zinsanstiegKeine angst vor zinsanstieg
Keine angst vor zinsanstieg
 
Des performances stables avec les certificats de primes de risque
Des performances stables avec les certificats de primes de risqueDes performances stables avec les certificats de primes de risque
Des performances stables avec les certificats de primes de risque
 
Evaluation de l'incidence des produits structurés sur les marchés actions
Evaluation de l'incidence des produits structurés sur les marchés actionsEvaluation de l'incidence des produits structurés sur les marchés actions
Evaluation de l'incidence des produits structurés sur les marchés actions
 
Erfolg ohne Absturzrisiko - Derivate machen es möglich
Erfolg ohne Absturzrisiko - Derivate machen es möglichErfolg ohne Absturzrisiko - Derivate machen es möglich
Erfolg ohne Absturzrisiko - Derivate machen es möglich
 
Vers la couverture des risques systémiques?
Vers la couverture des risques systémiques?Vers la couverture des risques systémiques?
Vers la couverture des risques systémiques?
 
qCIO Global Macro Hedge Fund Strategy - March 2015
qCIO Global Macro Hedge Fund Strategy - March 2015qCIO Global Macro Hedge Fund Strategy - March 2015
qCIO Global Macro Hedge Fund Strategy - March 2015
 
qCIO Global Macro Hedge Fund Strategy - November 2014
qCIO Global Macro Hedge Fund Strategy - November 2014qCIO Global Macro Hedge Fund Strategy - November 2014
qCIO Global Macro Hedge Fund Strategy - November 2014
 
Le Temps - 20 Octobre 2014 - Eclairage psychologique d'un choix rationnel
Le Temps - 20 Octobre 2014 - Eclairage psychologique d'un choix rationnelLe Temps - 20 Octobre 2014 - Eclairage psychologique d'un choix rationnel
Le Temps - 20 Octobre 2014 - Eclairage psychologique d'un choix rationnel
 
Le Temps - 21 octobre 2013 - Benchmarker un produit structuré
Le Temps - 21 octobre 2013 - Benchmarker un produit structuréLe Temps - 21 octobre 2013 - Benchmarker un produit structuré
Le Temps - 21 octobre 2013 - Benchmarker un produit structuré
 
Le temps - 30 juin 2014 - Des instruments plus flexibles dans l'obligataire
Le temps - 30 juin 2014 - Des instruments plus flexibles dans l'obligataireLe temps - 30 juin 2014 - Des instruments plus flexibles dans l'obligataire
Le temps - 30 juin 2014 - Des instruments plus flexibles dans l'obligataire
 
INDICES Mai 2014 Produits financiers - Surévaluation de la volatilité implicit...
INDICES Mai 2014 Produits financiers - Surévaluation de la volatilité implicit...INDICES Mai 2014 Produits financiers - Surévaluation de la volatilité implicit...
INDICES Mai 2014 Produits financiers - Surévaluation de la volatilité implicit...
 
Fundamental analysis & recommendations qms advisors flex index spi index - ...
Fundamental analysis & recommendations   qms advisors flex index spi index - ...Fundamental analysis & recommendations   qms advisors flex index spi index - ...
Fundamental analysis & recommendations qms advisors flex index spi index - ...
 
Fundamental Analysis & Recommendations - QMS Advisors FlexIndex KOSPI 100
Fundamental Analysis & Recommendations - QMS Advisors FlexIndex KOSPI 100 Fundamental Analysis & Recommendations - QMS Advisors FlexIndex KOSPI 100
Fundamental Analysis & Recommendations - QMS Advisors FlexIndex KOSPI 100
 
Fundamental Equity Analysis - QMS Advisors HDAX FlexIndex 110
Fundamental Equity Analysis - QMS Advisors HDAX FlexIndex 110Fundamental Equity Analysis - QMS Advisors HDAX FlexIndex 110
Fundamental Equity Analysis - QMS Advisors HDAX FlexIndex 110
 
Fundamental Analysis & Recommendations - OEX Index - The Standard & Poor's 10...
Fundamental Analysis & Recommendations - OEX Index - The Standard & Poor's 10...Fundamental Analysis & Recommendations - OEX Index - The Standard & Poor's 10...
Fundamental Analysis & Recommendations - OEX Index - The Standard & Poor's 10...
 
Fundamental analysis & recommendations spi index - the swiss performance in...
Fundamental analysis & recommendations   spi index - the swiss performance in...Fundamental analysis & recommendations   spi index - the swiss performance in...
Fundamental analysis & recommendations spi index - the swiss performance in...
 
Fundamental Equity Analysis - QMS Global Agriculture FlexIndex - The QMS Advi...
Fundamental Equity Analysis - QMS Global Agriculture FlexIndex - The QMS Advi...Fundamental Equity Analysis - QMS Global Agriculture FlexIndex - The QMS Advi...
Fundamental Equity Analysis - QMS Global Agriculture FlexIndex - The QMS Advi...
 
Fundamental Equity Analysis and Analyst Recommandations - MSCI Emerging Marke...
Fundamental Equity Analysis and Analyst Recommandations - MSCI Emerging Marke...Fundamental Equity Analysis and Analyst Recommandations - MSCI Emerging Marke...
Fundamental Equity Analysis and Analyst Recommandations - MSCI Emerging Marke...
 

Financial Analysis - LinkedIn Corporation operates a social networking website used for professional networking. The Company's website allows members to post a profile of their professional expertise and accomplishments

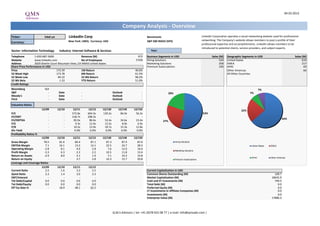
  • 1. 04.03.2013 Company Analysis - Overview Ticker: lnkd un LinkedIn Corp Benchmark: LinkedIn Corporation operates a social networking website used for professional New York: LNKD, Currency: USD S&P 500 INDEX (SPX) networking. The Company's website allows members to post a profile of their Currency: professional expertise and accomplishments. LinkedIn allows members to be introduced to potential clients, service providers, and subject experts. Sector: Information Technology Industry: Internet Software & Services Year: Telephone 1-650-687-3600 Revenue (M) 972 Business Segments in USD Sales (M) Geographic Segments in USD Sales (M) Website www.linkedin.com No of Employees 3'458 Hiring Solutions 524 United States 619 Address 2029 Stierlin Court Mountain View, CA 94043 United States Marketing Solutions 258 EMEA 217 Share Price Performance in USD Premium Subscriptions 190 APAC 69 Price 173.39 1M Return 40.6% Other Americas 66 52 Week High 173.78 6M Return 61.5% All Other Countries 52 Week Low 84.10 52 Wk Return 98.2% 52 Wk Beta 1.33 YTD Return 51.0% Credit Ratings Bloomberg IG4 7% S&P - Date - Outlook - 20% 7% Moody's - Date - Outlook - Fitch - Date - Outlook - Valuation Ratios 12/09 12/10 12/11 12/12 12/13E 12/14E 12/15E 22% P/E - - 572.8x 604.3x 130.2x 84.0x 56.2x 53% EV/EBIT - - 218.7x 208.3x - - - EV/EBITDA - - 82.0x 86.6x 53.4x 34.6x 23.4x 64% 27% P/S - - 9.3x 12.4x 12.5x 8.9x 6.9x P/B - - 10.2x 13.9x 18.7x 15.3x 12.8x Div Yield - - 0.0% 0.0% 0.0% 0.0% 0.0% Profitability Ratios % 12/09 12/10 12/11 12/12 12/13E 12/14E 12/15E Gross Margin 78.5 81.6 84.4 87.1 87.3 87.4 87.6 Hiring Solutions EBITDA Margin 7.1 16.1 13.2 14.1 22.5 24.7 28.3 United States EMEA Operating Margin -2.8 8.1 4.9 5.8 7.6 12.0 16.0 Marketing Solutions Profit Margin -3.3 6.3 2.3 2.2 10.5 11.8 13.4 Return on Assets -2.9 8.0 2.1 1.9 7.1 10.3 14.8 APAC Other Americas Return on Equity - - 3.7 2.8 10.3 15.7 20.8 Premium Subscriptions Leverage and Coverage Ratios 12/09 12/10 12/11 12/12 Current Ratio 2.5 1.6 3.2 2.5 Current Capitalization in USD Quick Ratio 2.3 1.4 3.0 2.3 Common Shares Outstanding (M) 109.7 EBIT/Interest - - - - Market Capitalization (M) 18635.9 Tot Debt/Capital 0.0 0.0 0.0 0.0 Cash and ST Investments (M) 749.5 Tot Debt/Equity 0.0 0.0 0.0 0.0 Total Debt (M) 0.0 Eff Tax Rate % - 18.9 48.1 62.2 Preferred Equity (M) 0.0 LT Investments in Affiliate Companies (M) 0.0 Investments (M) 0.0 Enterprise Value (M) 17886.3 Q.M.S Advisors | tel: +41 (0)78 922 08 77 | e-mail: info@qmsadv.com |
  • 2. Company Analysis - Analysts Ratings LinkedIn Corp Target price in USD Broker Recommendation Buy and Sell Recommendations vs Price and Target Price Price Brokers' Target Price 200 250 100% 5% 4% 4% 0% 0% 0% 0% 0% 0% 0% 0% 0% 180 35% 160 200 80% 42% 39% 39% 40% 39% 39% 41% 38% 44% 40% 48% 140 150 60% 120 100 100 40% 80 61% 61% 60% 65% 61% 61% 59% 60 50 57% 56% 58% 52% 52% 20% 40 0 20 Telsey Advisory Morgan Stanley Genuity Corp Barclays Fitzgerald Lazard Capital BMO Capital Piper Jaffray Daiwa Securities Raymond James Securities (USA) Evercore Macquarie Sterne, Agee & Partners LLC Securities Inc JPMorgan Cowen and Securities Financial Group Needham & Co EVA Dimensions IPOfinancial.com Robinson Argus Research Goldman Sachs Jefferies William Blair & Wedge Partners Wunderlich Wedbush SunTrust Montrose Partners Securities Company Credit Agricole Susquehanna Canaccord Cantor Northland Avondale Markets Markets 0% 0 Co. Ltd. Leach Group Corp Co mars.12 avr.12 mai.12 juin.12 juil.12 août.12 sept.12 oct.12 nov.12 déc.12 janv.13 févr.13 Buy Hold Sell Price Target Price Date Buy Hold Sell Date Price Target Price Broker Analyst Recommendation Target Date 28-Feb-13 52% 48% 0% 4-Mar-13 173.39 158.42 Cantor Fitzgerald YOUSSEF H SQUALI hold 143.00 1-Mar-13 31-Jan-13 59% 41% 0% 1-Mar-13 170.46 158.42 Wunderlich Securities BLAKE T HARPER buy 195.00 27-Feb-13 31-Dec-12 61% 39% 0% 28-Feb-13 168.18 158.42 Evercore Partners KEN SENA overweight 200.00 27-Feb-13 30-Nov-12 61% 39% 0% 27-Feb-13 168.55 158.42 Morgan Stanley SCOTT W DEVITT Overwt/Attractive 180.00 26-Feb-13 31-Oct-12 65% 35% 0% 26-Feb-13 157.77 156.32 SunTrust Robinson Humphrey SO YOUNG LEE buy 150.00 21-Feb-13 28-Sep-12 60% 40% 0% 25-Feb-13 156.05 156.32 Daiwa Securities Co. Ltd. KAZUYA NISHIMURA neutral 165.00 19-Feb-13 31-Aug-12 61% 39% 0% 22-Feb-13 160.44 156.32 Canaccord Genuity Corp MICHAEL GRAHAM buy 150.00 18-Feb-13 31-Jul-12 61% 39% 0% 21-Feb-13 157.36 156.32 Argus Research Corp JOSEPH F BONNER hold 11-Feb-13 29-Jun-12 58% 42% 0% 20-Feb-13 158.09 156.32 Avondale Partners LLC RANDLE G REECE market outperform 180.00 11-Feb-13 31-May-12 56% 40% 4% 19-Feb-13 160.76 155.53 Northland Securities Inc BILL SUTHERLAND market perform 145.00 11-Feb-13 30-Apr-12 52% 44% 4% 18-Feb-13 162.66 153.00 Telsey Advisory Group THOMAS FORTE no rating system 165.00 10-Feb-13 30-Mar-12 57% 38% 5% 15-Feb-13 162.66 153.00 BMO Capital Markets DANIEL SALMON market perform 130.00 8-Feb-13 14-Feb-13 161.34 153.00 JPMorgan DOUGLAS ANMUTH overweight 163.00 8-Feb-13 13-Feb-13 157.71 153.00 Jefferies BRIAN J PITZ buy 175.00 8-Feb-13 12-Feb-13 155.00 153.00 Needham & Co KERRY RICE hold 8-Feb-13 11-Feb-13 155.41 153.00 Wedbush MICHAEL PACHTER neutral 140.00 8-Feb-13 8-Feb-13 150.48 151.42 Raymond James AARON M KESSLER market perform 8-Feb-13 7-Feb-13 124.09 134.72 Macquarie THOMAS WHITE outperform 160.00 8-Feb-13 6-Feb-13 125.77 133.71 Sterne, Agee & Leach ARVIND BHATIA neutral 8-Feb-13 5-Feb-13 124.45 133.31 Cowen and Company JOHN BLACKLEDGE neutral 8-Feb-13 4-Feb-13 123.30 133.31 Lazard Capital Markets WILLIAM BIRD neutral 8-Feb-13 1-Feb-13 123.82 135.00 Susquehanna Financial Group DEEPAK MATHIVANAN Positive 155.00 8-Feb-13 31-Jan-13 123.79 135.00 Piper Jaffray EUGENE E MUNSTER overweight 176.00 8-Feb-13 30-Jan-13 123.46 135.00 Credit Agricole Securities (USA) JAMES LEE buy 161.00 8-Feb-13 29-Jan-13 124.53 135.00 Barclays MARK MAY equalweight 135.00 8-Feb-13 28-Jan-13 127.20 135.00 Wedge Partners MARTIN PYYKKONEN no rating system 8-Feb-13 25-Jan-13 123.78 135.00 William Blair & Co TIMOTHY J MCHUGH market perform 7-Feb-13 24-Jan-13 121.22 135.00 EVA Dimensions ANDREW S ZAMFOTIS hold 15-Jan-13 23-Jan-13 120.26 135.00 Goldman Sachs HEATH P TERRY buy/attractive 157.00 3-Aug-12 22-Jan-13 119.29 135.00 IPOfinancial.com TEAM COVERAGE buy 17-Feb-12 Q.M.S Advisors | tel: +41 (0)78 922 08 77 | e-mail: info@qmsadv.com |
  • 3. 04.03.2013 LinkedIn Corp Company Analysis - Ownership Ownership Type Ownership Statistics Geographic Ownership Distribution Geographic Ownership 1% 2% Shares Outstanding (M) 109.7 United States 93.97% 1% 1%0% 0% Float 98.5% Britain 1.34% 1% 1% Short Interest (M) 4.5 Canada 0.99% 1% Short Interest as % of Float 4.17% Japan 0.86% Days to Cover Shorts 1.13 Unknown Country 0.75% Institutional Ownership 101.52% Switzerland 0.44% Retail Ownership -2.28% Luxembourg 0.44% Insider Ownership 0.76% Others 1.20% Institutional Ownership Distribution 97% 95% Investment Advisor 87.38% Hedge Fund Manager 8.60% Pension Fund (Erisa) 0.97% United States Britain Canada Institutional Ownership Retail Ownership Insider Ownership Individual 0.75% Japan Unknown Country Switzerland Pricing data is in USD Others 2.32% Luxembourg Others Top 20 Owners: TOP 20 ALL Institutional Ownership Holder Name Position Position Change Market Value % of Ownership Report Date Source Country T ROWE PRICE ASSOCIA 7'833'170 1'466'654 1'358'193'346 8.75% 31.12.2012 13F UNITED STATES 1% 2% 1% JENNISON ASSOCIATES 7'705'593 82'273 1'336'072'770 8.61% 31.12.2012 13F UNITED STATES FMR LLC 5'083'134 2'948'557 881'364'604 5.68% 31.12.2012 ULT-AGG UNITED STATES 9% MORGAN STANLEY 4'016'541 -434'658 696'428'044 4.49% 31.12.2012 ULT-AGG UNITED STATES AMERIPRISE FINANCIAL 3'998'973 175'610 693'381'928 4.47% 31.12.2012 13F UNITED STATES JP MORGAN 3'703'400 981'364 642'132'526 4.14% 31.12.2012 ULT-AGG VANGUARD GROUP INC 3'578'026 720'002 620'393'928 4.00% 31.12.2012 13F UNITED STATES WELLINGTON MANAGEMEN 3'413'977 727'331 591'949'472 3.81% 31.12.2012 13F UNITED STATES CAPITAL GROUP COMPAN 2'544'120 20'000 441'124'967 2.84% 31.12.2012 ULT-AGG UNITED STATES BLACKROCK 2'427'438 132'541 420'893'475 2.71% 28.02.2013 ULT-AGG UNITED STATES 87% HARBOR CAPITAL ADVIS 2'381'116 10'273 412'861'703 2.66% 31.12.2012 MF-AGG UNITED STATES ALLIANCE BERNSTEIN 1'721'263 965'169 298'449'792 1.92% 31.12.2012 ULT-AGG UNITED STATES ARTISAN PARTNERS HOL 1'598'200 259'900 277'111'898 1.79% 31.12.2012 13F UNITED STATES AMERICAN CENTURY COM 1'444'680 291'230 250'493'065 1.61% 31.12.2012 13F UNITED STATES Investment Advisor Hedge Fund Manager Pension Fund (Erisa) Individual Others MANAGED ACCOUNT ADVI 1'407'827 -237'663 244'103'124 1.57% 31.12.2012 13F UNITED STATES WELLS FARGO 1'312'350 640'126 227'548'367 1.47% 31.12.2012 ULT-AGG FRANKLIN RESOURCES 1'277'750 581'660 221'549'073 1.43% 31.12.2012 ULT-AGG UNITED STATES STATE STREET 1'072'678 68'511 185'991'638 1.20% 01.03.2013 ULT-AGG UNITED STATES GILDER GAGNON HOWE 1'047'375 -133'817 181'604'351 1.17% 31.12.2012 13F UNITED STATES NEUBERGER BERMAN LLC 1'014'523 -983'863 175'908'143 1.13% 31.12.2012 13F UNITED STATES Top 5 Insiders: Holder Name Position Position Change Market Value % of Ownership Report Date Source SZE DAVID 409'557 -15'937 71'013'088 0.46% 19.02.2013 Form 4 WEINER JEFFREY 85'770 -3'303 14'871'660 0.10% 19.02.2013 Form 4 SORDELLO STEVEN J 41'268 -1'211 7'155'459 0.05% 19.02.2013 Form 4 NISHAR DIPCHAND 37'620 -12'500 6'522'932 0.04% 20.02.2013 Form 4 HENKE DAVID 35'758 6'200'080 0.04% 05.02.2013 Form 4 Q.M.S Advisors | tel: +41 (0)78 922 08 77 | e-mail: info@qmsadv.com |
  • 4. Company Analysis - Financials I/IV LinkedIn Corp Financial information is in USD (M) Equivalent Estimates Periodicity: Fiscal Year 12/02 12/03 12/04 12/05 12/06 12/07 12/08 12/09 12/10 12/11 12/12 12/13E 12/14E 12/15E Income Statement Revenue 32 79 120 243 522 972 1'491 2'088 2'702 - Cost of Goods Sold 7 19 26 45 81 126 Gross Income 25 60 94 198 441 847 1'302 1'826 2'367 - Selling, General & Admin Expenses 26 66 98 179 415 790 (Research & Dev Costs) 12 29 39 65 132 257 Operating Income -0 -6 -3 20 26 57 114 250 433 - Interest Expense 0 0 0 0 0 0 - Foreign Exchange Losses (Gains) 0 0 0 0 0 0 - Net Non-Operating Losses (Gains) -1 -1 -0 1 3 -0 Pretax Income 0 -4 -3 19 23 57 176 324 521 - Income Tax Expense 0 0 1 4 11 36 Income Before XO Items 0 -5 -4 15 12 22 - Extraordinary Loss Net of Tax 0 0 0 0 0 0 - Minority Interests 0 0 0 0 0 0 Diluted EPS Before XO Items 0.00 (0.11) (0.10) 0.07 0.11 0.19 Net Income Adjusted* 7 28 156 247 361 EPS Adjusted 0.06 0.25 1.33 2.06 3.08 Dividends Per Share 0.00 0.00 0.00 0.00 0.00 0.00 0.00 0.00 0.00 Payout Ratio % 0.0 0.0 0.0 0.00 0.00 0.00 Total Shares Outstanding 42 42 43 101 110 Diluted Shares Outstanding 39 42 41 46 104 113 EBITDA 2 1 8 39 69 137 335 517 765 *Net income excludes extraordinary gains and losses and one-time charges. Q.M.S Advisors | tel: +41 (0)78 922 08 77 | e-mail: info@qmsadv.com |
  • 5. Company Analysis - Financials II/IV Periodicity: 12/02 12/03 12/04 12/05 12/06 12/07 12/08 12/09 12/10 12/11 12/12 12/13E 12/14E 12/15E Balance Sheet Total Current Assets 99.211 121.158 172.206 725.927 1018.797 + Cash & Near Cash Items 80 90 93 339 270 + Short Term Investments 0 0 0 238 479 + Accounts & Notes Receivable 15 24 58 111 204 + Inventories 0 0 0 0 0 + Other Current Assets 4 7 21 37 66 Total Long-Term Assets 23 27 66 148 364 + Long Term Investments 0 0 0 Gross Fixed Assets 31 47 95 192 328 Accumulated Depreciation 9 21 38 77 142 + Net Fixed Assets 22 26 57 115 187 + Other Long Term Assets 1 2 9 33 177 Total Current Liabilities 28 49 105 227 415 + Accounts Payable 3 5 2 28 54 + Short Term Borrowings 0 0 0 0 0 + Other Short Term Liabilities 25 44 103 198 362 Total Long Term Liabilities 1 2 8 22 59 + Long Term Borrowings 0 1 2 0 0 + Other Long Term Borrowings 1 2 7 22 59 Total Liabilities 29 51 114 249 474 + Long Preferred Equity 103 103 104 0 + Minority Interest 0 0 0 0 + Share Capital & APIC 6 14 25 618 879 + Retained Earnings & Other Equity -16 -20 -5 7 29 Total Shareholders Equity 93 97 124 625 908 Total Liabilities & Equity 122 149 238 874 1'382 Book Value Per Share -0.24 -0.15 0.47 6.16 8.28 9.28 11.31 13.50 Tangible Book Value Per Share -0.26 -0.16 0.35 5.96 6.93 Q.M.S Advisors | tel: +41 (0)78 922 08 77 | e-mail: info@qmsadv.com |
  • 6. Company Analysis - Financials III/IV Periodicity: 12/02 12/03 12/04 12/05 12/06 12/07 12/08 12/09 12/10 12/11 12/12 12/13E 12/14E 12/15E Cash Flows Net Income 0 -5 -4 15 12 22 38 108 250 + Depreciation & Amortization 2 6 12 20 43 80 + Other Non-Cash Adjustments 2 5 7 11 31 51 + Changes in Non-Cash Capital 3 2 7 9 47 114 Cash From Operating Activities 8 9 21 54 133 267 + Disposal of Fixed Assets 0 0 + Capital Expenditures -8 -20 -13 -50 -89 -125 -183 -216 -256 + Increase in Investments -251 -444 + Decrease in Investments 12 199 + Other Investing Activities -1 0 -6 -10 -62 Cash From Investing Activities -8 -20 -13 -56 -338 -433 + Dividends Paid 0 0 + Change in Short Term Borrowings 0 0 + Increase in Long Term Borrowings 0 0 + Decrease in Long Term Borrowings 0 0 + Increase in Capital Stocks 15 78 2 5 269 97 + Decrease in Capital Stocks -0 -4 -1 -0 -0 -0 + Other Financing Activities -0 -0 0 -0 183 0 Cash From Financing Activities 14 74 1 4 451 97 Net Changes in Cash 14 63 9 3 246 -69 Free Cash Flow (CFO-CAPEX) -0 -10 8 4 44 142 164 241 326 Free Cash Flow To Firm -0 4 44 142 Free Cash Flow To Equity Free Cash Flow per Share -0.01 -0.25 0.20 0.10 0.58 1.35 Q.M.S Advisors | tel: +41 (0)78 922 08 77 | e-mail: info@qmsadv.com |
  • 7. Company Analysis - Financials IV/IV Periodicity: 12/02 12/03 12/04 12/05 12/06 12/07 12/08 12/09 12/10 12/11 12/12 12/13E 12/14E 12/15E Ratio Analysis Valuation Ratios Price Earnings 572.8x 604.3x 130.2x 84.0x 56.2x EV to EBIT 218.7x 208.3x EV to EBITDA 82.0x 86.6x 53.4x 34.6x 23.4x Price to Sales 9.3x 12.4x 12.5x 8.9x 6.9x Price to Book 10.2x 13.9x 18.7x 15.3x 12.8x Dividend Yield 0.0% 0.0% 0.0% 0.0% 0.0% Profitability Ratios Gross Margin 77.3% 76.4% 78.5% 81.6% 84.4% 87.1% 87.3% 87.4% 87.6% EBITDA Margin 5.2% 1.1% 7.1% 16.1% 13.2% 14.1% 22.5% 24.7% 28.3% Operating Margin -1.3% -7.0% -2.8% 8.1% 4.9% 5.8% 7.6% 12.0% 16.0% Profit Margin 1.0% -5.7% -3.3% 6.3% 2.3% 2.2% 10.5% 11.8% 13.4% Return on Assets -2.9% 8.0% 2.1% 1.9% 7.1% 10.3% 14.8% Return on Equity 3.7% 2.8% 10.3% 15.7% 20.8% Leverage & Coverage Ratios Current Ratio 3.58 2.46 1.63 3.20 2.45 Quick Ratio 3.44 2.32 1.43 3.04 2.29 Interest Coverage Ratio (EBIT/I) -36.00 Tot Debt/Capital 0.00 0.01 0.01 0.00 0.00 Tot Debt/Equity 0.00 0.01 0.01 0.00 0.00 Others Asset Turnover 0.89 1.26 0.94 0.86 Accounts Receivable Turnover 6.11 5.89 6.16 6.17 Accounts Payable Turnover 6.96 12.84 5.38 3.07 Inventory Turnover Effective Tax Rate 3.8% 18.9% 48.1% 62.2% Q.M.S Advisors | tel: +41 (0)78 922 08 77 | e-mail: info@qmsadv.com |
  • 8. Company Analysis - Peers Comparision MONSTER LINKEDIN CORP-A FACEBOOK INC-A GOOGLE INC-CL A YAHOO! INC EBAY INC AMAZON.COM INC YELP INC GROUPON INC ZYNGA INC- CL A WORLDWID Latest Fiscal Year: 12/2012 12/2012 12/2012 12/2012 12/2012 12/2012 12/2012 12/2012 12/2012 12/2012 52-Week High 173.78 45.00 10.40 814.47 22.62 57.27 284.72 31.96 19.21 14.48 52-Week High Date 04.03.2013 18.05.2012 26.03.2012 04.03.2013 04.03.2013 01.02.2013 25.01.2013 28.03.2012 05.03.2012 21.03.2012 52-Week Low 84.10 17.55 4.94 556.52 14.35 34.83 178.04 14.10 2.60 2.09 52-Week Low Date 06.03.2012 04.09.2012 04.03.2013 14.06.2012 06.03.2012 06.03.2012 06.03.2012 04.06.2012 12.11.2012 09.11.2012 Daily Volume 166'440 12'825'634 442'852 887'636 10'465'454 2'539'774 732'834 201'086 11'541'690 15'699'751 Current Price (3/dd/yy) 173.39 27.55 4.96 813.54 22.36 54.59 268.84 22.68 5.24 3.55 52-Week High % Change -0.2% -38.8% -52.3% -0.1% -1.2% -4.7% -5.6% -29.0% -72.7% -75.5% 52-Week Low % Change 106.2% 57.0% 0.4% 46.2% 55.8% 56.7% 51.0% 60.9% 101.5% 69.9% Total Common Shares (M) 109.7 2'372.0 111.1 330.0 1'182.7 1'294.0 454.0 63.5 656.9 779.3 Market Capitalization 18'637.7 65'627.8 579.5 269'393.6 26'439.6 70'776.6 122'201.5 1'435.6 3'436.0 2'788.5 Total Debt - 2'356.0 164.2 5'537.0 - 4'519.0 4'218.0 - - 100.0 Preferred Stock - - - - - - - - - - Minority Interest - - - - 45.4 - - - (1.9) - Cash and Equivalents 749.5 9'626.0 148.2 49'557.0 6'022.4 9'408.0 11'448.0 95.1 1'209.3 1'652.3 Enterprise Value 17'888.1 58'357.8 595.6 225'373.5 20'462.6 65'887.6 114'971.5 1'340.5 2'224.7 1'236.2 Valuation Total Revenue LFY 972.3 5'089.0 890.4 50'175.0 4'986.6 14'072.0 61'093.0 137.6 2'334.5 1'281.3 LTM 972.3 5'089.0 916.0 51'379.0 4'986.6 14'071.0 61'093.0 137.6 2'334.5 1'281.3 CY+1 1'490.8 6'677.7 831.8 49'451.2 4'674.1 16'345.5 75'751.6 211.4 2'561.5 1'057.4 CY+2 2'088.2 8'434.7 849.6 57'163.0 4'845.7 18'730.9 93'067.6 294.9 2'833.0 1'101.9 EV/Total Revenue LFY 12.2x 11.0x 0.7x 3.8x 3.5x 4.3x 1.7x 8.0x 0.8x 0.2x LTM 12.2x 11.0x 0.7x 3.7x 3.5x 4.3x 1.7x 8.0x 0.8x 0.2x CY+1 11.9x 8.5x 0.6x 4.4x 4.6x 3.9x 1.5x 6.3x 0.8x 1.4x CY+2 8.4x 6.6x 0.5x 3.6x 4.2x 3.2x 1.2x 4.4x 0.6x 1.3x EBITDA LFY 136.7 1'187.0 142.5 15'722.0 1'457.1 4'088.0 2'835.0 (10.3) 155.4 54.0 LTM 136.7 1'187.0 118.0 15'684.0 1'457.1 4'090.0 2'834.0 (10.3) 143.7 54.0 CY+1 335.2 3'400.1 152.4 22'087.3 1'664.4 5'383.4 4'646.4 21.1 254.9 58.9 CY+2 516.7 4'479.8 161.4 25'944.5 1'740.8 6'241.8 6'384.0 46.6 319.3 122.6 EV/EBITDA LFY 86.6x 47.1x 4.5x 12.0x 12.0x 14.9x 37.6x -107.2x 12.8x 5.3x LTM 86.6x 47.1x 5.4x 12.1x 12.0x 14.9x 37.6x - 13.8x 5.3x CY+1 53.1x 16.7x 3.3x 10.0x 12.9x 11.9x 24.6x 62.7x 7.8x 25.8x CY+2 33.9x 12.3x 2.4x 7.9x 11.7x 9.6x 17.1x 27.8x 5.2x 11.5x EPS LFY 0.19 0.01 0.71 34.02 1.17 1.95 0.05 -0.33 -0.03 -0.20 LTM 0.19 0.02 0.21 33.74 1.17 1.94 0.36 -0.44 -0.08 -0.23 CY+1 1.33 0.57 0.36 45.71 1.16 2.75 3.13 0.09 0.20 (0.04) CY+2 2.06 0.78 0.42 53.86 1.27 3.21 5.54 0.37 0.29 0.00 P/E LFY 912.6x 1377.5x 23.6x 24.1x 19.1x 28.1x 746.8x - - - LTM 912.6x 1377.5x 23.6x 24.1x 19.1x 28.1x 746.8x - - - CY+1 130.2x 48.2x 13.9x 17.8x 19.4x 19.8x 85.9x 257.7x 26.3x - CY+2 84.0x 35.2x 11.8x 15.1x 17.6x 17.0x 48.6x 61.6x 18.1x 3550.0x Revenue Growth 1 Year 86.2% 37.1% (10.4%) 32.4% 0.0% 20.8% 27.1% 65.2% 45.0% 12.4% 5 Year - - (8.6%) 24.7% (5.8%) 13.7% 30.6% - - - EBITDA Growth 1 Year 98.3% (42.9%) (17.7%) 15.7% (1.1%) 23.4% 45.8% 13.9% - - 5 Year 141.2% - (12.8%) 21.0% 1.5% 9.4% 25.8% - - - EBITDA Margin LTM 14.1% 23.3% 12.9% 30.5% 29.2% 29.1% 4.6% (7.5%) 6.2% 4.2% CY+1 22.5% 50.9% 18.3% 44.7% 35.6% 32.9% 6.1% 10.0% 10.0% 5.6% CY+2 24.7% 53.1% 19.0% 45.4% 35.9% 33.3% 6.9% 15.8% 11.3% 11.1% Leverage/Coverage Ratios Total Debt / Equity % 0.0% 20.0% 18.7% 7.7% 0.0% 21.7% 51.5% 0.0% 0.0% 5.5% FALSE FALSE FALSE FALSE FALSE Total Debt / Capital % 0.0% 16.7% 15.7% 7.2% 0.0% 17.8% 34.0% 0.0% 0.0% 5.2% FALSE FALSE FALSE FALSE FALSE Total Debt / EBITDA 0.000x 1.985x 1.392x 0.353x 0.000x 1.105x 1.488x - 0.000x 1.852x FALSE FALSE FALSE FALSE FALSE Net Debt / EBITDA -5.483x -6.125x 0.136x -2.807x -4.133x -1.195x -2.551x - -8.416x -28.746x FALSE FALSE FALSE FALSE FALSE EBITDA / Int. Expense - 23.275x - 187.167x - 64.889x 30.815x - - - FALSE FALSE FALSE FALSE FALSE Credit Ratings S&P LT Credit Rating - - - AA NR A AA- - - - FALSE FALSE FALSE FALSE FALSE S&P LT Credit Rating Date - - - 19.11.2012 18.04.2008 02.03.2010 26.11.2012 - - - FALSE FALSE FALSE FALSE FALSE Moody's LT Credit Rating - - - Aa2 - A2 Baa1 - - - FALSE FALSE FALSE FALSE FALSE Moody's LT Credit Rating Date - - - 16.05.2011 - 21.10.2010 26.11.2012 - - - FALSE FALSE FALSE FALSE FALSE Q.M.S Advisors | tel: +41 (0)78 922 08 77 | e-mail: info@qmsadv.com |