BE 500 Index - Dividends and Implied Volatility Surfaces Parameters
•
0 gefällt mir•448 views

BE 500 Index - Dividends and Implied Volatility Surfaces Parameters

Empfohlen
Empfohlen
Weitere ähnliche Inhalte
Was ist angesagt?
Was ist angesagt? (20)
Ähnlich wie BE 500 Index - Dividends and Implied Volatility Surfaces Parameters
Ähnlich wie BE 500 Index - Dividends and Implied Volatility Surfaces Parameters (20)
Mehr von BCV
Mehr von BCV (20)
Kürzlich hochgeladen
Kürzlich hochgeladen (20)
BE 500 Index - Dividends and Implied Volatility Surfaces Parameters
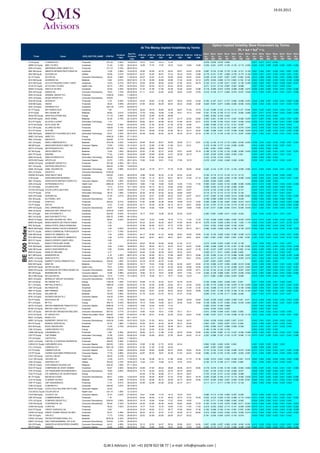
- 1. 19.03.2013 Option Implied Volatility Skew Parameters by Terms: At The Money Implied Volatilities by Terms 2 IVt = atx + btx + ct Next Ex- Skew Skew Skew Skew Skew Skew Skew Skew Skew Skew Skew Skew Skew Skew Dividend ATM Vol - ATM Vol - ATM Vol - ATM Vol - ATM Vol - ATM Vol - ATM Vol - Ticker Name GICS_SECTOR_NAME ATM Ref Dividend (a) - (a) - (a) - (a) - (a) - (a) - (a) - (b) - (b) - (b) - (b) - (b) - (b) - (b) - Yield 30D 60D 90D 6M 12M 18M 24M Date 30D 60D 90D 6M 12M 18M 24M 30D 60D 90D 6M 12M 18M 24M III LN Equity 3I GROUP PLC Financials 321.30 2.55% 19.06.2013 16.74 16.74 16.74 17.45 -0.078 -0.078 -0.078 -0.055 0.017 0.017 0.017 0.004 ABBN VX Equity ABB LTD-REG Industrials 21.40 3.18% 30.04.2014 16.56 17.70 17.63 18.23 19.40 19.69 19.66 -0.239 -0.001 -0.070 -0.109 -0.132 -0.110 -0.099 0.032 0.010 0.009 0.006 0.002 0.002 0.002 ADN LN Equity ABERDEEN ASSET MGMT PLC Financials 417.10 3.16% 08.05.2013 ABE SM Equity ABERTIS INFRAESTRUCTURAS SA Industrials 13.26 4.98% 12.04.2013 22.00 22.59 22.72 23.03 23.07 23.03 23.05 -0.097 -0.123 -0.165 -0.178 -0.162 -0.121 -0.109 0.001 0.002 0.001 0.002 0.001 0.001 0.001 ANA SM Equity ACCIONA SA Utilities 45.68 5.91% 04.06.2013 42.07 40.93 36.81 37.43 35.24 33.53 33.86 -0.179 -0.161 0.197 -0.098 -0.155 -0.170 -0.199 0.000 0.001 -0.001 0.000 0.000 0.001 0.001 AC FP Equity ACCOR SA Consumer Discretionary 28.35 2.68% 11.06.2014 25.27 23.97 21.23 22.08 23.95 24.52 24.65 -0.239 -0.134 -0.001 0.067 0.057 0.050 0.050 0.012 0.008 0.005 0.002 0.001 0.008 0.007 ACX SM Equity ACERINOX SA Materials 8.08 6.81% 05.07.2013 31.19 30.95 30.85 32.96 31.35 32.48 32.12 -0.075 -0.034 -0.099 -0.110 0.055 0.154 0.149 0.003 0.000 0.000 0.000 0.000 -0.002 -0.002 ACS SM Equity ACS ACTIVIDADES CONS Y SERV Industrials 18.23 6.31% 05.07.2013 30.26 29.05 28.45 24.65 27.90 25.23 26.79 -0.143 -0.141 -0.165 -0.011 -0.261 -0.130 -0.288 0.002 0.002 0.001 0.002 0.000 0.002 0.001 ATLN VX Equity ACTELION LTD-REG Health Care 50.70 1.97% 22.04.2014 25.07 24.03 25.19 25.24 25.29 25.43 -0.311 -0.101 -0.116 -0.087 -0.091 -0.088 0.007 0.003 0.004 0.001 0.000 0.001 ADEN VX Equity ADECCO SA-REG Industrials 54.55 3.30% 05.05.2014 21.22 21.59 21.94 23.38 24.26 24.09 23.86 -0.116 -0.009 -0.074 -0.078 -0.068 -0.080 -0.075 0.008 0.004 0.005 0.002 0.001 0.002 0.002 ADS GR Equity ADIDAS AG Consumer Discretionary 79.63 1.70% 09.05.2014 21.11 23.07 22.95 22.80 22.65 23.09 23.09 -0.210 -0.128 -0.117 -0.090 -0.072 -0.037 -0.006 0.013 0.006 0.005 0.003 0.001 0.001 0.000 ADM LN Equity ADMIRAL GROUP PLC Financials 1339.00 4.93% 11.09.2013 AGS LN Equity AEGIS GROUP PLC Consumer Discretionary 239.60 12.06.2013 AGN NA Equity AEGON NV Financials 4.79 4.59% 15.08.2013 24.25 26.92 27.28 26.07 26.54 25.55 24.49 -0.162 -0.197 -0.211 -0.137 -0.062 -0.098 -0.053 0.029 0.008 0.007 0.004 0.001 0.005 0.006 AGS BB Equity AGEAS Financials 26.20 4.58% 29.04.2013 27.64 26.52 26.39 25.54 25.22 23.68 23.60 -0.225 -0.047 -0.071 -0.058 -0.060 -0.055 -0.035 0.003 0.003 0.003 0.003 0.001 0.002 0.001 AGK LN Equity AGGREKO PLC Industrials 1951.00 1.27% 04.09.2013 AF FP Equity AIR FRANCE-KLM Industrials 7.95 16.07.2013 36.44 39.78 39.84 39.26 38.87 37.39 35.78 -0.122 -0.085 -0.102 -0.118 -0.114 0.127 0.046 0.004 0.003 0.003 0.002 0.002 0.001 0.001 AI FP Equity AIR LIQUIDE SA Materials 95.82 2.61% 12.05.2014 14.76 16.63 16.59 17.28 18.41 19.12 19.05 -0.161 -0.140 -0.136 -0.112 -0.107 -0.092 -0.090 0.021 0.011 0.010 0.004 0.003 0.004 0.003 AKSO NO Equity AKER SOLUTIONS ASA Energy 111.70 3.58% 18.04.2014 35.25 32.65 30.05 29.86 -0.552 -0.352 -0.152 -0.245 0.143 0.079 0.015 0.003 AKZA NA Equity AKZO NOBEL Materials 52.38 2.79% 22.10.2013 23.51 21.97 21.86 22.77 23.15 22.92 22.84 -0.303 -0.201 -0.169 -0.113 -0.091 -0.069 -0.050 0.011 0.007 0.005 0.003 0.002 0.001 0.001 ALU FP Equity ALCATEL-LUCENT Information Technology 1.14 09.06.2014 56.83 56.51 62.69 63.32 61.89 63.76 62.41 -0.375 -0.199 -0.145 -0.012 -0.041 -0.052 -0.032 0.009 0.013 0.005 0.004 0.001 0.000 0.000 ALFA SS Equity ALFA LAVAL AB Industrials 148.00 2.36% 24.04.2014 16.93 21.92 20.45 21.39 23.78 23.86 -0.259 -0.090 -0.127 -0.131 -0.101 -0.097 0.043 0.016 0.009 0.004 0.001 0.000 ALV GR Equity ALLIANZ SE-REG Financials 108.80 4.14% 08.05.2014 20.39 20.41 20.54 20.81 20.95 20.06 19.81 -0.182 -0.132 -0.139 -0.126 -0.081 -0.070 -0.040 0.015 0.008 0.006 0.003 0.000 0.002 0.001 ALO FP Equity ALSTOM Industrials 33.73 2.82% 27.06.2013 24.41 28.29 27.92 27.85 29.13 30.14 30.02 -0.365 -0.268 -0.241 -0.127 -0.098 -0.056 -0.029 0.018 0.007 0.006 0.003 0.001 0.000 0.000 AMS SM Equity AMADEUS IT HOLDING SA-A SHS Information Technology 20.51 2.54% 29.07.2013 20.38 20.40 20.54 20.33 20.35 20.19 20.16 -0.105 -0.112 -0.135 -0.140 -0.113 -0.097 -0.095 0.001 0.002 0.001 0.002 0.001 0.001 0.001 AMEC LN Equity AMEC PLC Energy 1049.00 3.56% 27.11.2013 AML LN Equity AMLIN PLC Financials 425.80 5.71% 04.09.2013 AAL LN Equity ANGLO AMERICAN PLC Materials 1810.50 3.22% 14.08.2013 28.00 28.40 28.81 30.65 30.89 31.11 30.91 -0.102 -0.105 -0.118 -0.110 0.008 -0.040 -0.054 0.009 0.004 0.004 0.002 -0.002 0.001 0.001 ABI BB Equity ANHEUSER-BUSCH INBEV NV Consumer Staples 73.56 3.53% 16.10.2013 22.15 22.66 21.96 21.85 22.31 22.31 -0.319 -0.169 -0.177 -0.124 -0.090 -0.090 0.010 0.006 0.004 0.002 0.001 0.001 ANTO LN Equity ANTOFAGASTA PLC Materials 1047.00 1.36% 11.09.2013 29.63 29.63 29.63 31.07 -0.081 -0.081 -0.081 -0.054 0.002 0.002 0.002 0.000 MT NA Equity ARCELORMITTAL Materials 10.64 1.46% 09.05.2014 30.53 31.85 32.37 32.60 33.81 34.85 35.18 -0.166 -0.183 -0.192 -0.135 -0.098 -0.065 -0.050 0.009 0.003 0.005 0.002 0.001 0.001 0.001 AKE FP Equity ARKEMA Materials 77.02 2.34% 29.05.2014 28.69 28.69 28.69 31.67 29.39 29.18 -0.035 -0.035 -0.035 -0.029 -0.002 0.001 0.000 0.000 0.000 -0.001 0.001 0.001 ARM LN Equity ARM HOLDINGS PLC Information Technology 893.50 0.54% 04.09.2013 27.64 27.64 27.64 28.07 -0.153 -0.153 -0.153 -0.078 0.004 0.004 0.004 0.002 ARYN SW Equity ARYZTA AG Consumer Staples 53.70 1.27% 29.01.2014 15.90 16.45 16.91 17.42 17.69 18.19 -0.010 -0.047 -0.043 -0.048 -0.049 -0.060 0.008 0.001 0.004 0.003 0.002 0.002 ASHM LN Equity ASHMORE GROUP PLC Financials 357.90 4.46% 06.11.2013 AHT LN Equity ASHTEAD GROUP PLC Industrials 592.00 0.78% 14.08.2013 ASML NA Equity ASML HOLDING NV Information Technology 53.65 0.99% 24.04.2014 29.40 27.79 27.71 27.76 27.95 28.08 28.05 -0.402 -0.144 -0.187 -0.151 -0.104 -0.099 -0.080 0.013 0.003 0.004 0.002 0.001 0.001 0.001 ASC LN Equity ASOS PLC Consumer Discretionary 3109.00 ASSAB SS Equity ASSA ABLOY AB-B Industrials 252.60 2.02% 28.04.2014 18.86 20.60 20.33 21.35 23.22 23.36 -0.162 -0.119 -0.114 -0.134 -0.113 -0.112 0.040 0.019 0.014 0.006 0.000 0.000 G IM Equity ASSICURAZIONI GENERALI Financials 12.30 1.63% 19.05.2014 31.88 31.14 30.73 29.51 28.73 27.65 27.16 -0.401 -0.290 -0.305 -0.250 -0.198 -0.089 -0.050 0.009 0.005 0.003 0.003 0.002 0.001 0.001 ABF LN Equity ASSOCIATED BRITISH FOODS PLC Consumer Staples 1878.00 1.65% 05.06.2013 12.24 12.24 12.24 12.65 -0.004 -0.004 -0.004 -0.040 0.000 0.000 0.000 0.000 AZN LN Equity ASTRAZENECA PLC Health Care 3060.50 6.27% 07.08.2013 18.60 17.92 16.96 16.58 15.92 17.03 17.45 -0.400 -0.261 -0.222 -0.133 -0.088 -0.085 -0.096 0.015 0.010 0.008 0.004 0.003 0.002 0.002 ATL IM Equity ATLANTIA SPA Industrials 12.13 6.31% 18.11.2013 24.39 25.12 24.15 23.84 23.58 23.60 -0.306 -0.253 -0.179 -0.160 -0.095 -0.092 0.012 0.006 0.004 0.002 0.002 0.002 ATCOA SS Equity ATLAS COPCO AB-A SHS Industrials 181.10 3.04% 30.04.2014 17.41 19.98 20.40 21.42 24.81 25.07 -0.218 -0.120 -0.169 -0.105 -0.103 -0.101 0.038 0.015 0.010 0.004 -0.001 -0.002 ATO FP Equity ATOS Information Technology 56.75 1.06% 13.06.2013 24.35 24.35 24.35 25.30 25.88 25.87 -0.110 -0.110 -0.110 -0.110 -0.104 -0.104 0.003 0.003 0.003 0.001 0.001 0.001 NDA GR Equity AURUBIS AG Materials 51.65 2.61% 28.02.2014 22.33 23.51 22.66 24.22 23.67 24.07 24.27 -0.101 -0.063 -0.128 -0.039 -0.012 -0.008 0.002 0.003 0.001 0.003 0.001 0.001 0.002 0.003 AGL IM Equity AUTOGRILL SPA Consumer Discretionary 9.34 20.05.2013 23.93 25.01 25.41 25.47 23.81 23.72 -0.169 -0.090 -0.066 -0.172 -0.040 -0.039 0.009 0.000 0.000 0.005 0.000 0.000 AV/ LN Equity AVIVA PLC Financials 322.00 6.21% 18.09.2013 21.87 22.98 23.39 22.06 19.89 19.72 18.52 -0.409 -0.089 -0.152 -0.067 -0.002 -0.073 -0.013 0.013 0.010 0.007 0.002 0.002 0.005 0.005 CS FP Equity AXA SA Financials 14.01 5.14% 05.05.2014 24.71 25.39 25.34 25.15 25.13 26.81 26.69 -0.153 -0.197 -0.170 -0.125 -0.175 -0.108 -0.113 0.022 0.005 0.005 0.003 0.003 0.003 0.003 SPR GR Equity AXEL SPRINGER AG Consumer Discretionary 34.67 4.90% 24.04.2014 18.04 18.82 18.94 18.70 18.84 19.68 19.56 -0.187 0.017 0.008 0.009 0.016 -0.036 -0.039 0.017 0.000 0.001 0.000 0.000 0.001 0.001 BAB LN Equity BABCOCK INTL GROUP PLC Industrials 1079.00 2.42% 03.07.2013 BA/ LN Equity BAE SYSTEMS PLC Industrials 392.50 5.04% 16.10.2013 18.17 18.81 19.56 20.25 20.26 20.26 -0.363 0.005 -0.089 -0.011 -0.024 -0.024 0.025 0.002 -0.002 -0.001 0.001 0.001 BBY LN Equity BALFOUR BEATTY PLC Industrials 258.70 5.49% 09.10.2013 BALN VX Equity BALOISE HOLDING AG - REG Financials 89.60 5.02% 02.05.2014 19.61 14.23 14.55 16.70 17.14 17.50 17.43 -0.103 -0.046 -0.063 -0.084 -0.067 -0.076 -0.076 0.015 0.013 0.009 0.005 0.002 0.002 0.001 BMPS IM Equity BANCA MONTE DEI PASCHI SIENA Financials 0.20 20.05.2013 55.22 52.43 49.35 49.07 47.89 66.39 65.19 -0.278 -0.334 -0.099 -0.309 -0.160 -1.004 -1.119 0.003 0.010 0.008 0.007 0.001 -0.016 -0.017 BPE IM Equity BANCA POPOL EMILIA ROMAGNA Financials 5.56 20.05.2013 47.66 54.66 53.21 47.72 47.56 50.71 0.014 -0.353 -0.308 -0.245 -0.182 -0.204 0.000 0.000 0.001 0.003 0.002 -0.001 BE 500 Index BBVA SM Equity BANCO BILBAO VIZCAYA ARGENTA Financials 7.20 5.83% 16.04.2013 30.00 31.12 31.66 31.15 29.46 29.18 28.11 -0.362 -0.393 -0.259 -0.264 -0.198 -0.146 -0.079 0.006 0.005 0.002 0.000 -0.001 -0.002 -0.002 BCP PL Equity BANCO COMERCIAL PORTUGUES-R Financials 0.11 3.16% 22.04.2013 SAB SM Equity BANCO DE SABADELL SA Financials 1.54 0.65% 10.09.2013 44.17 40.85 41.33 40.98 39.42 38.08 38.08 -0.102 -0.150 -0.206 -0.322 -0.385 -0.296 -0.312 -0.001 0.003 0.002 0.003 0.002 0.001 0.003 BTO SM Equity BANCO ESP CREDITO (BANESTO) Financials 3.46 5.21% 29.07.2013 36.91 36.91 36.91 36.91 36.91 36.91 36.91 0.097 0.097 0.097 0.097 0.097 0.097 0.097 -0.001 -0.001 -0.001 -0.001 -0.001 -0.001 -0.001 BES PL Equity BANCO ESPIRITO SANTO-REG Financials 0.90 07.04.2014 BP IM Equity BANCO POPOLARE SCARL Financials 1.04 20.05.2013 49.24 46.38 44.58 42.58 41.50 41.51 -0.310 -0.249 -0.293 -0.209 -0.140 -0.138 0.004 0.004 0.003 0.001 0.001 0.001 POP SM Equity BANCO POPULAR ESPANOL Financials 0.64 2.54% 18.06.2013 60.01 58.22 53.13 53.23 53.37 54.03 54.60 -0.250 -0.069 -0.055 -0.170 -0.301 -0.150 0.052 0.010 -0.004 -0.001 0.008 0.002 0.002 -0.002 SAN SM Equity BANCO SANTANDER SA Financials 5.60 10.64% 08.07.2013 33.09 32.75 31.44 30.11 26.38 24.07 21.59 -0.181 -0.227 -0.287 -0.218 -0.140 0.092 0.144 0.004 0.000 0.000 0.001 0.002 -0.003 0.002 BKIR ID Equity BANK OF IRELAND Financials 0.17 14.08.2013 34.44 33.39 35.35 34.97 35.32 34.51 -0.226 -0.111 0.011 0.049 -0.008 0.026 0.032 0.011 -0.002 0.001 0.002 0.001 BKT SM Equity BANKINTER SA Financials 4.18 3.30% 08.07.2013 41.84 40.52 39.14 37.88 36.60 35.73 35.86 -0.104 -0.092 -0.144 -0.119 -0.066 -0.050 -0.007 0.002 0.001 -0.001 -0.002 -0.003 -0.003 -0.004 BARC LN Equity BARCLAYS PLC Financials 297.65 2.35% 01.05.2013 29.84 30.98 30.38 29.84 29.71 29.41 29.39 -0.223 -0.217 -0.241 -0.172 -0.083 -0.083 -0.074 0.011 0.002 0.004 0.002 -0.001 0.001 0.002 BDEV LN Equity BARRATT DEVELOPMENTS PLC Consumer Discretionary 239.20 1.05% 23.10.2013 22.79 22.79 22.79 21.64 -0.007 -0.007 -0.007 -0.029 0.001 0.001 0.001 0.002 BAS GR Equity BASF SE Materials 73.07 3.56% 02.05.2014 18.17 19.34 19.96 21.50 22.36 23.81 24.00 -0.133 -0.085 -0.107 -0.094 -0.056 -0.010 0.008 0.016 0.006 0.006 0.003 0.001 0.000 -0.001 BAYN GR Equity BAYER AG-REG Health Care 78.21 2.43% 28.04.2014 19.88 21.01 21.38 22.39 22.84 22.86 22.64 -0.230 -0.175 -0.172 -0.132 -0.089 -0.072 -0.044 0.018 0.007 0.006 0.003 0.001 0.001 0.001 BMW GR Equity BAYERISCHE MOTOREN WERKE AG Consumer Discretionary 68.65 3.64% 19.05.2014 24.85 24.33 24.31 24.62 24.94 24.99 24.71 -0.134 -0.102 -0.122 -0.108 -0.077 -0.057 -0.027 0.017 0.007 0.005 0.002 0.001 0.001 0.001 BEI GR Equity BEIERSDORF AG Consumer Staples 70.86 0.99% 22.04.2014 16.90 18.14 18.07 18.89 18.87 17.84 17.57 -0.255 -0.128 -0.088 -0.081 -0.079 -0.059 -0.042 0.016 0.007 0.008 0.004 0.001 0.002 0.002 BELG BB Equity BELGACOM SA Telecommunication Services 19.70 11.07% 10.12.2013 19.15 18.36 18.11 16.77 19.29 19.33 -0.011 0.082 0.058 -0.034 -0.007 -0.006 0.019 0.009 0.009 0.003 0.000 0.000 BKG LN Equity BERKELEY GROUP HOLDINGS Consumer Discretionary 2100.00 0.71% BG/ LN Equity BG GROUP PLC Energy 1183.00 1.49% 31.07.2013 20.08 21.72 22.34 23.47 24.79 24.79 -0.102 -0.080 -0.051 -0.038 0.001 0.001 0.017 0.009 0.005 0.001 0.000 0.000 BLT LN Equity BHP BILLITON PLC Materials 1968.50 4.03% 04.09.2013 21.54 22.28 22.98 23.84 25.11 25.36 25.05 -0.168 -0.170 -0.208 -0.146 -0.076 -0.102 -0.099 0.006 0.005 0.005 0.003 0.001 0.002 0.001 GBF GR Equity BILFINGER SE Industrials 82.09 3.65% 22.04.2014 18.20 20.05 20.18 20.58 21.82 21.64 21.40 -0.163 -0.096 -0.115 -0.107 -0.077 -0.104 -0.089 0.009 0.004 0.007 0.004 0.001 0.002 0.002 BNP FP Equity BNP PARIBAS Financials 40.77 3.68% 30.05.2014 30.54 33.01 32.29 30.32 29.32 30.03 30.06 -0.240 -0.201 -0.188 -0.150 -0.108 -0.140 -0.120 0.007 0.003 0.004 0.002 0.001 0.002 0.001 BOL SS Equity BOLIDEN AB Materials 103.50 3.86% 05.05.2014 21.76 23.40 23.78 25.10 27.57 27.62 -0.295 -0.181 -0.148 -0.111 -0.098 -0.094 0.047 0.023 0.015 0.005 0.001 0.001 BOK LN Equity BOOKER GROUP PLC Consumer Staples 124.30 2.04% 05.06.2013 EN FP Equity BOUYGUES SA Industrials 22.42 7.14% 30.04.2014 28.84 29.47 29.60 29.77 29.08 29.09 29.09 -0.244 -0.039 -0.052 -0.056 -0.056 0.041 0.071 0.019 0.009 0.006 0.003 0.002 0.003 0.003 BP/ LN Equity BP PLC Energy 449.15 5.45% 08.05.2013 19.13 19.64 19.85 20.27 20.09 19.28 18.80 -0.138 -0.082 -0.137 -0.092 -0.002 -0.035 -0.060 0.007 0.001 0.003 0.002 0.001 0.003 0.003 BATS LN Equity BRITISH AMERICAN TOBACCO PLC Consumer Staples 3499.50 4.17% 14.08.2013 15.63 16.23 16.49 17.23 -0.206 -0.270 -0.180 -0.089 0.005 0.007 0.005 0.002 BLND LN Equity BRITISH LAND CO PLC Financials 546.00 4.91% 03.07.2013 13.11 13.11 13.11 14.54 -0.044 -0.044 -0.044 -0.025 0.007 0.007 0.007 0.001 BSY LN Equity BRITISH SKY BROADCASTING GRO Consumer Discretionary 897.00 3.17% 23.10.2013 16.65 18.20 18.01 17.89 18.11 18.11 0.010 -0.095 -0.048 -0.031 0.009 0.009 0.002 0.005 0.002 0.002 0.000 0.000 BT/A LN Equity BT GROUP PLC Telecommunication Services 269.50 3.64% 07.08.2013 21.56 24.47 23.35 23.28 23.20 20.52 19.36 -0.384 -0.227 -0.217 -0.148 -0.058 -0.136 -0.135 0.012 0.002 0.005 0.003 0.000 0.001 0.001 BNZL LN Equity BUNZL PLC Industrials 1309.00 2.19% 06.11.2013 BRBY LN Equity BURBERRY GROUP PLC Consumer Discretionary 1420.00 2.04% 03.07.2013 32.29 31.02 30.91 30.54 30.06 29.71 -0.043 -0.038 -0.029 -0.005 0.007 0.015 0.000 0.001 0.001 0.000 0.000 0.002 BVI FP Equity BUREAU VERITAS SA Industrials 97.42 1.88% 11.06.2013 20.02 20.01 20.23 20.24 20.37 20.36 0.063 0.001 -0.004 0.007 0.013 0.026 0.004 0.000 0.000 0.000 0.000 0.000 BZU IM Equity BUZZI UNICEM SPA Materials 12.06 0.75% 20.05.2013 24.12 24.69 25.22 26.48 26.31 26.30 -0.052 -0.095 -0.077 -0.096 -0.050 -0.048 0.010 0.001 0.001 0.001 0.000 0.000 CNE LN Equity CAIRN ENERGY PLC Energy 278.20 32.30 32.30 32.30 32.28 -0.180 -0.180 -0.180 -0.152 0.002 0.002 0.002 0.002 CABK SM Equity CAIXABANK S.A Financials 2.66 6.36% 28.05.2013 36.85 33.73 31.88 31.02 29.30 30.58 30.94 -0.254 -0.206 0.000 -0.110 -0.237 -0.226 -0.388 0.008 0.000 0.001 0.002 0.002 0.001 0.004 CAP FP Equity CAP GEMINI Information Technology 37.98 2.63% 04.06.2014 23.58 25.58 26.63 27.59 28.54 29.42 81.47 -0.257 -0.286 -0.197 -0.143 -0.107 -0.080 -7.116 0.015 0.007 0.006 0.003 0.001 0.002 0.090 CPI LN Equity CAPITA PLC Industrials 900.50 2.69% 11.09.2013 CAPC LN Equity CAPITAL & COUNTIES PROPERTIE Financials 268.00 0.58% 21.08.2013 CARLB DC Equity CARLSBERG AS-B Consumer Staples 585.50 1.02% 24.03.2014 19.05 21.86 21.75 22.55 22.34 0.006 0.020 -0.003 0.032 0.036 0.001 0.000 0.000 0.000 0.000 CCL LN Equity CARNIVAL PLC Consumer Discretionary 2261.00 3.00% 22.05.2013 21.50 21.50 21.50 23.04 -0.087 -0.087 -0.087 -0.056 0.006 0.006 0.006 0.001 CA FP Equity CARREFOUR SA Consumer Staples 21.63 2.68% 02.05.2014 29.40 28.62 28.88 29.75 30.62 30.64 30.22 -0.170 -0.102 -0.123 -0.106 -0.085 -0.074 -0.040 0.010 0.010 0.004 0.002 0.001 0.000 0.000 CO FP Equity CASINO GUICHARD PERRACHON Consumer Staples 77.79 3.86% 24.04.2014 20.67 20.30 19.91 20.26 21.52 22.43 23.08 -0.260 -0.152 -0.153 -0.100 -0.087 -0.063 -0.067 0.013 0.004 0.005 0.004 0.002 0.002 0.001 CAST SS Equity CASTELLUM AB Financials 96.30 4.10% 21.03.2014 CLS1 GR Equity CELESIO AG Health Care 14.28 2.51% 17.05.2013 21.94 20.48 20.14 21.98 22.84 21.79 21.48 -0.229 -0.073 -0.027 -0.035 -0.029 0.001 0.016 0.020 0.003 0.003 0.002 0.000 0.002 0.002 CNA LN Equity CENTRICA PLC Utilities 354.50 4.72% 25.09.2013 13.45 12.01 12.69 14.74 15.53 15.53 -0.183 -0.115 -0.189 -0.111 0.008 0.008 0.001 0.006 0.009 0.003 0.000 0.000 CHR DC Equity CHR HANSEN HOLDING A/S Materials 209.30 1.60% 27.11.2013 SGO FP Equity COMPAGNIE DE SAINT-GOBAIN Industrials 30.57 4.06% 09.06.2014 25.69 27.94 28.52 28.89 29.56 29.70 29.85 -0.178 -0.216 -0.190 -0.139 -0.093 -0.083 -0.065 0.009 0.007 0.003 0.002 0.001 0.001 0.000 CFR VX Equity CIE FINANCIERE RICHEMON-BR A Consumer Discretionary 75.80 0.92% 09.09.2013 21.75 24.06 24.04 24.78 25.75 26.83 -0.251 -0.145 -0.163 -0.120 -0.094 -0.077 0.008 0.004 0.004 0.002 0.001 0.001 CGG FP Equity CIE GENERALE DE GEOPHYSIQUE Energy 18.30 40.36 37.56 36.86 37.17 36.33 36.07 -0.153 -0.125 -0.131 -0.122 -0.094 -0.088 0.005 0.001 0.003 0.002 0.001 0.001 ML FP Equity MICHELIN (CGDE) Consumer Discretionary 66.21 3.62% 13.05.2014 24.52 26.29 26.87 27.24 27.64 26.31 24.78 -0.254 -0.226 -0.164 -0.137 -0.115 -0.050 -0.038 0.010 0.007 0.005 0.002 0.001 0.000 0.002 CLN VX Equity CLARIANT AG-REG Materials 13.98 2.36% 27.03.2014 27.03 26.46 25.15 25.49 25.73 26.26 25.84 0.015 -0.020 -0.050 -0.051 -0.053 -0.020 0.007 0.008 0.003 0.005 0.001 0.002 0.002 0.002 CNP FP Equity CNP ASSURANCES Financials 11.31 6.81% 30.04.2014 25.46 25.46 25.46 24.58 24.14 24.11 -0.111 -0.111 -0.111 -0.158 -0.131 -0.130 0.002 0.002 0.002 0.002 0.002 0.002 COB LN Equity COBHAM PLC Industrials 246.60 3.57% 09.10.2013 EEEK GA Equity COCA-COLA HELLENIC BOTTLING Consumer Staples 22.40 25.06.2014 COLOB DC Equity COLOPLAST-B Health Care 321.10 1.56% 12.12.2013 COLR BB Equity COLRUYT SA Consumer Staples 37.27 2.63% 27.09.2013 16.51 16.88 17.70 18.10 19.24 19.31 -0.260 -0.113 -0.104 -0.083 -0.057 -0.055 0.015 0.006 0.006 0.001 0.002 0.002 CBK GR Equity COMMERZBANK AG Financials 1.18 23.05.2014 49.44 46.45 41.81 38.40 35.74 37.22 35.39 -0.234 -0.210 -0.229 -0.105 -0.096 -0.115 -0.063 0.013 0.008 0.009 -0.001 0.002 0.001 0.003 CPG LN Equity COMPASS GROUP PLC Consumer Discretionary 836.00 2.80% 26.06.2013 16.18 16.64 16.84 17.97 18.40 18.40 -0.155 -0.171 -0.169 -0.089 -0.062 -0.062 0.008 0.006 0.005 0.001 0.000 0.000 CON GR Equity CONTINENTAL AG Consumer Discretionary 96.48 2.33% 16.05.2014 22.30 23.95 24.48 24.82 25.80 26.86 27.29 -0.163 -0.103 -0.102 -0.076 -0.060 -0.011 0.020 0.015 0.006 0.004 0.002 0.001 0.000 -0.001 CORA NA Equity CORIO NV Financials 36.22 7.62% 23.04.2014 14.77 15.33 15.75 16.84 17.63 17.63 17.63 -0.219 -0.032 -0.002 -0.115 -0.101 -0.099 -0.099 0.019 0.011 0.014 0.004 0.000 0.000 0.000 ACA FP Equity CREDIT AGRICOLE SA Financials 6.50 26.05.2014 35.35 38.52 37.21 36.77 37.69 38.05 37.48 -0.192 -0.208 -0.182 -0.134 -0.061 0.078 0.065 0.016 0.003 0.002 0.002 0.002 -0.002 -0.002 CSGN VX Equity CREDIT SUISSE GROUP AG-REG Financials 25.47 0.39% 09.05.2014 28.33 34.27 32.27 31.57 30.28 27.13 26.92 -0.313 -0.462 -0.433 -0.352 -0.278 -0.255 -0.219 0.013 0.006 0.006 0.001 0.001 0.003 0.003 CRH ID Equity CRH PLC Materials 17.73 3.53% 28.08.2013 26.52 24.89 25.65 29.80 29.37 30.22 -0.181 -0.030 -0.045 -0.079 -0.103 -0.074 0.009 0.002 0.003 0.002 0.001 0.002 CRDA LN Equity CRODA INTERNATIONAL PLC Materials 2675.00 2.30% 28.08.2013 DMGT LN Equity DAILY MAIL&GENERAL TST-A NV Consumer Discretionary 702.50 2.70% 29.05.2013 DAI GR Equity DAIMLER AG-REGISTERED SHARES Consumer Discretionary 44.37 4.96% 10.04.2014 23.13 23.52 24.37 25.54 25.96 25.01 24.60 0.027 -0.082 -0.057 -0.062 -0.038 -0.002 0.038 0.013 0.006 0.004 0.001 0.000 0.001 0.000 BN FP Equity DANONE Consumer Staples 54.68 2.65% 06.05.2014 19.60 18.60 18.80 19.53 20.08 19.02 19.09 -0.262 -0.172 -0.171 -0.122 -0.088 -0.098 -0.088 0.020 0.011 0.006 0.003 0.001 0.002 0.002 Q.M.S Advisors | tel: +41 (0)78 922 08 77 | e-mail: info@qmsadv.com |
- 2. 19.03.2013 Option Implied Volatility Skew Parameters by Terms: At The Money Implied Volatilities by Terms IVt = atx + btx2 + ct Next Ex- Skew Skew Skew Skew Skew Skew Skew Skew Skew Skew Skew Skew Skew Skew Dividend ATM Vol - ATM Vol - ATM Vol - ATM Vol - ATM Vol - ATM Vol - ATM Vol - Ticker Name GICS_SECTOR_NAME ATM Ref Dividend (a) - (a) - (a) - (a) - (a) - (a) - (a) - (b) - (b) - (b) - (b) - (b) - (b) - (b) - Yield 30D 60D 90D 6M 12M 18M 24M Date 30D 60D 90D 6M 12M 18M 24M 30D 60D 90D 6M 12M 18M 24M DANSKE DC EquityDANSKE BANK A/S Financials 105.60 19.03.2014 25.56 23.38 24.49 26.60 27.50 -0.228 -0.156 -0.169 -0.071 -0.071 0.039 0.016 0.014 0.000 0.000 DSY FP Equity DASSAULT SYSTEMES SA Information Technology 89.89 0.87% 14.06.2013 18.32 18.32 18.32 19.73 20.69 20.70 -0.119 -0.119 -0.119 -0.117 -0.097 -0.096 0.005 0.005 0.005 0.003 0.002 0.002 CPR IM Equity DAVIDE CAMPARI-MILANO SPA Consumer Staples 5.99 1.17% 19.05.2014 20.09 20.20 20.44 20.55 20.50 20.47 -0.040 0.000 0.001 0.006 0.010 0.013 0.001 0.000 0.000 0.000 0.000 0.000 DCC ID Equity DCC PLC Industrials 27.25 3.15% 22.05.2013 23.12 22.39 21.54 20.83 20.64 21.08 -0.187 -0.158 -0.125 -0.089 -0.083 -0.057 0.015 0.004 0.004 0.003 0.003 0.002 DE NA Equity DE MASTER BLENDERS1753 NV Consumer Staples 9.37 28.01 27.70 26.85 24.52 22.92 23.32 23.35 -0.131 -0.073 -0.033 -0.089 -0.071 -0.063 -0.055 0.010 0.003 0.004 0.001 0.002 0.001 0.000 DELB BB Equity DELHAIZE GROUP Consumer Staples 41.69 3.36% 28.05.2014 24.58 26.43 26.56 23.62 21.87 21.82 -0.298 -0.175 -0.081 -0.086 -0.079 -0.080 0.014 0.007 0.004 0.004 0.003 0.003 DL NA Equity DELTA LLOYD NV Financials 13.89 7.42% 05.08.2013 22.04 24.16 24.39 23.11 23.24 23.24 -0.335 -0.314 -0.175 -0.133 -0.079 -0.079 0.029 0.008 0.007 0.003 0.003 0.003 DLN LN Equity DERWENT LONDON PLC Financials 2146.00 1.60% 25.09.2013 DBK GR Equity DEUTSCHE BANK AG-REGISTERED Financials 32.04 2.34% 23.05.2014 27.53 29.69 29.33 31.10 31.21 31.72 31.60 -0.196 -0.193 -0.147 -0.091 -0.077 -0.031 -0.014 0.009 0.006 0.004 0.001 0.001 0.001 0.001 DB1 GR Equity DEUTSCHE BOERSE AG Financials 49.70 4.23% 15.05.2014 21.21 21.29 21.04 21.02 21.39 20.87 20.81 -0.152 -0.091 -0.092 -0.095 -0.074 -0.056 -0.038 0.014 0.006 0.005 0.003 0.001 0.001 0.001 LHA GR Equity DEUTSCHE LUFTHANSA-REG Industrials 16.24 09.05.2014 27.09 28.41 28.28 27.66 26.74 25.57 24.56 -0.256 -0.180 -0.146 -0.104 -0.089 -0.011 0.040 0.014 0.004 0.004 0.002 0.002 0.002 0.002 DPW GR Equity DEUTSCHE POST AG-REG Industrials 18.42 3.80% 30.05.2014 17.97 19.08 18.68 19.09 19.54 18.24 17.43 -0.265 -0.183 -0.122 -0.087 -0.071 -0.026 0.010 0.033 0.010 0.008 0.004 0.001 0.002 0.002 DTE GR Equity DEUTSCHE TELEKOM AG-REG Telecommunication Services 8.48 8.26% 19.05.2014 20.32 20.40 19.36 20.04 18.02 18.96 16.31 -0.223 0.242 0.147 0.081 0.015 0.055 0.064 0.036 0.020 0.012 0.005 0.003 0.001 0.004 DWNI GR Equity DEUTSCHE WOHNEN AG-BR Financials 14.70 1.70% 29.05.2013 24.08 23.46 24.29 24.90 24.50 23.43 23.25 -0.271 -0.144 -0.074 -0.060 -0.089 -0.072 -0.059 0.011 0.005 0.002 0.001 0.001 0.002 0.002 DGE LN Equity DIAGEO PLC Consumer Staples 2037.50 2.35% 04.09.2013 15.36 13.64 14.53 14.81 14.92 16.00 15.60 -0.367 -0.216 -0.206 -0.148 -0.056 -0.080 -0.059 0.014 0.008 0.008 0.005 0.002 0.003 0.003 DLG LN Equity DIRECT LINE INSURANCE GROUP Financials 203.00 5.91% 14.08.2013 16.34 16.34 16.34 16.66 -0.333 -0.333 -0.333 0.017 0.005 0.005 0.005 0.010 DIA SM Equity DISTRIBUIDORA INTERNACIONAL Consumer Staples 5.65 2.30% 16.07.2013 33.94 33.26 31.82 30.34 26.75 25.48 25.29 -0.205 -0.181 -0.248 -0.216 -0.155 -0.162 -0.143 0.003 0.000 0.002 0.003 0.000 0.000 0.000 DNB NO Equity DNB ASA Financials 90.90 2.31% 25.04.2014 23.89 26.96 26.01 22.44 22.57 -0.385 -0.317 -0.098 -0.090 -0.099 0.067 0.019 0.015 0.006 0.005 DRX LN Equity DRAX GROUP PLC Utilities 593.00 2.88% 25.09.2013 SMDS LN Equity DS SMITH PLC Materials 231.80 3.02% 02.10.2013 DSV DC Equity DSV A/S Industrials 144.10 0.87% 24.03.2014 19.33 20.71 20.02 22.57 23.53 -0.156 -0.187 -0.158 -0.041 -0.066 0.015 0.008 0.003 -0.002 0.001 DUFN SW Equity DUFRY AG-REG Consumer Discretionary 116.70 16.05.2014 29.91 29.91 29.57 29.67 29.29 30.17 -0.195 -0.124 -0.130 -0.121 -0.085 -0.109 0.004 0.000 0.001 0.000 0.001 -0.002 EOAN GR Equity E.ON SE Utilities 12.90 8.53% 09.05.2014 21.07 25.08 23.17 23.32 23.37 23.17 22.86 -0.174 0.179 0.071 0.000 -0.037 0.061 0.131 0.028 0.010 0.007 0.003 0.001 0.001 0.000 EAD FP Equity EADS NV Industrials 41.66 1.44% 04.06.2014 28.91 30.25 29.67 28.95 28.34 25.87 25.46 -0.252 -0.144 -0.137 -0.111 -0.079 -0.021 0.000 0.008 0.004 0.003 0.001 0.000 0.003 0.003 EZJ LN Equity EASYJET PLC Industrials 1056.00 2.16% 26.02.2014 EBRO SM Equity EBRO FOODS SA Consumer Staples 15.14 3.30% 10.01.2014 29.86 28.50 27.71 26.21 23.45 21.76 21.91 -0.101 -0.109 -0.125 -0.118 -0.091 -0.036 -0.038 0.000 0.001 0.000 0.000 0.000 0.000 0.001 EDEN FP Equity EDENRED Industrials 25.63 3.20% 27.05.2013 25.53 23.91 21.31 21.17 22.97 23.93 -0.072 0.022 -0.012 -0.070 -0.061 -0.060 0.004 0.003 0.003 0.003 0.002 0.002 EDP PL Equity EDP-ENERGIAS DE PORTUGAL SA Utilities 2.43 7.63% 13.05.2013 EDPR PL Equity EDP RENOVAVEIS SA Utilities 4.02 FGR FP Equity EIFFAGE Industrials 34.85 3.44% 24.04.2014 36.21 37.36 37.58 37.79 37.68 38.22 -0.018 0.004 -0.001 0.007 0.014 0.003 0.002 0.000 0.000 0.000 0.000 0.000 ELN ID Equity ELAN CORP PLC Health Care 9.02 45.26 44.02 41.09 40.03 40.49 40.38 -0.111 -0.117 -0.184 -0.120 -0.105 -0.104 0.001 0.002 0.002 0.000 0.001 0.001 EDF FP Equity EDF Utilities 14.67 8.52% 12.12.2013 20.63 22.43 22.60 22.84 22.17 23.67 23.02 -0.163 -0.144 -0.097 -0.096 -0.058 0.004 0.014 0.023 0.010 0.006 0.004 0.002 0.001 0.002 ELUXB SS Equity ELECTROLUX AB-SER B Consumer Discretionary 168.90 3.85% 26.03.2014 20.48 23.43 23.55 23.90 27.39 27.61 0.133 -0.047 -0.100 -0.099 -0.099 -0.099 0.036 0.016 0.008 0.005 -0.001 -0.002 EKTAB SS Equity ELEKTA AB-B SHS Health Care 95.00 1.47% 05.09.2013 27.72 27.72 27.72 27.72 27.72 0.000 0.000 0.000 0.000 0.000 0.000 0.000 0.000 0.000 0.000 ELI1V FH Equity ELISA OYJ Telecommunication Services 16.67 7.80% 26.03.2014 16.01 17.68 18.69 20.35 24.55 0.294 0.132 0.071 0.003 -0.379 0.021 0.009 0.007 0.003 0.002 ENG SM Equity ENAGAS SA Utilities 18.48 6.32% 04.07.2013 23.50 23.45 23.33 22.50 21.66 21.05 20.15 -0.074 -0.087 -0.110 -0.099 -0.065 -0.040 -0.009 0.001 0.002 0.002 0.001 0.002 0.001 0.001 ELE SM Equity ENDESA SA Utilities 17.45 02.07.2014 31.99 30.74 30.37 28.91 27.31 27.53 27.29 -0.059 -0.036 -0.056 -0.047 -0.043 0.060 0.080 0.002 0.000 0.001 0.001 0.001 -0.003 -0.002 EGPW IM Equity ENEL GREEN POWER SPA Utilities 1.47 1.76% 19.05.2014 33.60 32.14 32.84 32.70 32.87 32.87 -0.305 -0.156 -0.068 -0.097 -0.076 -0.075 0.001 0.001 0.000 0.000 0.000 0.000 ENEL IM Equity ENEL SPA Utilities 2.59 5.80% 23.06.2014 26.49 27.15 26.84 24.90 24.70 24.56 22.95 -0.283 -0.278 -0.252 -0.139 -0.120 -0.141 -0.132 0.015 0.007 0.004 0.002 0.002 0.003 0.003 ENI IM Equity ENI SPA Energy 17.85 6.11% 23.09.2013 19.66 20.05 19.61 19.67 19.84 19.41 19.12 -0.363 -0.308 -0.196 -0.156 -0.133 -0.103 -0.080 0.016 0.010 0.008 0.005 0.001 0.001 0.002 EBS AV Equity ERSTE GROUP BANK AG Financials 22.68 1.76% 22.05.2014 32.11 34.40 33.74 33.53 39.36 39.94 -0.478 -0.086 -0.107 -0.100 0.423 0.622 0.056 0.002 0.002 0.004 -0.006 -0.007 EI FP Equity ESSILOR INTERNATIONAL Health Care 85.49 1.03% 26.05.2014 18.13 18.85 18.74 19.19 19.75 18.99 18.87 -0.160 -0.166 -0.168 -0.120 -0.091 -0.042 -0.029 0.021 0.007 0.006 0.003 0.002 0.001 0.001 ENRC LN Equity EURASIAN NATURAL RESOURCES Materials 312.70 2.43% 27.03.2013 45.68 45.68 45.68 44.00 0.048 0.048 0.048 -0.056 -0.004 -0.004 -0.004 -0.001 ETL FP Equity EUTELSAT COMMUNICATIONS Consumer Discretionary 27.65 3.98% 14.11.2013 19.42 19.24 19.30 19.22 20.14 19.62 -0.045 -0.003 -0.014 0.006 -0.003 -0.006 0.007 -0.001 0.000 0.000 0.000 0.000 EVR LN Equity EVRAZ PLC Materials 230.50 1.15% 05.06.2013 EXO IM Equity EXOR SPA Financials 22.25 1.57% 24.06.2013 23.68 22.72 23.20 23.42 23.48 -0.116 -0.116 -0.152 -0.150 -0.114 0.008 0.007 0.003 0.002 0.001 EXPN LN Equity EXPERIAN PLC Industrials 1167.00 2.01% 19.06.2013 17.07 17.07 17.07 18.91 -0.040 -0.040 -0.040 -0.044 0.003 0.003 0.003 0.001 FER SM Equity FERROVIAL SA Industrials 12.27 3.67% 12.12.2013 31.20 30.23 30.19 28.78 27.58 27.61 27.27 -0.106 -0.073 -0.097 -0.106 -0.122 -0.074 -0.081 0.002 0.001 0.000 0.000 0.000 0.000 0.000 FI IM Equity FIAT INDUSTRIAL Industrials 8.55 2.63% 21.04.2014 29.44 27.43 28.14 29.27 29.74 29.77 -0.205 -0.175 -0.149 -0.119 -0.134 -0.135 0.018 0.011 0.007 0.001 -0.001 -0.001 F IM Equity FIAT SPA Consumer Discretionary 4.44 21.04.2014 40.02 39.98 40.24 38.98 37.80 37.28 35.76 -0.077 -0.177 -0.139 -0.153 -0.146 -0.236 -0.277 0.008 0.007 0.003 0.002 0.001 0.001 0.002 FNC IM Equity FINMECCANICA SPA Industrials 3.92 20.05.2013 46.07 46.02 44.54 42.11 40.31 40.27 -0.253 -0.236 -0.146 -0.129 -0.077 -0.073 0.004 0.001 0.001 0.001 0.000 0.000 FLS DC Equity FLSMIDTH & CO A/S Industrials 358.80 2.51% 07.04.2014 26.44 26.12 25.78 26.45 26.51 0.078 -0.057 -0.050 -0.021 -0.043 0.006 0.002 0.000 0.000 -0.001 FUM1V FH Equity FORTUM OYJ Utilities 15.09 6.63% 10.04.2014 8.70 18.44 18.69 19.63 20.90 0.046 -0.021 -0.010 -0.043 -0.037 0.022 0.006 0.007 0.003 0.001 FTE FP Equity FRANCE TELECOM SA Telecommunication Services 8.31 6.62% 05.09.2013 30.40 30.31 28.54 19.54 25.40 24.56 24.69 -0.201 -0.134 -0.093 0.269 0.020 0.507 0.299 0.012 0.004 0.005 0.007 0.002 -0.001 -0.001 FRA GR Equity FRAPORT AG Industrials 43.41 2.88% 15.05.2014 19.61 20.08 19.78 21.36 21.96 22.38 22.03 -0.068 -0.102 -0.149 -0.123 -0.083 -0.105 -0.099 0.004 0.001 0.004 0.001 0.000 0.001 0.001 FOE NO Equity FRED OLSEN ENERGY ASA Energy 251.60 3.97% 21.05.2014 FNTN GR Equity FREENET AG Telecommunication Services 18.41 7.06% 24.05.2013 22.49 22.46 23.18 22.71 23.53 22.29 21.56 -0.327 -0.194 -0.040 -0.088 -0.059 0.035 0.080 0.011 0.005 0.009 0.004 0.002 0.004 0.004 BE 500 Index FME GR Equity FRESENIUS MEDICAL CARE AG & Health Care 51.87 1.45% 19.05.2014 16.13 16.45 16.46 16.95 17.76 18.29 18.26 -0.165 -0.076 -0.118 -0.091 -0.049 -0.038 -0.020 0.026 0.008 0.004 0.002 0.001 0.001 0.001 FRE GR Equity FRESENIUS SE & CO KGAA Health Care 94.95 1.16% 20.05.2014 15.69 16.20 16.40 17.01 17.83 17.54 17.35 -0.253 -0.165 -0.153 -0.105 -0.070 -0.066 -0.048 0.018 0.002 0.005 0.002 0.001 0.002 0.002 GFS LN Equity G4S PLC Industrials 290.20 3.19% 18.09.2013 GALP PL Equity GALP ENERGIA SGPS SA Energy 12.05 2.19% 21.05.2013 GAM SW Equity GAM HOLDING AG Financials 16.70 2.99% 21.04.2014 21.66 22.05 22.38 23.67 25.46 24.73 -0.180 -0.081 -0.085 -0.084 -0.061 -0.010 0.015 0.008 0.007 0.003 0.001 0.001 GAS SM Equity GAS NATURAL SDG SA Utilities 15.26 5.99% 08.01.2014 27.32 26.63 26.16 25.32 24.92 24.60 24.39 -0.063 -0.039 -0.091 -0.083 -0.027 0.169 0.183 0.000 0.000 0.001 0.001 -0.001 -0.003 -0.003 GSZ FP Equity GDF SUEZ Utilities 14.48 10.36% 25.09.2013 20.71 21.68 22.27 22.87 22.88 20.83 20.93 -0.183 -0.044 -0.107 -0.107 0.012 -0.006 0.015 0.024 0.012 0.006 0.002 0.002 0.003 0.004 G1A GR Equity GEA GROUP AG Industrials 26.26 2.09% 22.04.2014 19.76 21.78 22.19 23.04 25.07 26.50 26.28 -0.224 -0.190 -0.133 -0.127 -0.095 -0.109 -0.105 0.017 0.002 0.003 0.002 0.001 0.001 0.001 GEBN VX Equity GEBERIT AG-REG Industrials 231.30 2.85% 08.04.2014 13.53 15.19 15.18 16.67 17.19 17.17 -0.142 -0.144 -0.177 -0.125 -0.102 -0.083 0.019 0.007 0.006 0.004 0.003 0.004 GTO FP Equity GEMALTO Information Technology 70.20 0.48% 28.05.2014 24.82 24.78 24.80 25.15 26.58 25.21 -0.086 -0.005 -0.001 0.006 -0.062 0.007 0.005 0.000 0.000 0.000 0.000 0.000 GEM IM Equity GEMINA SPA Industrials 1.29 23.06.2014 GETIB SS Equity GETINGE AB-B SHS Health Care 194.70 2.13% 24.03.2014 54.62 22.32 17.00 18.91 18.73 0.554 0.377 0.134 -0.131 -0.501 -0.025 -0.002 0.012 0.002 0.025 GJF NO Equity GJENSIDIGE FORSIKRING ASA Financials 96.50 7.10% 25.04.2014 24.08 21.03 16.25 15.05 -0.989 -0.462 0.126 0.095 0.151 0.096 0.031 0.007 GKN LN Equity GKN PLC Consumer Discretionary 271.70 2.80% 07.08.2013 GLB ID Equity GLANBIA PLC Consumer Staples 8.59 1.10% 04.09.2013 GSK LN Equity GLAXOSMITHKLINE PLC Health Care 1511.50 5.29% 08.05.2013 13.69 14.53 14.81 15.34 16.40 14.95 14.36 -0.193 -0.175 -0.206 -0.171 -0.088 -0.057 -0.040 0.007 0.008 0.005 0.002 0.002 0.002 0.002 GLEN LN Equity GLENCORE INTERNATIONAL PLC Materials 366.40 2.90% 28.08.2013 23.11 24.59 24.49 25.14 25.83 26.07 24.82 -0.089 -0.162 -0.175 -0.105 -0.097 -0.090 -0.058 0.017 0.003 0.001 0.002 0.002 0.000 0.001 GN DC Equity GN STORE NORD A/S Health Care 106.50 0.46% 21.03.2014 23.39 25.88 25.36 26.35 26.16 -0.127 -0.159 -0.139 -0.046 -0.030 0.038 0.014 0.010 0.000 0.001 GPOR LN Equity GREAT PORTLAND ESTATES PLC Financials 492.80 1.76% 29.05.2013 GRF SM Equity GRIFOLS SA Health Care 28.36 0.78% 02.07.2013 29.26 27.77 26.69 24.54 22.21 21.42 21.42 -0.134 -0.093 -0.108 -0.120 -0.136 -0.140 -0.133 0.003 0.002 0.002 0.002 0.002 0.001 0.002 GBLB BB Equity GROUPE BRUXELLES LAMBERT SA Financials 60.78 4.36% 28.04.2014 11.47 11.36 12.06 11.39 12.17 12.17 -0.019 0.060 -0.100 -0.134 -0.111 -0.108 0.017 0.011 0.016 0.007 0.003 0.003 GET FP Equity GROUPE EUROTUNNEL SA - REGR Industrials 6.58 1.52% 21.05.2013 23.27 22.64 24.16 23.74 24.42 22.02 -0.346 -0.120 -0.042 -0.005 -0.012 0.047 0.018 0.003 -0.001 0.001 0.001 0.004 LUN DC Equity H LUNDBECK A/S Health Care 102.00 1.96% 19.03.2014 HLMA LN Equity HALMA PLC Information Technology 519.00 2.07% 17.07.2013 HMSO LN Equity HAMMERSON PLC Financials 498.90 5.59% 14.08.2013 HNR1 GR Equity HANNOVER RUECKVERSICHERU-REG Financials 62.02 4.84% 08.05.2014 18.56 17.21 17.53 17.93 18.33 17.30 16.62 -0.303 -0.158 -0.131 -0.137 -0.095 -0.055 -0.022 0.021 0.008 0.008 0.005 0.002 0.003 0.003 HL/ LN Equity HARGREAVES LANSDOWN PLC Financials 902.50 3.06% 11.09.2013 HEI GR Equity HEIDELBERGCEMENT AG Materials 56.65 0.83% 05.05.2014 24.54 25.92 26.24 26.89 27.59 29.82 29.57 -0.209 -0.191 -0.163 -0.112 -0.078 -0.064 -0.036 0.008 0.006 0.005 0.003 0.001 0.001 0.001 HEIO NA Equity HEINEKEN HOLDING NV Consumer Staples 49.76 1.85% 26.08.2013 HEIA NA Equity HEINEKEN NV Consumer Staples 58.79 1.56% 26.08.2013 16.32 18.41 17.99 17.97 17.75 18.51 18.63 -0.481 -0.188 -0.172 -0.127 -0.069 -0.072 -0.051 0.018 0.006 0.006 0.004 0.001 0.001 0.001 ELPE GA Equity HELLENIC PETROLEUM SA Energy 7.75 3.87% 30.09.2013 HTO GA Equity HELLENIC TELECOMMUN ORGANIZA Telecommunication Services 5.30 09.07.2014 64.20 64.20 64.20 63.26 0.000 0.000 0.000 0.000 0.000 0.000 0.000 0.000 HGG LN Equity HENDERSON GROUP PLC Financials 164.40 4.72% 28.08.2013 HMB SS Equity HENNES & MAURITZ AB-B SHS Consumer Discretionary 227.60 4.17% 24.04.2014 19.06 17.17 17.66 17.67 18.21 18.28 -0.172 0.009 -0.030 -0.074 -0.084 -0.084 0.032 0.020 0.013 0.006 0.003 0.003 HEXAB SS Equity HEXAGON AB-B SHS Information Technology 175.40 1.33% 12.05.2014 21.30 21.30 21.30 21.30 21.30 0.000 0.000 0.000 0.000 0.000 0.000 0.000 0.000 0.000 0.000 HOT GR Equity HOCHTIEF AG Industrials 54.51 1.83% 08.05.2014 25.62 26.38 27.57 26.32 29.42 29.18 28.83 -0.330 -0.148 -0.117 -0.122 -0.098 -0.105 -0.096 0.010 0.002 0.003 0.001 0.000 0.002 0.002 HOLN VX Equity HOLCIM LTD-REG Materials 76.45 1.50% 21.04.2014 16.64 18.19 18.67 19.72 20.41 20.28 20.10 -0.225 -0.160 -0.165 -0.136 -0.101 -0.083 -0.075 0.010 0.005 0.005 0.003 0.001 0.002 0.002 HOLMB SS Equity HOLMEN AB-B SHARES Materials 192.80 4.67% 10.04.2014 17.03 16.69 16.46 17.54 20.93 0.025 -0.001 -0.050 -0.111 -0.096 0.048 0.029 0.020 0.009 0.001 HSBA LN Equity HSBC HOLDINGS PLC Financials 715.00 6.11% 22.05.2013 16.51 17.63 17.44 18.30 18.73 18.29 17.92 -0.332 -0.108 -0.171 -0.128 -0.030 -0.036 -0.014 0.015 0.003 0.006 0.005 0.001 0.004 0.005 HUFVA SS Equity HUFVUDSTADEN AB-A SHS Financials 84.25 3.09% 21.03.2014 BOSS GR Equity HUGO BOSS AG -ORD Consumer Discretionary 85.00 3.67% 05.05.2014 29.08 29.64 29.73 29.90 30.22 29.50 28.63 -0.102 -0.076 -0.142 -0.123 -0.094 -0.053 -0.013 0.001 0.001 0.001 0.001 0.001 0.001 0.001 HUSQB SS Equity HUSQVARNA AB-B SHS Consumer Discretionary 37.19 4.03% 14.04.2014 22.78 24.27 23.27 24.17 28.14 28.05 0.678 0.443 0.326 0.075 -0.092 -0.090 0.071 0.043 0.030 0.013 0.002 0.002 IBE SM Equity IBERDROLA SA Utilities 3.98 4.34% 03.01.2014 28.40 27.96 29.21 26.02 25.72 26.08 26.44 -0.146 -0.138 -0.118 -0.336 -0.329 -0.228 -0.127 0.003 0.003 0.002 0.004 0.003 0.000 -0.001 IAP LN Equity ICAP PLC Financials 327.80 6.89% 26.06.2013 28.06 28.06 28.06 27.50 -0.121 -0.121 -0.121 -0.105 0.002 0.002 0.002 0.001 IGG LN Equity IG GROUP HOLDINGS PLC Financials 554.00 4.06% 18.09.2013 ILD FP Equity ILIAD SA Telecommunication Services 158.80 0.23% 04.06.2013 22.35 22.39 22.75 22.50 22.49 22.42 -0.098 0.003 0.020 0.003 -0.002 0.015 0.004 0.000 0.000 0.000 0.000 0.000 IMI LN Equity IMI PLC Industrials 1316.00 2.56% 04.09.2013 IIA AV Equity IMMOFINANZ AG Financials 3.16 4.75% 08.10.2013 24.03 21.02 21.24 23.88 33.48 34.91 0.928 -0.087 -0.155 0.147 0.570 0.710 -0.012 0.018 0.012 0.000 -0.011 -0.014 IMT LN Equity IMPERIAL TOBACCO GROUP PLC Consumer Staples 2333.00 4.88% 17.07.2013 18.13 18.13 18.13 19.16 0.078 0.078 0.078 0.010 -0.001 -0.001 -0.001 0.002 INCH LN Equity INCHCAPE PLC Consumer Discretionary 505.50 2.96% 07.08.2013 ITX SM Equity INDITEX Consumer Discretionary 101.35 1.87% 02.05.2014 28.83 27.46 28.02 27.69 26.46 25.93 25.47 -0.144 -0.125 -0.162 -0.149 -0.162 -0.134 -0.106 0.001 0.001 0.001 0.000 0.001 0.000 0.000 INDUA SS Equity INDUSTRIVARDEN AB-A SHS Financials 120.10 4.16% 08.05.2014 IFX GR Equity INFINEON TECHNOLOGIES AG Information Technology 6.43 2.02% 07.03.2014 30.11 33.01 32.55 32.33 32.55 32.34 31.60 -0.179 -0.157 -0.113 -0.084 -0.057 -0.046 -0.017 0.007 0.002 0.004 0.001 0.001 0.002 0.002 INF LN Equity INFORMA PLC Consumer Discretionary 511.00 3.72% 14.08.2013 ING FP Equity INGENICO Information Technology 44.25 1.58% 13.05.2013 ISAT LN Equity INMARSAT PLC Telecommunication Services 700.50 4.35% 02.10.2013 IHG LN Equity INTERCONTINENTAL HOTELS GROU Consumer Discretionary 1990.00 2.16% 21.08.2013 17.67 17.67 17.67 19.80 -0.077 -0.077 -0.077 -0.069 0.003 0.003 0.003 0.002 IAG LN Equity INTL CONSOLIDATED AIRLINE-DI Industrials 265.50 07.08.2013 27.56 28.25 28.48 31.40 -0.253 -0.084 -0.046 -0.058 0.029 0.002 0.003 0.000 ITRK LN Equity INTERTEK GROUP PLC Industrials 3412.00 1.26% 30.10.2013 ISP IM Equity INTESA SANPAOLO Financials 1.17 4.29% 19.05.2014 38.76 39.16 37.82 36.69 35.72 33.57 34.38 -0.398 -0.236 -0.149 -0.134 -0.096 -0.084 -0.070 0.013 0.003 0.004 0.002 0.001 0.002 0.002 INTU LN Equity INTU PROPERTIES PLC Financials 329.80 4.55% 16.10.2013 ISYS LN Equity INVENSYS PLC Industrials 358.80 1.39% 19.06.2013 22.21 22.21 22.21 23.30 -0.088 -0.088 -0.088 -0.068 0.004 0.004 0.004 0.003 KINVB SS Equity INVESTMENT AB KINNEVIK-B SHS Financials 147.60 4.40% 16.05.2014 14.87 15.40 15.26 17.72 18.45 0.000 -0.019 -0.038 -0.003 -0.061 0.000 0.001 0.001 0.000 0.000 INVEB SS Equity INVESTOR AB-B SHS Financials 188.10 3.72% 16.04.2014 14.71 14.30 14.73 15.04 17.41 17.51 0.044 0.048 -0.026 -0.043 -0.097 -0.096 0.040 0.025 0.018 0.011 0.002 0.002 ITV LN Equity ITV PLC Consumer Discretionary 130.30 2.23% 30.10.2013 22.95 22.95 22.95 20.52 0.237 0.237 0.237 0.123 0.003 0.003 0.003 0.010 SBRY LN Equity SAINSBURY (J) PLC Consumer Staples 370.50 4.56% 15.05.2013 20.63 20.46 20.56 19.17 18.62 18.62 -0.119 0.001 -0.014 -0.017 0.022 0.022 0.008 0.003 0.004 0.002 0.000 0.000 DEC FP Equity JC DECAUX SA Consumer Discretionary 20.79 2.12% 16.05.2013 27.81 25.62 27.96 28.84 28.70 28.10 0.126 0.167 0.075 0.039 0.040 0.049 -0.006 0.000 0.000 0.000 0.000 0.000 JMT PL Equity JERONIMO MARTINS Consumer Staples 15.67 1.88% 30.04.2013 WG/ LN Equity WOOD GROUP (JOHN) PLC Energy 853.50 1.39% 28.08.2013 Q.M.S Advisors | tel: +41 (0)78 922 08 77 | e-mail: info@qmsadv.com |