Get Premium Attur Layout Call Girls (8005736733) 24x7 Rate 15999 with A/c Roo...
Paris conf v1-sg
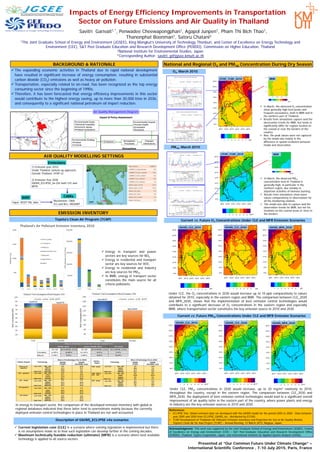
1. BACKGROUND & RATIONALE
Impacts of Energy Efficiency Improvements in Transportation
Sector on Future Emissions and Air Quality in Thailand
Savitri Garivait1,*, Penwadee Cheewapongphan1, Agapol Junpen1, Pham Thi Bich Thao1,
Thanonphat Boonman1, Satoru Chatani2
1The Joint Graduate School of Energy and Environment (JGSEE), King Mongkut’s University of Technology Thonburi, and Center of Excellence on Energy Technology and
Environment (CEE), S&T Post Graduate Education and Research Development Office (PERDO), Commission on Higher Education, Thailand
2National Institute for Environmental Studies, Japan
*Corresponding Author: savitri_g@jgsee.kmutt.ac.th
Acknowledgment: This work was supported by the Joint Graduate School of Energy and Environment (JGSEE), Center
of Excellence on Energy and Environment (CEE) – S&T Post-Graduate Education and Research Development Office
(PERDO), Thailand; Toyota Cooperation, Japan; and International Institute for Applied System Analysis (IIASA).
Presented at “Our Common Future Under Climate Change” –
International Scientific Conference , 7-10 July 2015, Paris, France
References
• ECLIPSE V4a: Global emission data set developed with the GAINS model for the period 2005 to 2050 - Data between
year 2005 and 2050 from ECLIPSE_GAINS_4a - distributed by ECCAD.
• TCAP-Development of Thailand’s Air Pollutant Emission Inventory and Projection for Use in Air Quality Models,
Toyota’s Clean Air for Asia Project (TCAP) – Annual Meeting, 12 March 2015, Nagoya, Japan.
The expanding economic activities in Thailand due to rapid national development
have resulted in significant increase of energy consumption, resulting in substantial
carbon dioxide (CO2) emissions as well as heavy air pollution.
Transportation, especially related to on-road, has been recognized as the top energy
consuming sector since the beginning of 1990s.
Therefore, it has been forecasted that energy efficiency improvements in this sector
would contribute to the highest energy saving, up to more than 30,000 ktoe in 2036,
and consequently to a significant national petroleum oil import reduction.
AIR QUALITY MODELLING SETTINGS
National and Regional O3 and PM10 Concentration During Dry Season
EMISSION INVENTORY
O3, March 2010
Current vs. Future O3 Concentrations Under CLE and MFR Emission Scenarios
PM10, March 2010
Current vs. Future PM10 Concentrations Under CLE and MFR Emission Scenarios
In March, the observed O3 concentration
show generally high level peaks and
frequent exceedance, both in BMR and in
the northern part of Thailand.
Results from simulations capture well the
observation trends for BMR, but tends to
significantly differ for regions located on
the coastal or near the borders of the
country.
Also, the peak values were not captured
by the model due mainly to the
difference in spatial resolution between
model and observation.
Description of GAINS_ECLIPSE v4a scenarios
Energy in transport and power
sectors are key sources for NOx.
Energy in residential and transport
sector are key sources for VOC.
Energy in residential and industry
are key sources for PM10.
In BMR, energy in transport sector
constitutes the main source for all
criteria pollutants.
In energy in transport sector, the comparison of the developed emission inventory with global or
regional databases indicated that these latter tend to overestimate mainly because the currently
deployed emission control technologies in place in Thailand are not well accounted.
ppb
ppb
ppb
1) Emission year 2010:
Inside Thailand: bottom up approach,
Outside Thailand: HTAP v2
2) Emission Year 2030
GAINS_ECLIPSE_4a (for both CLE and
MFR)
Emissions
Input: NCEP FNL data
Mechanism: CB05
ICs and BCs: MOZART
CAMxWRF
Current legislation case (CLE) is a scenario where existing legislation is implemented but there
is no assumptions made as to how such legislation can develop further in the coming decades.
Maximum technically feasible reduction (ultimate) (MFR) is a scenario where best available
technology is applied to all source-sectors.
Atmosphere
Impact & Policy Assessment
Environmental Strategy
Policies
Controls
Environmental Goals
Technical Feasibility
Economic Issues
Political Implications
Environmental Impacts
Human Health
Ecosystem
Economic
Atmospheric
Processes
Pollutant
Distributions
Emissions
Air Quality Management Diagram
Toyota’s Clean Air Program (TCAP)
Discussions: to be added
µg/m3
ppb ppb
Under CLE, the O3 concentrations in 2030 would increase up to 10 ppb comparatively to values
obtained for 2010, especially in the eastern region and BMR. The comparison between CLE_2030
and MFR_2030, shows that the implementation of best emission control technologies would
contribute to a significant decrease of O3 concentrations in the eastern region and especially
BMR, where transportation sector constitutes the key emission source in 2010 and 2030.
Under CLE, PM10 concentrations in 2030 would increase, up to 20 mg/m3 relatively to 2010,
throughout the country, except in the eastern region. The comparison between CLE_2030 and
MFR_2030, the deployment of best emission control technologies would lead to a significant overall
improvement of air quality latter in the eastern part of the country, where power plants and energy
in industry are the key emission sources in 2010 and 2030.
In March, the observed PM10
concentration level in Thailand is
generally high, in particular in the
northern region, due notably to
important activities of biomass burning.
Results from simulations show lower
values comparatively to observations for
all the monitoring stations.
The model was able to capture well the
observation trends for BMR, but not for
locations on the coastal areas or close to
the borders.
µg/m3µg/m3
GAINS_CLE_2010 GAINS_CLE_2030 GAINS_MFR_2030
µg/m3
GAINS_CLE_2010 GAINS_CLE_2030 GAINS_MFR_2030
HTAP_TCAP_2010
HTAP_TCAP_2010
BMR
BMR
µg/m3