1. CHAPTER 2 – PIE CHARTS
Below you will find the steps to create the following pie chart using Excel.
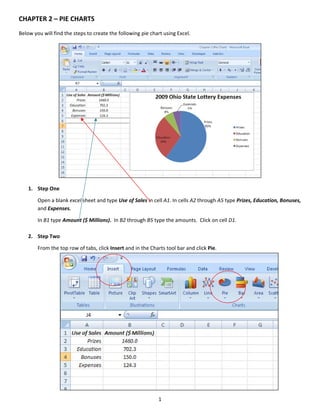
1. Step One
Open a blank excel sheet and type Use of Sales in cell A1. In cells A2 through A5 type Prizes, Education, Bonuses,
and Expenses.
In B1 type Amount ($ Millions). In B2 through B5 type the amounts. Click on cell D1.
2. Step Two
From the top row of tabs, click Insert and in the Charts tool bar and click Pie.
1
2. Select the top‐left 2‐D pie chart. A blank chart will appear.
In Excel’s top row, a Chart Tools tab will appear. Select the Design option. Click the Select Data option from the
tool bar. A Select Data Source window will appear. For the chart data range, using the mouse, select all cells
from A1 to B5. Click OK.
2
3. 3. Step Three
To edit the table to add data labels click on the pie chart. Right click for the options menu. Click Add Data Labels.
Click on the pie chart again. Right click for the options menu. Select Format Data Labels. Make sure Category
Name, Percent, and Leader Lines are checked. Uncheck all other boxes that might be checked. Click Closed.
3
4. 4. Step Four
Double click on the chart title and rename 2009 Ohio State Lottery Expenses. Your Pie Chart is now complete.
4