SlideShare ist ein Scribd-Unternehmen logo
1 von 5
Downloaden Sie, um offline zu lesen
QUALMAN K33
3rdSY2015

QUIZ #3 REVIEWER
I. SERVICE QUALITY
Service Quality
1. The extent of discrepancy (gap) between the
customer’s exception and their perceptions
ES < PS: Quality Surprise
ES = PS: Satisfactory Quality
ES > PS: Unacceptable Quality
Expected Service (ES)
1. Customers expectations that are influenced by:
a. word of mouth
b. past experience
c. personal needs
d. external communications (ex.marketing)
Perceived Service (PS)
1. Perceptions formed as a customer experiences the
service process
SERVQUAL
1. A gap analysis technique that compares the
company’s service performance V.S. customer’s
service quality needs
2. It is a FEEDBACK about the organization’s ability to
provide quality service
Measuring Service Quality: SERVQUAL MODEL.
a) Reliability
b) Responsiveness
c) Assurance
d) Empathy
e) Tangibles
5 SERVQUAL DIMENSIONS
1. Tangibles — Physical facilities, equipment and
appearance of personnel. Firm’s ability to manage
its tangibles
• Physical Evidence
2. Reliability — Ability to perform the promised service
dependably and accurately. Reflects the consistency
and dependability of the firm’s performance.
• Dependability
• Delivering on promises
• Accuracy
• Consistency
3. Responsiveness — Willingness to help customers
and provide prompt service.
• Promptness
• Helpfulness
4. Assurance — (including competence, courtesy,
credibility and security). Knowledge and courtesy of
employees and their ability to inspire trust and
confidence. Reflects the competence of the firm, the
courtesy extended to its customers, and the security
of its operations.
• Competence
• Courtesy
• Credibility
• Security
5. Empathy — (including access, communication,
understanding the customer). Caring and
individualized attention that the firm provides to its
customers.The ability to experience another’s
feelings as one’s own
• Easy Access
• Good Communication
• Customer Understanding
• Personalized Attention
SERVQUAL INSTRUMENT
Multi - item scale survey used to measure FEEDBACK
(customer perceptions of service quality).
A seven-point scale ranging from “Strongly Agree” (7)
to “Strongly Disagree” (1)
The Gaps Model of SERVQUAL
Where are the things going WRONG?
GAP 5: Expected VS Perceived Service
• Customer did not experience their
EXPECTED service.
• Reality does not meet expectations.
GAP 4: External Communications VS Service
Delivered
• Service delivered did not meet the
communicated service quality that marketing
promised.
GAP 3: Service Delivered VS Translation of
Perceptions into Service Quality Specifications
• Service delivered did not meet the standards
made.
GAP 2: Translation of Perceptions into Service
Quality Specifications VS Management
Perception on Consumer’s Expectation
• Standards made by Management is incorrect.
GAP 1: Management Perception VS Consumer’s
Expectations
• Management doesn’t understand customer.
RESONS THAT CAN CAUSE THE GAPS
GAP 5:
• Not knowing what customers expect
• Not selecting the right service standards and designs
• Not delivering to service standards
• Not matching performance to promised
GAP 4:
■ Lack of integration of marketing communications
■ Inadequate management of customer expectations
■ Over promising
GAP 3:
■ Poor human resource policies
■ Failure to match supply and demand
■ Customer not fulfilling their roles
■ Problems with service intermediaries
GAP 2:
■ Poor service design
■ Absence of customer-defined service standards
■ Inappropriate physical evidence and service scape
GAP 1:
• Inadequate marketing research orientation
• Lack of upward communication
• Insufficient relationship focus
• Inadequate service recovery
CLOSING GAPS
Gap 1: Learn what customers expect
• Use research, complaint analysis, customer panels
• Increase direct interactions between managers and
customers
• Improve upward communications
• Act on information and insights
Gap 2: Establish the right service quality standards
• Top management commitment to providing service
quality
• Set, communicate, and reinforce customer-oriented
service standards
• Establish challenging and realistic service quality
goals
• Train managers to be service quality leaders
• Be receptive to new ways to deliver service quality
• Standardize repetitive tasks
• Prioritize tasks
• Gain employee acceptance of goals and priorities
• Measure performance of service standards and
provide regular feedback
• Reward managers and employees for achievement
of quality goals
Gap 3: Ensure that service performance meets standards
• Attract the best employees
• Select the right employees
• Develop and support employees
- train employees
- provide appropriate technology & equipment
- encourage and build teamwork
- empower employees
- internal marketing
• Retain good employees
- measure and reward service quality achievements
- develop equitable and simple reward systems
Gap 4: Ensure that delivery matches promises
• Retain good employees
- measure and reward service quality achievements
- develop equitable and simple reward systems
• In advertising, focus on service characteristics that are
important to customers
• Manage customer’s expectations
- What are realistic expectations?
- Explain industry realities
• Tiered service options
- Offer different levels of service - user pays
Service Satisfaction Information System
• Customer Complaints
• Surveys
• Employee Surveys
• Focus Groups
• ‘Mystery shopping’ research
• Competitive market surveys - benchmark
Measuring Satisfaction
• Qualitative Research
• Understand key drivers / determinants
• Questionnaire design
• Data analysis
• Service performance index (SPI)
• Importance - performance analysis
SERVQUAL QUASTIONAIRE
• Expectations Section
Contains 22 statements to ascertain the general
expectations of customers concerning a service
that would relate to an "excellent" company
• Perceptions Section
Contains a matching set of 22 statements to
measure customers’ assessment of a specific
firm within the service category
• Five Feature Ranking
Assessment of the relative importance of the five
dimensions
II. PROJECT MANAGEMENT
What is Project?
• A unique venture with a beginning and end, conducted
by people to meet established goals within parameters
of cost, schedule and quality.
• Goal-oriented
• Temporary endeavor
Project Management
1. overseeing all its processes
2. ensure goals are accomplished on time
3. within the limits of a budget
4. using assigned resources
5. while addressing risks, managing changes and
satisfying stakeholders
ScorenExpectatio-ScorePerceptionScoreSERVQUAL =
Project Life Cycle
1. Initiating Process
2. Planning Process
3. Monitoring and Controlling Process
4. Executing Process
5. Closing Process
Develop Project Charter
• a document that formally recognizes the existence of
a project
• provides direction on the project’s objectives and
management
The Project Charter
• A charter is an agreement between management and
the team about what is expected.
• The charter:
- Clarifies what is expected of the team.
- Keeps the team focused.
- Keeps the team aligned with organizational
priorities.
- Transfers the project from the champion(s) to the
project team.
The Business Case
• Why is this project important?
• Has anyone else (internal or external to the
organization) attempted to solve this problem or a
similar one before?
• If so, what findings are useful for the success of the
project?
• Make sure that the project is linked to key business
goals and objectives.
• What business indices will be improved by the project?
• What are the projected cost savings/opportunities on
this project?
Deliverables (Project Benefits)
• Business Results
• Customer Benefits
• Safety, Environmental and Other Impacts
Project Metrics
• What will be the primary measure of success?
• How will these be measured and tracked?
• What is the target (specifications) for the measures?
• What defects will you be tracking?
Elements of a Team Charter
• Team Demographics
• Business Case
• Project Scope (focus and direction)
• Project Measures (indicators)
• Deliverables (Customer Benefits and Business
Results)
• Resources accessible to the team
• Project Plan
Team Size Consideration
• Ideal team size: 5- 8
• Smaller Team Size: 3 to 4 ->work faster
• Teams greater than 8 require additional facilitation and
often require sub-teams.
- Unavoidable when greater functional
representation is needed.
- Given resource constraints, members are often
part-time.
Types of Cost Savings
a. Cost Reduction (Savings)
b. Cost Avoidance (Threats)
Types of Business Impact
a. Potential Improvement
- Reduce inventory levels
- reduce time to market
- reduce equipment downtime
- reduce rejects/rework
- speed up delivery time
b. Potential Impact
- Reduce capital investment in inventory
- increase revenues through increased sales
- increase capacity
- decrease material cost; greater ROI
- increase revenues
Project Scope
• What process is involved?
• What is the start and end (boundaries) of the process?
• What is the period of the study?
• What is not within scope?
• Is the project scope manageable?
• What are the existing constraints that might affect the
execution of the project?
• Is the problem refined enough?
- Avoid “boiling the ocean”
- Make sure scope is appropriate and manageable
• Use Pareto Analysis to refine the scope
Developing Milestones
• Project plans often start with identifying key
milestones.
• Milestones represent important decision points. The
completion of each step in the PPDM process is
usually a milestone.
• The whole team should participate in defining and
establishing dates for milestones. There should be
about 10-15 milestones.
• Once milestones are defined, group them into logical
sequences.
a) DEFINE MILESTONES
b) GROUP THEM INTO LOGICAL SEQUENCE
• Use tools such as GANTT Charts, PERT Charts, or
Network Diagrams to show the relationship between
milestones.
Roadmap/Milestones
• Start date? Target completion date?
• What are the highlights for the completion of the
project and its respective estimated dates of
completion?
• When will each phase (D, M, A, I, and C) be
completed?
Resources and Schedules
■ What are the critical resources needed to pursue this
project?
- Support Functions,
- People and Talent,
- Time,
- SMEs,
- Budget,
- etc?
Project Approval
■ Completion of the project would be finalized when
approval signatures have been secured from the
sponsor, finance, quality, and technical.
■ This ensures that project has delivered the benefits.
III. PROJECT MANAGEMENT PLAN
Work Breakdown Structure (WBS)
The tool for breaking down a project into its components
parts. A foundation document that provides the basis for:
a. planning
b. managing project schedules
c. costs
d. resources
e. changes
Guide Questions for WBS:
1. Do you require two or more intermediate activities to
produce this deliverable?
2. Can you accurately estimate the resources you will
need to perform the work to produce this deliverable?
3. Can you accurately estimate how long it will take to
produce this deliverable?
4. If you have to assign the work to produce this
deliverable to someone else, are you confident that
person will understand exactly what to do?
Work Breakdown Structure
■ There are two (2) kinds of tasks on a WBS:
1. SUMMARY TASKS — is not actually executed, it
is a summarization of the subordinate work
package.
2. WORK PACKAGES — are actually executed.
• Decomposition is subdividing project deliverables into
smaller pieces
• A work package is a task at the lowest level of the
WBS
- Representing a collection of work actions
necessary to create a specific result
Building a Work Breakdown Structure
WBS Step 1: Begin at the Top
A WBS breaks down a project into descending levels of
details, naming all the tasks required to create the
deliverables.
Begin the breakdown process by:
1. List the major deliverables/high level tasks from
the scope statement
2. Use continuous improvement to assess > analyze >
act
WBS Step 2: Name All the Tasks Required to
Produce Deliverables
A task name describes an activity that produces a
product. The next step is to break down each task into
the lower-level, detailed tasks required to produce the
product.
WBS Step 3: How to Organize the WBS
Place work packages under different summary task
headings. The overall project will remain the same even
though the work packages are grouped differently.
Group the various components of a product or major
phases of the product release.
Summary Tasks
- Open-ended tasks – a task with no hard products
being produced, these are activities that could go
on indefinitely.
- Open-ended activities - a task with no action
required.
WBS Step 4: Identify Task Relationship
1. Define task relationship only between work
packages
2. Task relationships should reflect only sequence
constraints between work packages, not resource
constraints.
Type of Dependancies
1. Finish-to-start: This most common type of
dependency link accounts for more than 90 percent of
the dependencies you create. In this relationship, the
predecessor task must be completed before the
successor task can start. When you create a
dependency, the default setting is finish-to-start.
2. Start-to-start: The start of one task is dependent on
the start of another. In this dependency type, two tasks
can start simultaneously, or one task might have to
start before another task can start.
3. Finish-to-finish: In a finish-to-finish relationship, one
task (you guessed it) must finish before or at the
same time as another task.
4. Start-to-finish: In a start-to-finish dependency, the
predecessor task can finish only after the successor
task has started. If the successor is delayed, the
predecessor task cannot finish. Of course, this type of
relationship is abbreviated as SF.
WBS Step 5: Milestones are Useful Markers
Milestones are markings of significant events in the life of
a project, with zero duration. Three reasons:
1. Project start and finish milestones are useful anchors
for the network.
2. Task relationships should reflect only sequence
constraints between work packages, not resource
constraints.
3. A milestone can represent significant events that are
not already represented by a work passage or
summary of task.
IV. PROJECT RISK MANAGEMENT
What is Risk?
- The possibility of loss, injury, disadvantage or
destruction
- The chance of something happening that will have an
impact on objectives
Risk Management
The art and science of identifying, analyzing, and
responding to risk throughout the life of a project and in
the best interests of meeting project objectives
Strategies for Negative Risks or Threats
1. Avoidance
2. Transfer
3. Mitigate
4. Accept
Identify Risks
Possible sources:
➢Technical — Project or Environment
➢ Business Case
➢Planning
➢Organizational
➢External
Technical Risks
Project
✓Effect of Product/Service Failure, Safety Impact?
✓Complex Product/Process Functions?
✓Complex or Hazardous Design Elements (Materials, Fit,
Sequence, IT, Human, etc.)?
✓Complex Interaction with Existing Processes?
✓Unclear Requirements, Specifications
✓Package Solutions (IT):
▪ Available Packages Not or Poorly Evaluated?
▪ Functional Capability Requirements
Mismatch?
Environmental
✓Inappropriate Development Tools/ Methods?
✓New/Unfamiliar Technology?
✓Unstable Development Team?
✓Low Project Team Knowledge of Business Area?
✓Low/Inadequate Project Team Skills?
✓Poor Development Method/Project Approach?
Business Risks
✓ Major Increase in Costs Possible?
✓ Evolving Business/Customer Requirements?
✓ Incomplete Definition of Scope/Requirements?
✓ Poorly Defined Benefits?
✓ Excessive Lead Time for Return on Investment?
✓ Mission Critical System?
✓ Fundamental to Business Strategy?
✓ Business Commitment to Development?
Planning Risks
✓ Complex Project Task Dependencies?
✓ Critical Implementation Date?
✓ Informal Project Control Procedures?
✓ High Ratio: Development Person/ Years to
Development Calendar Years?
✓ High Number of Major New Functions to Design?
✓ Unrealistic Target Dates?
✓ Low Commitment to Targets by Team?
✓ Low Experience of Project Manager?
✓ Resources Available to Resources Required
Mismatch?
Organizational Risks
✓ Large Number of Decision Makers?
✓ Multiple Geographic Locations (Design, Production)?
✓ Unrealistic Expectations by Customers, Users,
Stakeholders?
✓ Impacted Departments/Company of Large Size?
✓ Inappropriate Level of Sponsorship?
✓ Unavailability of Key Users, Internal Customers?
✓ Significant Changes Required by Organization?
✓ Resistance to Change by Current Organization?
✓ Extensive Education of Users/Internal Customers
Required?
External Risks
✓ Multiple Vendors, Contractors, Consultants?
✓ Poor Vendor Support?
✓ Project Critically Dependent on External Suppliers?
✓ Large Number of Inter-Project Dependencies?
✓ Overlapping Scope with Other Projects?
✓ Extensive Recruitment of External Resources to Staff
New Processes?
STEPS TO RISK MANAGEMENT
STEP 1: RISK IDENTIFICATION — Identify
potential problems of your solutions
STEP 2: RISK ASSESSMENT — Determine the
likelihood of their occurrence
STEP 3: RESPONSE STRATEGY — Take steps
to avoid or deal with the likely problems in order
to have higher chance of success

Weitere ähnliche Inhalte

Was ist angesagt?

Financial management unit 4 working capital management
Financial management unit 4 working capital managementFinancial management unit 4 working capital management
Financial management unit 4 working capital managementGanesha Pandian
 
Operations strategy
Operations strategyOperations strategy
Operations strategyRajThakuri
 
823 Cost Accounting XI.pdf
823 Cost Accounting  XI.pdf823 Cost Accounting  XI.pdf
823 Cost Accounting XI.pdfRAJAGOPALBABU
 
INDIVIDUAL ASSIGNMENT STRATEGY AND CHANGE PROCESS AMINA PATEL
INDIVIDUAL ASSIGNMENT STRATEGY AND CHANGE PROCESS AMINA PATELINDIVIDUAL ASSIGNMENT STRATEGY AND CHANGE PROCESS AMINA PATEL
INDIVIDUAL ASSIGNMENT STRATEGY AND CHANGE PROCESS AMINA PATELAmina Patel
 
Complimentary Access! SiriusDecisions Channel Sales Strategies Research Brief...
Complimentary Access! SiriusDecisions Channel Sales Strategies Research Brief...Complimentary Access! SiriusDecisions Channel Sales Strategies Research Brief...
Complimentary Access! SiriusDecisions Channel Sales Strategies Research Brief...Mindmatrix Partner Relationship Manager
 
Rayhaan Kader Assignment RMDP 2014
Rayhaan Kader Assignment RMDP 2014Rayhaan Kader Assignment RMDP 2014
Rayhaan Kader Assignment RMDP 2014Rayhaan Kader
 
Decision Making Int 2
Decision Making Int 2Decision Making Int 2
Decision Making Int 2Marcus9000
 
Strategic analysis4927
Strategic analysis4927Strategic analysis4927
Strategic analysis4927Ahmed Zidan
 

Was ist angesagt? (19)

9707 s14 ms_21
9707 s14 ms_219707 s14 ms_21
9707 s14 ms_21
 
9707 w14 qp_12
9707 w14 qp_129707 w14 qp_12
9707 w14 qp_12
 
9707 s14 qp_13
9707 s14 qp_139707 s14 qp_13
9707 s14 qp_13
 
Financial management unit 4 working capital management
Financial management unit 4 working capital managementFinancial management unit 4 working capital management
Financial management unit 4 working capital management
 
Operations strategy
Operations strategyOperations strategy
Operations strategy
 
9707 w14 ms_22
9707 w14 ms_229707 w14 ms_22
9707 w14 ms_22
 
823 Cost Accounting XI.pdf
823 Cost Accounting  XI.pdf823 Cost Accounting  XI.pdf
823 Cost Accounting XI.pdf
 
9707 s14 ms_22
9707 s14 ms_229707 s14 ms_22
9707 s14 ms_22
 
9707 s14 ms_23
9707 s14 ms_239707 s14 ms_23
9707 s14 ms_23
 
TARGET COSTING
TARGET COSTINGTARGET COSTING
TARGET COSTING
 
INDIVIDUAL ASSIGNMENT STRATEGY AND CHANGE PROCESS AMINA PATEL
INDIVIDUAL ASSIGNMENT STRATEGY AND CHANGE PROCESS AMINA PATELINDIVIDUAL ASSIGNMENT STRATEGY AND CHANGE PROCESS AMINA PATEL
INDIVIDUAL ASSIGNMENT STRATEGY AND CHANGE PROCESS AMINA PATEL
 
9707 w14 ms_21
9707 w14 ms_219707 w14 ms_21
9707 w14 ms_21
 
Complimentary Access! SiriusDecisions Channel Sales Strategies Research Brief...
Complimentary Access! SiriusDecisions Channel Sales Strategies Research Brief...Complimentary Access! SiriusDecisions Channel Sales Strategies Research Brief...
Complimentary Access! SiriusDecisions Channel Sales Strategies Research Brief...
 
Rayhaan Kader Assignment RMDP 2014
Rayhaan Kader Assignment RMDP 2014Rayhaan Kader Assignment RMDP 2014
Rayhaan Kader Assignment RMDP 2014
 
Decision Making Int 2
Decision Making Int 2Decision Making Int 2
Decision Making Int 2
 
Corporate Cost Reduction
Corporate Cost ReductionCorporate Cost Reduction
Corporate Cost Reduction
 
9707 s14 ms_31
9707 s14 ms_319707 s14 ms_31
9707 s14 ms_31
 
Strategic analysis4927
Strategic analysis4927Strategic analysis4927
Strategic analysis4927
 
Ent300 Module10
Ent300 Module10Ent300 Module10
Ent300 Module10
 

Andere mochten auch

Andere mochten auch (17)

Lawadve
LawadveLawadve
Lawadve
 
BUSLAW1: Sales Topic 3
BUSLAW1: Sales Topic 3BUSLAW1: Sales Topic 3
BUSLAW1: Sales Topic 3
 
BUSLAW1: Sales Topic 2
BUSLAW1: Sales Topic 2BUSLAW1: Sales Topic 2
BUSLAW1: Sales Topic 2
 
Acctba.Q1.reviewer
Acctba.Q1.reviewerAcctba.Q1.reviewer
Acctba.Q1.reviewer
 
Sales san beda college of law
Sales san beda college of lawSales san beda college of law
Sales san beda college of law
 
Qualman.quiz.2.reviewer
Qualman.quiz.2.reviewerQualman.quiz.2.reviewer
Qualman.quiz.2.reviewer
 
Mga tala tungkol sa buhay filipino
Mga tala tungkol sa buhay filipinoMga tala tungkol sa buhay filipino
Mga tala tungkol sa buhay filipino
 
BASFIN 2 Finals reviewer [Computations]
BASFIN 2 Finals reviewer [Computations]BASFIN 2 Finals reviewer [Computations]
BASFIN 2 Finals reviewer [Computations]
 
ADMEDIA Quiz#1 Re
ADMEDIA Quiz#1 ReADMEDIA Quiz#1 Re
ADMEDIA Quiz#1 Re
 
FIDLAR
FIDLARFIDLAR
FIDLAR
 
BUSLAW1: Sales Topic 1
BUSLAW1: Sales Topic 1BUSLAW1: Sales Topic 1
BUSLAW1: Sales Topic 1
 
Market1 Notes
Market1 NotesMarket1 Notes
Market1 Notes
 
BUSLAW1: Sales Topic 4
BUSLAW1: Sales Topic 4BUSLAW1: Sales Topic 4
BUSLAW1: Sales Topic 4
 
BUSLAW1: Sales Topic 5
BUSLAW1: Sales Topic 5BUSLAW1: Sales Topic 5
BUSLAW1: Sales Topic 5
 
Pagsasalin sa Sikolohiya
Pagsasalin sa SikolohiyaPagsasalin sa Sikolohiya
Pagsasalin sa Sikolohiya
 
BUSLAW1: Sales Topic 6
BUSLAW1: Sales Topic 6BUSLAW1: Sales Topic 6
BUSLAW1: Sales Topic 6
 
Sales finals reviewer
Sales finals reviewerSales finals reviewer
Sales finals reviewer
 

Ähnlich wie Qualman quiz # 3 reviewer

Game Changing Quality Strategies that Drive Organizational Excellence
Game Changing Quality Strategies that Drive Organizational ExcellenceGame Changing Quality Strategies that Drive Organizational Excellence
Game Changing Quality Strategies that Drive Organizational Excellencekushshah
 
How to implement a strategic IT vendor management program
How to implement a strategic IT vendor management programHow to implement a strategic IT vendor management program
How to implement a strategic IT vendor management programJeff Kubacki
 
Service quality management
Service quality managementService quality management
Service quality managementJayakrishnan V
 
ISO 9001:2015 - Greendot Management Solutions
ISO 9001:2015 - Greendot Management Solutions ISO 9001:2015 - Greendot Management Solutions
ISO 9001:2015 - Greendot Management Solutions Nirav Trivedi
 
2nd exl Quality Oversight Conf Szpindor In Process Vendor Audit
2nd exl Quality Oversight Conf   Szpindor In Process Vendor Audit2nd exl Quality Oversight Conf   Szpindor In Process Vendor Audit
2nd exl Quality Oversight Conf Szpindor In Process Vendor AuditStan Szpindor
 
What ISO Management Systems can learn from Balanced Scorecard?
What ISO Management Systems can learn from Balanced Scorecard?What ISO Management Systems can learn from Balanced Scorecard?
What ISO Management Systems can learn from Balanced Scorecard?PECB
 
Ops management lecture 5 quality management
Ops management lecture 5 quality managementOps management lecture 5 quality management
Ops management lecture 5 quality managementjillmitchell8778
 
Improving Service Quality and Productivity - Service Marketing
Improving Service Quality and Productivity - Service MarketingImproving Service Quality and Productivity - Service Marketing
Improving Service Quality and Productivity - Service MarketingNuwan Ireshinie
 
Service Marketing: Service expectations, evaluation, Design and Standard
Service Marketing: Service expectations, evaluation, Design and StandardService Marketing: Service expectations, evaluation, Design and Standard
Service Marketing: Service expectations, evaluation, Design and StandardAshish Awasthi
 

Ähnlich wie Qualman quiz # 3 reviewer (20)

Game Changing Quality Strategies that Drive Organizational Excellence
Game Changing Quality Strategies that Drive Organizational ExcellenceGame Changing Quality Strategies that Drive Organizational Excellence
Game Changing Quality Strategies that Drive Organizational Excellence
 
How to implement a strategic IT vendor management program
How to implement a strategic IT vendor management programHow to implement a strategic IT vendor management program
How to implement a strategic IT vendor management program
 
Service delivery
Service deliveryService delivery
Service delivery
 
Service quality management
Service quality managementService quality management
Service quality management
 
Service quality
Service qualityService quality
Service quality
 
ISO 9001:2015 - Greendot Management Solutions
ISO 9001:2015 - Greendot Management Solutions ISO 9001:2015 - Greendot Management Solutions
ISO 9001:2015 - Greendot Management Solutions
 
Lean_Sigma_Awareness
Lean_Sigma_AwarenessLean_Sigma_Awareness
Lean_Sigma_Awareness
 
2nd exl Quality Oversight Conf Szpindor In Process Vendor Audit
2nd exl Quality Oversight Conf   Szpindor In Process Vendor Audit2nd exl Quality Oversight Conf   Szpindor In Process Vendor Audit
2nd exl Quality Oversight Conf Szpindor In Process Vendor Audit
 
Tqm
TqmTqm
Tqm
 
What ISO Management Systems can learn from Balanced Scorecard?
What ISO Management Systems can learn from Balanced Scorecard?What ISO Management Systems can learn from Balanced Scorecard?
What ISO Management Systems can learn from Balanced Scorecard?
 
Ops management lecture 5 quality management
Ops management lecture 5 quality managementOps management lecture 5 quality management
Ops management lecture 5 quality management
 
Improving Service Quality and Productivity - Service Marketing
Improving Service Quality and Productivity - Service MarketingImproving Service Quality and Productivity - Service Marketing
Improving Service Quality and Productivity - Service Marketing
 
GE8077 UNIT-2.ppt
GE8077   UNIT-2.pptGE8077   UNIT-2.ppt
GE8077 UNIT-2.ppt
 
GE8077 UNIT-2.ppt
GE8077   UNIT-2.pptGE8077   UNIT-2.ppt
GE8077 UNIT-2.ppt
 
OVERALL UNIT2.ppt
OVERALL UNIT2.pptOVERALL UNIT2.ppt
OVERALL UNIT2.ppt
 
Unit 1.pptx
Unit 1.pptxUnit 1.pptx
Unit 1.pptx
 
Service Marketing: Service expectations, evaluation, Design and Standard
Service Marketing: Service expectations, evaluation, Design and StandardService Marketing: Service expectations, evaluation, Design and Standard
Service Marketing: Service expectations, evaluation, Design and Standard
 
Unit 1.pptx
Unit 1.pptxUnit 1.pptx
Unit 1.pptx
 
Ptqm ppt
Ptqm pptPtqm ppt
Ptqm ppt
 
Concepts of tqm
Concepts of tqmConcepts of tqm
Concepts of tqm
 

Mehr von Samantha Abalos

SA BATANGAS: ANG LOKALAYS NA WIKA SA SALITA
SA BATANGAS: ANG LOKALAYS NA WIKA SA SALITASA BATANGAS: ANG LOKALAYS NA WIKA SA SALITA
SA BATANGAS: ANG LOKALAYS NA WIKA SA SALITASamantha Abalos
 
BASFIN2: Midterm Reviewer.docx
BASFIN2: Midterm Reviewer.docxBASFIN2: Midterm Reviewer.docx
BASFIN2: Midterm Reviewer.docxSamantha Abalos
 
Basfin2 midterm reviewer
Basfin2 midterm reviewerBasfin2 midterm reviewer
Basfin2 midterm reviewerSamantha Abalos
 
MARKMAG Notes for Midterms
MARKMAG Notes for MidtermsMARKMAG Notes for Midterms
MARKMAG Notes for MidtermsSamantha Abalos
 
BASFIN2: Quiz 2 Reviewer
BASFIN2: Quiz 2 ReviewerBASFIN2: Quiz 2 Reviewer
BASFIN2: Quiz 2 ReviewerSamantha Abalos
 
BASFIN1 REVIEWER FOR FINALS
BASFIN1 REVIEWER FOR FINALSBASFIN1 REVIEWER FOR FINALS
BASFIN1 REVIEWER FOR FINALSSamantha Abalos
 
MANSCIE NOTES FOR QUIZ 2
MANSCIE NOTES FOR QUIZ 2MANSCIE NOTES FOR QUIZ 2
MANSCIE NOTES FOR QUIZ 2Samantha Abalos
 
MANSCIE NOTES FOR QUIZ 1
MANSCIE NOTES FOR QUIZ 1MANSCIE NOTES FOR QUIZ 1
MANSCIE NOTES FOR QUIZ 1Samantha Abalos
 
MANSCIE: Simplex Solution
MANSCIE: Simplex SolutionMANSCIE: Simplex Solution
MANSCIE: Simplex SolutionSamantha Abalos
 
MANCIE NOTES FOR QUIZ 3:
MANCIE NOTES FOR QUIZ 3:MANCIE NOTES FOR QUIZ 3:
MANCIE NOTES FOR QUIZ 3:Samantha Abalos
 
ADSERCH: research design and survey [NOTES]
ADSERCH: research design and survey [NOTES]ADSERCH: research design and survey [NOTES]
ADSERCH: research design and survey [NOTES]Samantha Abalos
 

Mehr von Samantha Abalos (14)

SA BATANGAS: ANG LOKALAYS NA WIKA SA SALITA
SA BATANGAS: ANG LOKALAYS NA WIKA SA SALITASA BATANGAS: ANG LOKALAYS NA WIKA SA SALITA
SA BATANGAS: ANG LOKALAYS NA WIKA SA SALITA
 
BASFIN 2: Quiz 3
BASFIN 2: Quiz 3BASFIN 2: Quiz 3
BASFIN 2: Quiz 3
 
BASFIN2: Midterm Reviewer.docx
BASFIN2: Midterm Reviewer.docxBASFIN2: Midterm Reviewer.docx
BASFIN2: Midterm Reviewer.docx
 
Basfin2 midterm reviewer
Basfin2 midterm reviewerBasfin2 midterm reviewer
Basfin2 midterm reviewer
 
MARKMAG Notes for Midterms
MARKMAG Notes for MidtermsMARKMAG Notes for Midterms
MARKMAG Notes for Midterms
 
BASFIN2: Quiz 2 Reviewer
BASFIN2: Quiz 2 ReviewerBASFIN2: Quiz 2 Reviewer
BASFIN2: Quiz 2 Reviewer
 
BASFIN1 REVIEWER FOR FINALS
BASFIN1 REVIEWER FOR FINALSBASFIN1 REVIEWER FOR FINALS
BASFIN1 REVIEWER FOR FINALS
 
MANSCIE NOTES FOR QUIZ 2
MANSCIE NOTES FOR QUIZ 2MANSCIE NOTES FOR QUIZ 2
MANSCIE NOTES FOR QUIZ 2
 
MANSCIE NOTES FOR QUIZ 1
MANSCIE NOTES FOR QUIZ 1MANSCIE NOTES FOR QUIZ 1
MANSCIE NOTES FOR QUIZ 1
 
MANSCIE: Quiz 3
MANSCIE: Quiz 3 MANSCIE: Quiz 3
MANSCIE: Quiz 3
 
Adserch final paper
Adserch final paperAdserch final paper
Adserch final paper
 
MANSCIE: Simplex Solution
MANSCIE: Simplex SolutionMANSCIE: Simplex Solution
MANSCIE: Simplex Solution
 
MANCIE NOTES FOR QUIZ 3:
MANCIE NOTES FOR QUIZ 3:MANCIE NOTES FOR QUIZ 3:
MANCIE NOTES FOR QUIZ 3:
 
ADSERCH: research design and survey [NOTES]
ADSERCH: research design and survey [NOTES]ADSERCH: research design and survey [NOTES]
ADSERCH: research design and survey [NOTES]
 

Kürzlich hochgeladen

Call Girls in Dwarka Mor Delhi Contact Us 9654467111
Call Girls in Dwarka Mor Delhi Contact Us 9654467111Call Girls in Dwarka Mor Delhi Contact Us 9654467111
Call Girls in Dwarka Mor Delhi Contact Us 9654467111Sapana Sha
 
Q4-W6-Restating Informational Text Grade 3
Q4-W6-Restating Informational Text Grade 3Q4-W6-Restating Informational Text Grade 3
Q4-W6-Restating Informational Text Grade 3JemimahLaneBuaron
 
SOCIAL AND HISTORICAL CONTEXT - LFTVD.pptx
SOCIAL AND HISTORICAL CONTEXT - LFTVD.pptxSOCIAL AND HISTORICAL CONTEXT - LFTVD.pptx
SOCIAL AND HISTORICAL CONTEXT - LFTVD.pptxiammrhaywood
 
Sanyam Choudhary Chemistry practical.pdf
Sanyam Choudhary Chemistry practical.pdfSanyam Choudhary Chemistry practical.pdf
Sanyam Choudhary Chemistry practical.pdfsanyamsingh5019
 
Paris 2024 Olympic Geographies - an activity
Paris 2024 Olympic Geographies - an activityParis 2024 Olympic Geographies - an activity
Paris 2024 Olympic Geographies - an activityGeoBlogs
 
Measures of Dispersion and Variability: Range, QD, AD and SD
Measures of Dispersion and Variability: Range, QD, AD and SDMeasures of Dispersion and Variability: Range, QD, AD and SD
Measures of Dispersion and Variability: Range, QD, AD and SDThiyagu K
 
microwave assisted reaction. General introduction
microwave assisted reaction. General introductionmicrowave assisted reaction. General introduction
microwave assisted reaction. General introductionMaksud Ahmed
 
Nutritional Needs Presentation - HLTH 104
Nutritional Needs Presentation - HLTH 104Nutritional Needs Presentation - HLTH 104
Nutritional Needs Presentation - HLTH 104misteraugie
 
Accessible design: Minimum effort, maximum impact
Accessible design: Minimum effort, maximum impactAccessible design: Minimum effort, maximum impact
Accessible design: Minimum effort, maximum impactdawncurless
 
BAG TECHNIQUE Bag technique-a tool making use of public health bag through wh...
BAG TECHNIQUE Bag technique-a tool making use of public health bag through wh...BAG TECHNIQUE Bag technique-a tool making use of public health bag through wh...
BAG TECHNIQUE Bag technique-a tool making use of public health bag through wh...Sapna Thakur
 
Introduction to Nonprofit Accounting: The Basics
Introduction to Nonprofit Accounting: The BasicsIntroduction to Nonprofit Accounting: The Basics
Introduction to Nonprofit Accounting: The BasicsTechSoup
 
Z Score,T Score, Percential Rank and Box Plot Graph
Z Score,T Score, Percential Rank and Box Plot GraphZ Score,T Score, Percential Rank and Box Plot Graph
Z Score,T Score, Percential Rank and Box Plot GraphThiyagu K
 
BASLIQ CURRENT LOOKBOOK LOOKBOOK(1) (1).pdf
BASLIQ CURRENT LOOKBOOK  LOOKBOOK(1) (1).pdfBASLIQ CURRENT LOOKBOOK  LOOKBOOK(1) (1).pdf
BASLIQ CURRENT LOOKBOOK LOOKBOOK(1) (1).pdfSoniaTolstoy
 
A Critique of the Proposed National Education Policy Reform
A Critique of the Proposed National Education Policy ReformA Critique of the Proposed National Education Policy Reform
A Critique of the Proposed National Education Policy ReformChameera Dedduwage
 
Class 11th Physics NEET formula sheet pdf
Class 11th Physics NEET formula sheet pdfClass 11th Physics NEET formula sheet pdf
Class 11th Physics NEET formula sheet pdfAyushMahapatra5
 
Sports & Fitness Value Added Course FY..
Sports & Fitness Value Added Course FY..Sports & Fitness Value Added Course FY..
Sports & Fitness Value Added Course FY..Disha Kariya
 
1029-Danh muc Sach Giao Khoa khoi 6.pdf
1029-Danh muc Sach Giao Khoa khoi  6.pdf1029-Danh muc Sach Giao Khoa khoi  6.pdf
1029-Danh muc Sach Giao Khoa khoi 6.pdfQucHHunhnh
 
IGNOU MSCCFT and PGDCFT Exam Question Pattern: MCFT003 Counselling and Family...
IGNOU MSCCFT and PGDCFT Exam Question Pattern: MCFT003 Counselling and Family...IGNOU MSCCFT and PGDCFT Exam Question Pattern: MCFT003 Counselling and Family...
IGNOU MSCCFT and PGDCFT Exam Question Pattern: MCFT003 Counselling and Family...PsychoTech Services
 

Kürzlich hochgeladen (20)

Call Girls in Dwarka Mor Delhi Contact Us 9654467111
Call Girls in Dwarka Mor Delhi Contact Us 9654467111Call Girls in Dwarka Mor Delhi Contact Us 9654467111
Call Girls in Dwarka Mor Delhi Contact Us 9654467111
 
Q4-W6-Restating Informational Text Grade 3
Q4-W6-Restating Informational Text Grade 3Q4-W6-Restating Informational Text Grade 3
Q4-W6-Restating Informational Text Grade 3
 
SOCIAL AND HISTORICAL CONTEXT - LFTVD.pptx
SOCIAL AND HISTORICAL CONTEXT - LFTVD.pptxSOCIAL AND HISTORICAL CONTEXT - LFTVD.pptx
SOCIAL AND HISTORICAL CONTEXT - LFTVD.pptx
 
Mattingly "AI & Prompt Design: The Basics of Prompt Design"
Mattingly "AI & Prompt Design: The Basics of Prompt Design"Mattingly "AI & Prompt Design: The Basics of Prompt Design"
Mattingly "AI & Prompt Design: The Basics of Prompt Design"
 
Sanyam Choudhary Chemistry practical.pdf
Sanyam Choudhary Chemistry practical.pdfSanyam Choudhary Chemistry practical.pdf
Sanyam Choudhary Chemistry practical.pdf
 
Paris 2024 Olympic Geographies - an activity
Paris 2024 Olympic Geographies - an activityParis 2024 Olympic Geographies - an activity
Paris 2024 Olympic Geographies - an activity
 
Measures of Dispersion and Variability: Range, QD, AD and SD
Measures of Dispersion and Variability: Range, QD, AD and SDMeasures of Dispersion and Variability: Range, QD, AD and SD
Measures of Dispersion and Variability: Range, QD, AD and SD
 
microwave assisted reaction. General introduction
microwave assisted reaction. General introductionmicrowave assisted reaction. General introduction
microwave assisted reaction. General introduction
 
Mattingly "AI & Prompt Design: Structured Data, Assistants, & RAG"
Mattingly "AI & Prompt Design: Structured Data, Assistants, & RAG"Mattingly "AI & Prompt Design: Structured Data, Assistants, & RAG"
Mattingly "AI & Prompt Design: Structured Data, Assistants, & RAG"
 
Nutritional Needs Presentation - HLTH 104
Nutritional Needs Presentation - HLTH 104Nutritional Needs Presentation - HLTH 104
Nutritional Needs Presentation - HLTH 104
 
Accessible design: Minimum effort, maximum impact
Accessible design: Minimum effort, maximum impactAccessible design: Minimum effort, maximum impact
Accessible design: Minimum effort, maximum impact
 
BAG TECHNIQUE Bag technique-a tool making use of public health bag through wh...
BAG TECHNIQUE Bag technique-a tool making use of public health bag through wh...BAG TECHNIQUE Bag technique-a tool making use of public health bag through wh...
BAG TECHNIQUE Bag technique-a tool making use of public health bag through wh...
 
Introduction to Nonprofit Accounting: The Basics
Introduction to Nonprofit Accounting: The BasicsIntroduction to Nonprofit Accounting: The Basics
Introduction to Nonprofit Accounting: The Basics
 
Z Score,T Score, Percential Rank and Box Plot Graph
Z Score,T Score, Percential Rank and Box Plot GraphZ Score,T Score, Percential Rank and Box Plot Graph
Z Score,T Score, Percential Rank and Box Plot Graph
 
BASLIQ CURRENT LOOKBOOK LOOKBOOK(1) (1).pdf
BASLIQ CURRENT LOOKBOOK  LOOKBOOK(1) (1).pdfBASLIQ CURRENT LOOKBOOK  LOOKBOOK(1) (1).pdf
BASLIQ CURRENT LOOKBOOK LOOKBOOK(1) (1).pdf
 
A Critique of the Proposed National Education Policy Reform
A Critique of the Proposed National Education Policy ReformA Critique of the Proposed National Education Policy Reform
A Critique of the Proposed National Education Policy Reform
 
Class 11th Physics NEET formula sheet pdf
Class 11th Physics NEET formula sheet pdfClass 11th Physics NEET formula sheet pdf
Class 11th Physics NEET formula sheet pdf
 
Sports & Fitness Value Added Course FY..
Sports & Fitness Value Added Course FY..Sports & Fitness Value Added Course FY..
Sports & Fitness Value Added Course FY..
 
1029-Danh muc Sach Giao Khoa khoi 6.pdf
1029-Danh muc Sach Giao Khoa khoi  6.pdf1029-Danh muc Sach Giao Khoa khoi  6.pdf
1029-Danh muc Sach Giao Khoa khoi 6.pdf
 
IGNOU MSCCFT and PGDCFT Exam Question Pattern: MCFT003 Counselling and Family...
IGNOU MSCCFT and PGDCFT Exam Question Pattern: MCFT003 Counselling and Family...IGNOU MSCCFT and PGDCFT Exam Question Pattern: MCFT003 Counselling and Family...
IGNOU MSCCFT and PGDCFT Exam Question Pattern: MCFT003 Counselling and Family...
 

Qualman quiz # 3 reviewer

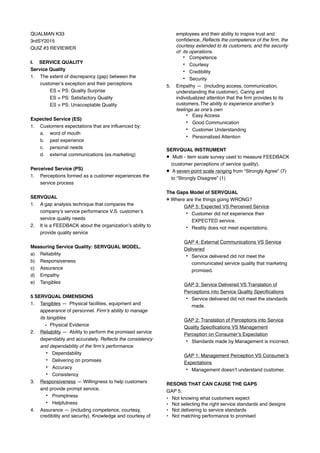
  • 1. QUALMAN K33 3rdSY2015
 QUIZ #3 REVIEWER I. SERVICE QUALITY Service Quality 1. The extent of discrepancy (gap) between the customer’s exception and their perceptions ES < PS: Quality Surprise ES = PS: Satisfactory Quality ES > PS: Unacceptable Quality Expected Service (ES) 1. Customers expectations that are influenced by: a. word of mouth b. past experience c. personal needs d. external communications (ex.marketing) Perceived Service (PS) 1. Perceptions formed as a customer experiences the service process SERVQUAL 1. A gap analysis technique that compares the company’s service performance V.S. customer’s service quality needs 2. It is a FEEDBACK about the organization’s ability to provide quality service Measuring Service Quality: SERVQUAL MODEL. a) Reliability b) Responsiveness c) Assurance d) Empathy e) Tangibles 5 SERVQUAL DIMENSIONS 1. Tangibles — Physical facilities, equipment and appearance of personnel. Firm’s ability to manage its tangibles • Physical Evidence 2. Reliability — Ability to perform the promised service dependably and accurately. Reflects the consistency and dependability of the firm’s performance. • Dependability • Delivering on promises • Accuracy • Consistency 3. Responsiveness — Willingness to help customers and provide prompt service. • Promptness • Helpfulness 4. Assurance — (including competence, courtesy, credibility and security). Knowledge and courtesy of employees and their ability to inspire trust and confidence. Reflects the competence of the firm, the courtesy extended to its customers, and the security of its operations. • Competence • Courtesy • Credibility • Security 5. Empathy — (including access, communication, understanding the customer). Caring and individualized attention that the firm provides to its customers.The ability to experience another’s feelings as one’s own • Easy Access • Good Communication • Customer Understanding • Personalized Attention SERVQUAL INSTRUMENT Multi - item scale survey used to measure FEEDBACK (customer perceptions of service quality). A seven-point scale ranging from “Strongly Agree” (7) to “Strongly Disagree” (1) The Gaps Model of SERVQUAL Where are the things going WRONG? GAP 5: Expected VS Perceived Service • Customer did not experience their EXPECTED service. • Reality does not meet expectations. GAP 4: External Communications VS Service Delivered • Service delivered did not meet the communicated service quality that marketing promised. GAP 3: Service Delivered VS Translation of Perceptions into Service Quality Specifications • Service delivered did not meet the standards made. GAP 2: Translation of Perceptions into Service Quality Specifications VS Management Perception on Consumer’s Expectation • Standards made by Management is incorrect. GAP 1: Management Perception VS Consumer’s Expectations • Management doesn’t understand customer. RESONS THAT CAN CAUSE THE GAPS GAP 5: • Not knowing what customers expect • Not selecting the right service standards and designs • Not delivering to service standards • Not matching performance to promised
  • 2. GAP 4: ■ Lack of integration of marketing communications ■ Inadequate management of customer expectations ■ Over promising GAP 3: ■ Poor human resource policies ■ Failure to match supply and demand ■ Customer not fulfilling their roles ■ Problems with service intermediaries GAP 2: ■ Poor service design ■ Absence of customer-defined service standards ■ Inappropriate physical evidence and service scape GAP 1: • Inadequate marketing research orientation • Lack of upward communication • Insufficient relationship focus • Inadequate service recovery CLOSING GAPS Gap 1: Learn what customers expect • Use research, complaint analysis, customer panels • Increase direct interactions between managers and customers • Improve upward communications • Act on information and insights Gap 2: Establish the right service quality standards • Top management commitment to providing service quality • Set, communicate, and reinforce customer-oriented service standards • Establish challenging and realistic service quality goals • Train managers to be service quality leaders • Be receptive to new ways to deliver service quality • Standardize repetitive tasks • Prioritize tasks • Gain employee acceptance of goals and priorities • Measure performance of service standards and provide regular feedback • Reward managers and employees for achievement of quality goals Gap 3: Ensure that service performance meets standards • Attract the best employees • Select the right employees • Develop and support employees - train employees - provide appropriate technology & equipment - encourage and build teamwork - empower employees - internal marketing • Retain good employees - measure and reward service quality achievements - develop equitable and simple reward systems Gap 4: Ensure that delivery matches promises • Retain good employees - measure and reward service quality achievements - develop equitable and simple reward systems • In advertising, focus on service characteristics that are important to customers • Manage customer’s expectations - What are realistic expectations? - Explain industry realities • Tiered service options - Offer different levels of service - user pays Service Satisfaction Information System • Customer Complaints • Surveys • Employee Surveys • Focus Groups • ‘Mystery shopping’ research • Competitive market surveys - benchmark Measuring Satisfaction • Qualitative Research • Understand key drivers / determinants • Questionnaire design • Data analysis • Service performance index (SPI) • Importance - performance analysis SERVQUAL QUASTIONAIRE • Expectations Section Contains 22 statements to ascertain the general expectations of customers concerning a service that would relate to an "excellent" company • Perceptions Section Contains a matching set of 22 statements to measure customers’ assessment of a specific firm within the service category • Five Feature Ranking Assessment of the relative importance of the five dimensions II. PROJECT MANAGEMENT What is Project? • A unique venture with a beginning and end, conducted by people to meet established goals within parameters of cost, schedule and quality. • Goal-oriented • Temporary endeavor Project Management 1. overseeing all its processes 2. ensure goals are accomplished on time 3. within the limits of a budget 4. using assigned resources 5. while addressing risks, managing changes and satisfying stakeholders ScorenExpectatio-ScorePerceptionScoreSERVQUAL =
  • 3. Project Life Cycle 1. Initiating Process 2. Planning Process 3. Monitoring and Controlling Process 4. Executing Process 5. Closing Process Develop Project Charter • a document that formally recognizes the existence of a project • provides direction on the project’s objectives and management The Project Charter • A charter is an agreement between management and the team about what is expected. • The charter: - Clarifies what is expected of the team. - Keeps the team focused. - Keeps the team aligned with organizational priorities. - Transfers the project from the champion(s) to the project team. The Business Case • Why is this project important? • Has anyone else (internal or external to the organization) attempted to solve this problem or a similar one before? • If so, what findings are useful for the success of the project? • Make sure that the project is linked to key business goals and objectives. • What business indices will be improved by the project? • What are the projected cost savings/opportunities on this project? Deliverables (Project Benefits) • Business Results • Customer Benefits • Safety, Environmental and Other Impacts Project Metrics • What will be the primary measure of success? • How will these be measured and tracked? • What is the target (specifications) for the measures? • What defects will you be tracking? Elements of a Team Charter • Team Demographics • Business Case • Project Scope (focus and direction) • Project Measures (indicators) • Deliverables (Customer Benefits and Business Results) • Resources accessible to the team • Project Plan Team Size Consideration • Ideal team size: 5- 8 • Smaller Team Size: 3 to 4 ->work faster • Teams greater than 8 require additional facilitation and often require sub-teams. - Unavoidable when greater functional representation is needed. - Given resource constraints, members are often part-time. Types of Cost Savings a. Cost Reduction (Savings) b. Cost Avoidance (Threats) Types of Business Impact a. Potential Improvement - Reduce inventory levels - reduce time to market - reduce equipment downtime - reduce rejects/rework - speed up delivery time b. Potential Impact - Reduce capital investment in inventory - increase revenues through increased sales - increase capacity - decrease material cost; greater ROI - increase revenues Project Scope • What process is involved? • What is the start and end (boundaries) of the process? • What is the period of the study? • What is not within scope? • Is the project scope manageable? • What are the existing constraints that might affect the execution of the project? • Is the problem refined enough? - Avoid “boiling the ocean” - Make sure scope is appropriate and manageable • Use Pareto Analysis to refine the scope Developing Milestones • Project plans often start with identifying key milestones. • Milestones represent important decision points. The completion of each step in the PPDM process is usually a milestone. • The whole team should participate in defining and establishing dates for milestones. There should be about 10-15 milestones. • Once milestones are defined, group them into logical sequences. a) DEFINE MILESTONES b) GROUP THEM INTO LOGICAL SEQUENCE • Use tools such as GANTT Charts, PERT Charts, or Network Diagrams to show the relationship between milestones. Roadmap/Milestones • Start date? Target completion date? • What are the highlights for the completion of the project and its respective estimated dates of completion? • When will each phase (D, M, A, I, and C) be completed?
  • 4. Resources and Schedules ■ What are the critical resources needed to pursue this project? - Support Functions, - People and Talent, - Time, - SMEs, - Budget, - etc? Project Approval ■ Completion of the project would be finalized when approval signatures have been secured from the sponsor, finance, quality, and technical. ■ This ensures that project has delivered the benefits. III. PROJECT MANAGEMENT PLAN Work Breakdown Structure (WBS) The tool for breaking down a project into its components parts. A foundation document that provides the basis for: a. planning b. managing project schedules c. costs d. resources e. changes Guide Questions for WBS: 1. Do you require two or more intermediate activities to produce this deliverable? 2. Can you accurately estimate the resources you will need to perform the work to produce this deliverable? 3. Can you accurately estimate how long it will take to produce this deliverable? 4. If you have to assign the work to produce this deliverable to someone else, are you confident that person will understand exactly what to do? Work Breakdown Structure ■ There are two (2) kinds of tasks on a WBS: 1. SUMMARY TASKS — is not actually executed, it is a summarization of the subordinate work package. 2. WORK PACKAGES — are actually executed. • Decomposition is subdividing project deliverables into smaller pieces • A work package is a task at the lowest level of the WBS - Representing a collection of work actions necessary to create a specific result Building a Work Breakdown Structure WBS Step 1: Begin at the Top A WBS breaks down a project into descending levels of details, naming all the tasks required to create the deliverables. Begin the breakdown process by: 1. List the major deliverables/high level tasks from the scope statement 2. Use continuous improvement to assess > analyze > act WBS Step 2: Name All the Tasks Required to Produce Deliverables A task name describes an activity that produces a product. The next step is to break down each task into the lower-level, detailed tasks required to produce the product. WBS Step 3: How to Organize the WBS Place work packages under different summary task headings. The overall project will remain the same even though the work packages are grouped differently. Group the various components of a product or major phases of the product release. Summary Tasks - Open-ended tasks – a task with no hard products being produced, these are activities that could go on indefinitely. - Open-ended activities - a task with no action required. WBS Step 4: Identify Task Relationship 1. Define task relationship only between work packages 2. Task relationships should reflect only sequence constraints between work packages, not resource constraints. Type of Dependancies 1. Finish-to-start: This most common type of dependency link accounts for more than 90 percent of the dependencies you create. In this relationship, the predecessor task must be completed before the successor task can start. When you create a dependency, the default setting is finish-to-start. 2. Start-to-start: The start of one task is dependent on the start of another. In this dependency type, two tasks can start simultaneously, or one task might have to start before another task can start. 3. Finish-to-finish: In a finish-to-finish relationship, one task (you guessed it) must finish before or at the same time as another task. 4. Start-to-finish: In a start-to-finish dependency, the predecessor task can finish only after the successor task has started. If the successor is delayed, the
  • 5. predecessor task cannot finish. Of course, this type of relationship is abbreviated as SF. WBS Step 5: Milestones are Useful Markers Milestones are markings of significant events in the life of a project, with zero duration. Three reasons: 1. Project start and finish milestones are useful anchors for the network. 2. Task relationships should reflect only sequence constraints between work packages, not resource constraints. 3. A milestone can represent significant events that are not already represented by a work passage or summary of task. IV. PROJECT RISK MANAGEMENT What is Risk? - The possibility of loss, injury, disadvantage or destruction - The chance of something happening that will have an impact on objectives Risk Management The art and science of identifying, analyzing, and responding to risk throughout the life of a project and in the best interests of meeting project objectives Strategies for Negative Risks or Threats 1. Avoidance 2. Transfer 3. Mitigate 4. Accept Identify Risks Possible sources: ➢Technical — Project or Environment ➢ Business Case ➢Planning ➢Organizational ➢External Technical Risks Project ✓Effect of Product/Service Failure, Safety Impact? ✓Complex Product/Process Functions? ✓Complex or Hazardous Design Elements (Materials, Fit, Sequence, IT, Human, etc.)? ✓Complex Interaction with Existing Processes? ✓Unclear Requirements, Specifications ✓Package Solutions (IT): ▪ Available Packages Not or Poorly Evaluated? ▪ Functional Capability Requirements Mismatch? Environmental ✓Inappropriate Development Tools/ Methods? ✓New/Unfamiliar Technology? ✓Unstable Development Team? ✓Low Project Team Knowledge of Business Area? ✓Low/Inadequate Project Team Skills? ✓Poor Development Method/Project Approach? Business Risks ✓ Major Increase in Costs Possible? ✓ Evolving Business/Customer Requirements? ✓ Incomplete Definition of Scope/Requirements? ✓ Poorly Defined Benefits? ✓ Excessive Lead Time for Return on Investment? ✓ Mission Critical System? ✓ Fundamental to Business Strategy? ✓ Business Commitment to Development? Planning Risks ✓ Complex Project Task Dependencies? ✓ Critical Implementation Date? ✓ Informal Project Control Procedures? ✓ High Ratio: Development Person/ Years to Development Calendar Years? ✓ High Number of Major New Functions to Design? ✓ Unrealistic Target Dates? ✓ Low Commitment to Targets by Team? ✓ Low Experience of Project Manager? ✓ Resources Available to Resources Required Mismatch? Organizational Risks ✓ Large Number of Decision Makers? ✓ Multiple Geographic Locations (Design, Production)? ✓ Unrealistic Expectations by Customers, Users, Stakeholders? ✓ Impacted Departments/Company of Large Size? ✓ Inappropriate Level of Sponsorship? ✓ Unavailability of Key Users, Internal Customers? ✓ Significant Changes Required by Organization? ✓ Resistance to Change by Current Organization? ✓ Extensive Education of Users/Internal Customers Required? External Risks ✓ Multiple Vendors, Contractors, Consultants? ✓ Poor Vendor Support? ✓ Project Critically Dependent on External Suppliers? ✓ Large Number of Inter-Project Dependencies? ✓ Overlapping Scope with Other Projects? ✓ Extensive Recruitment of External Resources to Staff New Processes? STEPS TO RISK MANAGEMENT STEP 1: RISK IDENTIFICATION — Identify potential problems of your solutions STEP 2: RISK ASSESSMENT — Determine the likelihood of their occurrence STEP 3: RESPONSE STRATEGY — Take steps to avoid or deal with the likely problems in order to have higher chance of success