SlideShare ist ein Scribd-Unternehmen logo
1 von 16
Downloaden Sie, um offline zu lesen
ApJ
Preprint typeset using LATEX style emulateapj v. 03/07/07
RADIO LOUD AGN ARE MERGERS
Marco Chiaberge1,2,3
, Roberto Gilli4
, Jennifer Lotz1
, and Colin Norman1,5
ApJ
ABSTRACT
We measure the merger fraction of Type 2 radio-loud and radio–quiet active galactic nuclei at z > 1
using new samples. The objects have HST images taken with WFC3 in the IR channel. These samples
are compared to the 3CR sample of radio galaxies at z > 1 and to a sample of non-active galaxies. We
also consider lower redshift radio galaxies with HST observations and previous generation instruments
(NICMOS and WFPC2). The full sample spans an unprecedented range in both redshift and AGN
luminosity. We perform statistical tests to determine whether the different samples are differently
associated with mergers. We find that all (92%+8%
−14%) radio-loud galaxies at z > 1 are associated
with recent or ongoing merger events. Among the radio-loud population there is no evidence for any
dependence of the merger fraction on either redshift or AGN power. For the matched radio-quiet
samples, only 38%+16
−15 are merging systems. The merger fraction for the sample of non-active galaxies
at z > 1 is indistinguishable from radio-quiet objects. This is strong evidence that mergers are the
triggering mechanism for the radio-loud AGN phenomenon and the launching of relativistic jets from
supermassive black holes. We speculate that major BH-BH mergers play a major role in spinning up
the central supermassive black holes in these objects.
Subject headings: galaxies:active — galaxies:interactions — galaxies:jets — galaxies:nuclei – X-
rays:galaxies
1. INTRODUCTION
One of the most important issues in modern astro-
physics is understanding the co-evolution of galaxies and
their central supermassive black holes (SMBH) (Heck-
man & Best 2014; Alexander & Hickox 2012, for recent
reviews on the subject). Both numerical simulations and
theoretical arguments show that black hole (BH) growth
occurs during short-lived periods (∼ 107
− 108
yr) of in-
tensive accretion which are also associated with power-
ful quasar activity (Soltan 1982; Rees 1984; Di Matteo
et al. 2005; Hopkins et al. 2008b; Somerville et al. 2008).
These are also expected to correspond to periods in which
galaxies grow hierarchically. Since the matter that ulti-
mately accretes onto the central black hole needs to lose
almost all (∼ 99.9%) of its angular momentum, studies
of mergers, tidal interactions, stellar bars and disk insta-
bilities are central for understanding the details of such
a process. Numerical simulations and analytic calcula-
tions have shown that major (gas-rich) mergers are capa-
ble of efficiently driving gas inflows towards the central
region of the galaxy ( 1kpc) through tidal forces (e.g.
Hernquist 1989; Di Matteo et al. 2005; Li et al. 2007;
Hopkins & Quataert 2011), and ultimately drive the gas
to the central ∼ 1pc, forming an accretion disk around
the central SMBH (Hopkins & Quataert 2010). This is
also thought to be a likely scenario for the formation of
galaxy spheroids (e.g. Hopkins et al. 2008a). However,
disk instabilities and minor mergers may also be able to
1 Space Telescope Science Institute, 3700 San Martin Drive, Bal-
timore, MD 21218
2 INAF - IRA, Via P. Gobetti 101, Bologna, I-40129
4 INAF Osservatorio Astronomico di Bologna, via Ranzani 1,
40127 Bologna, Italy
3 Center for Astrophysical Sciences, Johns Hopkins University,
3400 N. Charles Street, Baltimore, MD 21218, USA
5 Department of Physics and Astronomy, Johns Hopkins Univer-
sity, Baltimore, MD 21218, USA
provide material for black hole accretion (e.g. Hernquist
& Mihos 1995; Menci et al. 2014).
It is extremely important to study the connection be-
tween galaxy and black hole growth from a purely ob-
servational point of view. One of the central questions
is whether mergers or other mechanisms may constitute
the main triggering mechanisms for active galactic nu-
clei (AGN). A number of recent papers investigated this
issue using data from different surveys of galaxies and
AGNs. Results are often contradictory. Although it is
known that not all of them are AGNs, powerful Ultra–
Luminous Infrared Galaxies (ULIRG) are ubiquitously
associated with major mergers (Sanders & Mirabel 1996;
Veilleux et al. 2002). According to some models (e.g Hop-
kins et al. 2008b,a) these objects are believed to represent
a fundamental stage in the process of the formation of
elliptical galaxies. Kartaltepe et al. (2012) showed that
for a sample of z ∼ 2 ULIRGs in the GOODS-South
field (Giavalisco et al. 2004), the fraction of mergers is
up to ∼ 70%. For lower luminosities objects (LIRGs) in
the same redshift range the merger fraction found by the
same authors is significantly smaller (∼ 30%).
While the merger–ULIRG connection seems to be well
established, whether this is a viable scenario for all AGNs
is still an unanswered question. Bahcall et al. (1997) ob-
served a sample of 20 relatively nearby QSOs with the
Hubble Space Telescope (HST) and found that the ma-
jority of them reside in merging galaxies. Grogin et al.
(2003) studied the optical counterparts of the X-ray se-
lected AGNs from the 1Msec Chandra Deep Field South
(Giacconi et al. 2002). Based on both the asymmetry in-
dex and the frequency of close companions, these authors
concluded that mergers and interactions are not good
indicators of AGN activity. Interestingly, using HST
images taken with the Wide Field Camera 3 (WFC3)
Schawinski et al. (2012) showed that only a small fraction
of heavily obscured QSO hosts are associated with merg-
2 Chiaberge et al.
ers. Treister et al. (2012) put together a relatively large
sample of literature data and found clues for a luminosity
dependence of the merger fraction in both ULIRGs and
AGNs. On the other hand, Villforth et al. (2014) showed
that their sample of QSOs observed with HST did not
show any evidence for a dependence of the merger frac-
tion on luminosity. Recently, based on a sample of SDSS
galaxies, Sabater et al. (2015) found that the effect of
interactions is minimal in triggering AGN activity.
A major issue is related to the so-called radio-
loud/radio-quiet dichotomy of active nuclei. It has been
long argued that in order to produce powerful relativis-
tic jets, radio-loud AGNs must possess an extra source
of energy with respect to radio–quiet AGNs. The most
popular scenarios among those proposed so far assume
that the energy may be extracted from the innermost
region of a magnetized accretion disk around a rapidly
spinning black hole Blandford & Znajek (1977). In the
Blandford-Znajek framework, the radio-quiet/radio-loud
dichotomy can be explained in terms of a correspond-
ing low/high black hole spin separation (Blandford et al.
1990). Alternative models predict that jets are directly
powered by the accretion disk (Blandford & Payne 1982;
Pudritz & Norman 1986; Xu et al. 1999). Both the-
oretical arguments and observational evidence support
the Blandford-Znajek scenario (see e.g. Ghisellini et al.
2014). Recent numerical simulations also seem to con-
firm such a mechanism as a viable physical explanation
for efficient jet production (e.g. Hawley & Krolik 2006;
McKinney & Gammie 2004; Tchekhovskoy et al. 2011;
S¸adowski et al. 2015). Wilson & Colbert (1995) origi-
nally proposed that radio–loud AGNs are associated with
rapidly spinning black holes that are ultimately spun-up
by major BH-BH mergers. It is clear that a straightfor-
ward prediction of such a scenario is that radio galaxies
and radio-loud QSOs (RLQSOs) should exhibit signa-
tures of major galaxy mergers.
Radio–loud AGNs are known to be hosted by large el-
liptical galaxies and are associated with SMBH of at least
∼ 108
M (e.g. Laor 2000; Dunlop et al. 2003; Best et al.
2005; Chiaberge & Marconi 2011). Furthermore, these
objects are present in richer environments (clusters and
groups of galaxies) than radio quiet AGNs (Shen et al.
2009; Donoso et al. 2010; Ramos Almeida et al. 2013) and
they are often associated with brightest cluster galaxies
(Best et al. 2007). At least a fraction of them have been
known to be associated with merging system for a long
time (e.g. Heckman et al. 1986; Colina & de Juan 1995).
Recently, Ramos Almeida et al. (2012) studied samples of
relatively low-redshift (z < 0.7) sources with deep ground
based observations. These authors found that the large
majority (∼ 80%) of radio-loud objects show disturbed
morphologies. The same group also studied a small sam-
ple of radio–quiet Type 2 quasars (Bessiere et al. 2012)
and found that the merger fraction sample is as high as
75%.
However, an accurate census of the merger fraction in
carefully selected samples of AGNs over a large range
of redshift, luminosity and radio–loudness is still needed
to provide a final answer to the above questions. This
should also be based on a homogeneous set of deep, high
spatial resolution observations and supported by firm
statistical evidence for any difference in the observed
merger fractions amongst the different samples. The aim
of this paper is to make a significant step towards such
a goal.
With the aim of determining the importance of merg-
ers in triggering different types of AGN activity, we se-
lect samples of both radio–loud and radio–quiet Type 2
AGN. In this paper we focus on Type 2 objects only, be-
cause the bright nuclear component that dominates the
emission on Type 1 AGNs (QSOs) hampers a detailed
morphological study of both the host galaxies and the
close environment of those objects. This constitutes a
serious concern, particularly at moderate to high red-
shifts, even using HST images. In this work we focus on
objects with 1 < z < 2.5. This is a range of redshift
where the peak of the AGN activity is believed to oc-
cur, and where mergers play a dramatic role in the late
evolution of massive galaxies (e.g. Hopkins et al. 2008b).
The availability of HST data for a substantial number of
objects in each sample is key to this work. In particular,
we focus on samples observed with WFC3 and the IR
channel. The extremely high sensitivity, low background
level and the range of wavelengths covered by such an in-
strument is particularly suitable to our goals. In fact, the
rest frame wavelength corresponding to the most widely
used WFC3–IR filters (i.e. F140W and F160W) is still
well within the optical range for objects in the redshift
range of our interest. Even in relatively short exposures
(i.e. a few hundreds seconds, or less than 1 HST orbit)
the effects of merger events on the structure of galaxies
are clearly revealed in WFC3–IR images. This is possible
thanks to the high sensitivity in the near IR coupled with
the large field of view of WFC3, compared to previous
generation instruments such as WFPC2, NICMOS and
ACS.
In Sect. 2 we describe the samples and the observations
analyzed in this work, while in Sect. 3 we discuss our
method to classify mergers based on visual inspection of
the HST images. In Sect. 4 we describe the statistical
analysis of the results. In Sect. 5 we discuss our findings
and we outline our framework for their interpretation in
Sect. 6. Finally, in Sect. 7 we summarize our results and
we draw conclusions.
Throughout the paper we assume ΩM = 0.3, Ωλ = 0.7
and H0 = 70 Km s−1
Mpc−1
. For the magnitude system,
we use AB magnitudes.
2. THE SAMPLE
One fundamental goal of this work is to establish
whether there is a significant difference in the role played
by mergers among different classes of AGNs and for dif-
ferent bins of redshift and bolometric power. To this
aim, we use well defined samples of classical radio galax-
ies spanning 5 dex in radio power. We also select new
samples of both radio quiet and radio loud AGNs, as well
as non-active galaxies at z > 1. In doing so, we use par-
ticular care in separating the radio quiet and radio loud
populations, as explained below.
In the following we describe the properties of each of
the samples used as part of this work, together with the
selection criteria used to derive new samples.
2.1. Radio loud AGNs: z > 1 3CR radio galaxies
The first sample we consider is composed by the radio
galaxies with z > 1 from the 3CR catalog (Spinrad et al.
1985). These are all powerful radio galaxies belonging
RLAGN are mergers 3
to the Fanaroff–Riley class II (FR II Fanaroff & Riley
1974), i.e. those in which the brightest components of
the radio structure lie at the edges of the radio source,
in contrast to the FR Is, in which the peak of the radio
emission is located at the core.
The 3CR is a flux limited sample selected at low ra-
dio frequencies (S178 > 9 Jy at 178MHz). Since the
radio emission at such frequencies is dominated by the
radio lobes, the selection is independent of the AGN
orientation. The original catalog includes both Type 1
(QSOs) and Type 2 objects (radio galaxies) and it is
one of the best studied samples of radio loud AGNs, be-
ing perfectly suitable to test AGN unification scenarios.
The high redshift objects included in the 3CR are all
firmly established radio loud AGNs with powerful rel-
ativistic jets emanating from the central supermassive
black hole. Even at the lowest luminosities, the active
nucleus is strongly radio loud (see e.g. Sikora et al. 2007;
Chiaberge et al. 2005), assuming the canonical threshold
R = F5GHz/FB > 10 (Kellermann et al. 1989), where
F5GHz and FB are the fluxes in the radio band at 5 GHz
and in the optical B band, respectively. The z > 1 sub-
sample of the 3CR catalog includes 58 objects. The high-
est redshift object is the radio galaxy 3C257 at z = 2.47.
The radio power of these AGNs is L151 ∼ 1035
erg
s−1
Hz−1
or slightly higher, which corresponds to a
bolometric luminosity Lbol ∼ 1045−46
erg s−1
assum-
ing standard bolometric corrections. This result is also
supported by the estimates of the X-ray luminosity for
some of these objects, which is typically in the range
L2−10 ∼ 1044−45
erg s−1
. Salvati et al. (2008) observed
a sample of the most luminous and most distant radio
galaxies and QSOs from the 3CR catalog with XMM.
They found that the intrinsic X-ray luminosity is in the
range 6×1044
< L2−10keV < 2×1046
erg s−1
, the Type 1
QSOs being a factor of ∼ 6 or higher brighter than the
(Type 2) radio galaxies. These authors interpreted such
a discrepancy as a result of the presence of a beamed
component in the Type 1 QSOs. Wilkes et al. (2013)
found similar results based on Chandra data. Torresi et
al. (priv. comm.) analyzed both Chandra and XMM
archival data for the 3CR radio galaxies observed with
HST, and found intrinsic X-ray luminosities as low as
L2−10keV ∼ 2 × 1044
erg s−1
. However, the absorbing
column density is poorly constrained, and it is possible
that at least some of the Type 2 radio galaxies are in fact
Compton-thick. In that case, the derived X-ray luminos-
ity sets a lower limit to the intrinsic AGN luminosity in
that band.
Twelve 3CR radio galaxies were observed with WFC3–
IR and the F140W filter (in addition to WFC3-UVIS
and F606W, not used in this work) as part of program
SNAP13023 (PI M. Chiaberge, Hilbert et al., in prepa-
ration). The wide-band filter used for the HST obser-
vations (F140W) includes emission lines at the redshift
considered here (mainly Hα, Hβ and/or [OIII]5007, de-
pending on the redshift of the source). However, the only
object that is significantly contaminated by line emis-
sion is 3C 230 (see Steinbring 2011). The HST image
of this specific object only shows the narrow-line region
and thus we cannot observe the stellar component of the
host. Therefore we exclude this source from our sam-
Fig. 1.— Radio loud samples considered in this paper. The
horizontal line represents the canonical separation between low and
high power radio galaxies (i.e. FR I and FR II, respectively). The
color code identifies the different catalogs, and the shaded area
show the regions of the radio luminosity v redshift plane where HST
observations are suitable for this paper (see text). Here, the z< 0.3
range is covered by the 3CR sources (yellow), and the four groups
that are part of the Willott sample (6C, 7C and TOOT are in red,
blue and green, respectively plus the 3CR with z ∼ 0.5) cover the
range around z=0.5. Both the low-z 3CR and the Willott sample
are described in Sect. 4.1. The z > 1 range is covered again by the
3CR at high luminosity, and by the ECDFS HzLLRGs (purple) at
the lowest luminosities. See Sect. 2 for more details.
ple6
. HST snapshot surveys of complete samples are well
suitable for statistical studies, since the observations are
scheduled by randomly picking objects from the original
target list to fill gaps in the HST schedule. The observed
sample spans the entire range of redshift of the original
list, i.e. from z = 1.0 to 2.47. The comparison samples
described in the following are tailored to match the prop-
erties of these 3CR galaxies, in either bolometric power
or redshift range (or both).
In Tab. 1 we report the data for the 11 sources belong-
ing to this sample. The 24µm luminosities taken from
Podigachoski et al. (2015) are used in the following to
check that the relevant comparison sample is correctly
matched to the Hz3C.
In Fig. 1 we show the location of the 3CR sample in
the radio power vs. redshift plane, with respect to other
samples used throughout the paper. Note that, at any
redshift, 3CR objects are always the most powerful radio
sources.
6 A quick inspection of the images from the HST-SNAP13023
program shows that 3C 230 is the only object that presents an
identical structure in both of the observed bands which is easily
recognizable as due to emission line filaments. All other objects
show, in the filter used in this work, a much smoother morphol-
ogy that is not typical of emission line regions. The bandwidth
of F140W is extremely wide (∼ 0.4µm), therefore the expected
emission line contamination is small. In fact, for all radio galax-
ies except for 3C 230, we estimate that, based on the observed
emission line flux from ground based spectra, the total emission
line contamination does not exceed 20% of the total observed flux
(Hilbert et al., in preparation). Similar considerations hold for the
other samples used in this work.
4 Chiaberge et al.
2.2. Radio loud AGNs: low-luminosity radio galaxies at
1 < z < 2.5
The sample of high redshift low-luminosity radio galax-
ies (HzLLRGs) is derived from the Extended Chandra
Deep Field South (ECDFS Lehmer et al. 2005). We use
the Bonzini et al. (2012) catalog and AGN type classifi-
cation to derive this sample. The criteria are as follows.
i) The spectroscopic, if available, or photometric red-
shift of the source must be in the range 1 < z < 2.5.
The redshift range is chosen to roughly match the range
spanned by the 3CR sample described above.
ii) The total radio power at 1.4 GHz must be greater
than P1.4GHz > 1030
erg s−1
Hz−1
and below the fiducial
FRI/FRII separation P1.4GHz < 4 × 1032
erg s−1
Hz−1
(Fanaroff & Riley 1974).
iii) The source must be classified as a radio loud AGN
by Bonzini et al. (2013), i.e. it must show radio emis-
sion in excess of that produced by starbursts. This
is measured by using the q24obs parameter, defined as
q24obs = log(S24obs/Sr), where S24obs is the observed flux
density at 24µm and Sr is the observed flux density at
1.4GHz. Bonzini et al. (2013) define an object as radio
loud if q24obs is 2σ off of the starburst locus, defined using
the M82 template (see their Fig. 2).
iv) We also impose the additional constraint that its
X–ray luminosity must not exceed L2−10keV = 1044
erg
s−1
. This is to ensure that the objects are consistent
with typical low power radio galaxies at both low and
high redshifts (e.g. Balmaverde et al. 2006; Tundo et al.
2012). The upper limit to the X–ray luminosity is also
consistent with the results of Terashima & Wilson (2003).
These authors showed that the radio loud – radio quiet
dichotomy can be redefined using the X–ray emission in-
stead of the flux in the optical band. This is particularly
useful for Type 2 AGNs such as the ones considered in
this work, since the optical emission form the accretion
disk is heavily obscured in these object. According to
such a scheme, powerful radio loud AGNs are present
for RX −3.5, where RX is defined as the logarithm of
the ratio between the radio luminosity (νLν) at 1.4GHz
and the X-ray luminosity L2−10. At low radio powers,
it is easy to confuse a powerful radio quiet AGN that
shows some radio emission with a radio loud object that
is intrinsically weak at all wavelengths. Note that our se-
lection criteria for the radio and X-ray luminosities cor-
respond to RX > −2.3, which is a rather conservative
value. We prefer to follow a conservative approach be-
cause for low luminosity AGNs the transition between
radio–quiet and radio–loud most likely occurs at higher
values than for high power objects, similarly to the classi-
cal radio–loudness parameter R derived using the radio-
to-optical luminosity ratio (Terashima & Wilson 2003;
Chiaberge et al. 2005; Sikora et al. 2007).
v) The source must be observed with HST WFC3–IR.
Most of the images are taken from the CANDELS survey
(Koekemoer et al. 2011; Grogin et al. 2011), or from sur-
rounding fields observed as part of program GO-12866
(see Table 2). The ECDF sample includes 6 HzLLRGs.
We also use the same criteria to select HzLLRG in the
CANDELS UDS field in the Subaru/XMM Newton Deep
field survey (SXDF, Ueda et al. 2008). The radio data
are from (Simpson et al. 2012), the 24µm Spitzer IR data
are taken from the Spitzer Public Legacy Survey of the
UKIDSS Ultra Deep Survey (SpUDS, P.I. J.S. Dunlop)
using the IRSA database. Only two galaxies that satisfy
our selection criteria lie in the region covered by the HST
WFC3 observations.
The properties of the 8 galaxies included in the
HzLLRG sample are reported in Table 2. In Fig. 1
we show the radio power vs. redshift distribution of
these AGNs, compared with the other radio loud sam-
ples. Note that the two radio loud samples at z > 1
used in this paper (i.e. the 3CR and the HzLLRGs) are
separated by about 4dex in radio power, on average.
2.3. Radio quiet AGNs: low-power Type 2 AGNs at
1 < z < 2.5
The sample of low-power Type 2 AGN (LPTy2AGN)
is selected from the 4Msec CDFS catalog and source clas-
sification (Xue et al. 2011). We include objects that are
classified as AGNs, that do not show strong broad emis-
sion lines in the optical spectrum, and whose redshift is
1.0 < z < 2.5. We also use the additional constraint
that the intrinsic (de-absorbed) X-ray luminosity (inte-
grated between 2 and 10 keV, in the rest frame of the
source) must be L2−10keV < 2 × 1042
erg s−1
, in order
to be consistent with the properties of the corresponding
radio loud sample described in Sect. 2.2. The L2−10keV
luminosity is derived from the 0.5-8keV luminosity listed
in the catalog, converted to the 2-10keV band using a
photon index Γ = 1.8. Furthermore, for the objects
that are detected in the radio, we require that the X-
ray radio loudness parameter RX defined in Sect. 2.2 is
< −3.5. The sample includes 26 objects. These are very
low power AGNs that are similar to Seyfert 2 galaxies in
the local Universe. The properties of these AGNs are re-
ported in Tables 3. The HST/WFC3-IR images for this
sample are taken from the CANDELS survey (Koeke-
moer et al. 2011; Grogin et al. 2011).
2.4. Radio quiet AGNs: high-power Type 2 AGNs at
1 < z < 2.5
As for the low power AGNs described above, the sam-
ple of high-power Type 2 AGN (HPTy2AGN) is drawn
from the CDFS. When selecting this sample we want to
match as close as possible both the redshift range and the
bolometric luminosity of the powerful 3CR radio galaxy
sample.
The sample of high-power Type 2 AGNs includes ob-
jects classified as AGN with redshift 1 < z < 2.5 and
intrinsic X-ray luminosity L2−10keV > 1044
erg s−1
. The
lower limit in X-ray power is chosen to match the prop-
erties of the 3CR sample described in Sect. 2.1. Two
of the objects (166 and 577) show relatively broad MgII
and CIII] emission lines in the optical spectrum (Szokoly
et al. 2004). However, the HST images clearly show the
host galaxy and there is no evidence for the presence of
any strong unresolved nuclear source, as it would be ex-
pected for a powerful Type 1 QSO. Therefore, for the
purpose of this work, we consider those two objects as
Type 2, regardless of the presence of broad lines.
As for the LPTy2AGN, for the objects that are de-
tected in the radio, we require that the X-ray radio loud-
ness parameter RX defined in Sect. 2.2 is < −3.5. This
sample includes 9 AGNs (see Table 4). The HST/WFC3-
IR images for this sample are taken from the CANDELS
survey (Koekemoer et al. 2011; Grogin et al. 2011).
RLAGN are mergers 5
TABLE 1
High z 3CR Radio Galaxies
Name R.A. (2000.0) Decl. (2000.0) Redshift log P1.4GHz L24µm
hh:mm:ss.ss dd:mm:ss.ss z log[erg s−1 Hz−1] log[erg s−1 Hz−1]
3C 210 08:58:10.0 +27:50:52 1.169 35.13 45.65
3C 255 11:19:25.2 –03:02:52 1.355 35.29 <44.54
3C 257 11:23:09.2 +05:30:19 2.474 35.94 45.94
3C 297 14:17:24.0 –04:00:48 1.406 35.33 44.84
3C 300.1 14:28:31.3 –01:24:08 1.159 35.37 –
3C 305.1 14:47:09.5 +76:56:22 1.132 35.10 45.36
3C 322 15:35:01.2 +55:36:53 1.168 35.20 44.90
3C 324 15:49:48.9 +21:25:38 1.206 35.34 45.48
3C 326.1 15:56:10.1 +20:04:20 1.825 35.75 45.64
3C 356 17:24:19.0 +50:57:40 1.079 34.96a 45.52
3C 454.1 22:50:32.9 +71:29:19 1.841 35.60 45.67
Note. — S1.4 from Condon et al. (1998) except for a Laing & Peacock (1980). The 24µm
luminosities are derived from the fluxes published in Podigachoski et al. (2015).
TABLE 2
High z Low Luminosity Radio Galaxies
ID R.A. (2000.0) Decl. (2000.0) Redshift HST Survey or Prog. ID log P1.4GHz log L2−10 q24
hh:mm:ss.ss dd:mm:ss.ss z log[erg s−1 Hz−1] log[erg s−1]
ECDFS
65 03:31:23.30 -27:49:05.80 1.10a 12866 31.85 <42.56 -1.54
127 03:31:34.13 -27:55:44.40 1.06 12866 30.51 <42.69 -0.09
215 03:31:50.74 -27:53:52.15 1.77 12866 31.13 <42.69 -0.46
338 03:32:10.79 -27:46:27.80 1.61b CANDELS 31.29 42.43 -0.98
410 03:32:19.30 -27:52:19.38 1.10b CANDELS 30.37 <42.27 -0.23
412 03:32:19.51 -27:52:17.69 1.06 CANDELS 30.93 <42.24 -0.51
UDS
48 02 18 18.38 -05 15 45.2 1.56 CANDELS 32.27 <43.93 0.09
124 02 17 04.77 -05 15 18.1 1.28b CANDELS 31.54 <43.73 -0.50
Note. — For the ECDFS sources the ID corresponds to the source ID in the Bonzini et al. (2012) catalog. For the
UDS galaxies, the ID is the Simpson et al. (2012) source number. Redshifts are photometric redshifts from Bonzini et al.
(2012), except where stated otherwise. The UDS sources are undetected in the X-rays.
a Photometric redshift from Cardamone et al. (2010)
b Spectroscopic redshift
Since the X-ray luminosity might be poorly con-
strained because of the uncertainty on the amount of
nuclear obscuration, we should also make sure that this
sample and the Hz3Cs have similar mid-IR luminosities.
We performed a K-S test to check whether the distribu-
tions of 24µm luminosity of the Hz3C and HPTy2AGN
are different7
. The resulting p-value is p=0.1, therefore
we cannot reject the null hypothesis that the two distri-
butions are drawn from the same population.
2.5. Non-active galaxies at 1 < z < 2.5
This sample is derived from the 3D–HST survey of the
GOODS–SOUTH field (Giavalisco et al. 2004; Brammer
et al. 2012; Skelton et al. 2014). We select galaxies with
spectroscopic redshift 1 < z < 2.5 and with magnitude
in the F140W filter 19 < mF 140W < 22. The magnitude
range is chosen to match the magnitudes of the 3CR ra-
dio galaxies from Sect. 2.1 (Hilbert et al., in prep.). The
full sample includes 145 galaxies. We limit the sample
to the 50 objects included in the southern half area of
7 Note that we did not perform the same test for the LPTy2AGN
because those are all undetected at 24µm.
the field observed with WFC3-IR and the F140W filter
as part of the 3D-HST survey. Five of these objects are
AGNs, therefore we are left with a sample of 45 galaxies.
These are sufficient to provide us a statistically sound
sample to be compared with the active galaxy samples
described above. We refer to this sample as the bright
sample of non-active galaxies. Note that we could in
principle derive a larger sample by using the full area
covered by the 3D–HST image of the GOODS-S field.
However, this would not significantly improve the statis-
tics for a sample that is already the largest we consider.
In the same area of the sky, we also select a compara-
ble sample of fainter galaxies (22 < mKs
< 24) from the
same HST survey. This sample spans the same magni-
tude range as the bulk of our radio–quiet AGN popula-
tion. In the following, we will refer to this sample as the
faint galaxies sample.
Even if we are selecting objects in the very same red-
shift range, the near-IR (rest-frame optical) magnitude
might not be a good tracer of the stellar mass because
of the possible presence of obscuration in some objects.
We do not believe that this might significantly affect our
results. However, in order to perform a sanity check,
6 Chiaberge et al.
TABLE 3
Radio Quiet Low Power Ty2 AGN at 1 < z < 2.5
ID R.A. Decl. Redshift log L2−10
hh:mm:ss.s dd:mm:ss.s z log[erg s−1]
Low Power Type 2 AGN (CDFS)
125 03:32:06.77 -27:49:14.10 1.050 42.04
147 03:32:09.22 -27:51:43.50 1.352 41.99
216 03:32:15.26 -27:44:38.60 1.109 41.70
225 03:32:15.91 -27:48:02.20 1.520 41.90
226 03:32:16.04 -27:48:59.90 1.413 41.91
247 03:32:17.84 -27:52:10.80 1.760 42.15
317 03:32:23.16 -27:45:55.00 1.224 42.25
318 03:32:23.17 -27:44:41.60 1.571 42.09
321 03:32:23.61 -27:46:01.40 1.033 41.98
376 03:32:27.04 -27:53:18.60 1.103 41.88
389 03:32:28.62 -27:45:57.20 1.626 41.97
394 03:32:28.85 -27:47:56.00 1.383 41.89
416 03:32:29.94 -27:52:52.80 1.017 41.76
419 03:32:30.05 -27:50:26.80 1.005 41.48
428 03:32:31.11 -27:49:40.00 1.508 41.79
455 03:32:33.06 -27:48:07.80 1.188 41.75
462 03:32:33.67 -27:47:51.20 1.388 41.84
463 03:32:33.84 -27:46:00.60 1.903 42.09
491 03:32:35.80 -27:47:35.10 1.223 42.13
493 03:32:35.98 -27:48:50.70 1.309 42.19
504 03:32:36.35 -27:49:33.40 1.508 41.81
536 03:32:39.07 -27:53:14.80 1.380 41.98
541 03:32:39.42 -27:53:12.70 1.381 42.00
545 03:32:39.65 -27:47:09.60 1.317 41.88
558 03:32:41.01 -27:51:53.40 1.476 42.19
579 03:32:43.45 -27:49:02.20 1.603 41.97
Note. — The ID corresponds to the source ID in the Xue
et al. (2011) catalog. The redshifts (zadopt in the Xue et al.
catalog) are spectroscopic, if available, or photometric. The
intrinsic X-ray luminosities (converted to the 2-10keV band
as explained in the text) are also from Xue et al. (2011).
we also select a sample of non-active galaxies in the full
GOODS-S area of 3D–HST matched to the stellar mass
estimates of the Hz3C galaxies. At 1 < z < 2.5 these are
typically between 1 × 10¹¹
and 5 × 10¹¹
M (Seymour
et al. 2007), although a small number of lower mass ob-
jects are also present. Although stellar mass measure-
ments based on SED fitting heavily rely on models, it is
important to check that our non-active galaxy samples
are correctly representing the population of objects we
need for comparison. If we restrict our range of masses
between the above values, and after excluding those that
are AGNs, we obtain 23 objects. About half of them
are in common with the bright sample. While we do not
consider this as our main control sample of non-active
galaxies, results for this sample are briefly discussed in
Sect. 4, for the sake of completeness.
The HST/WFC3-IR images are taken as part of the
3DHST survey with the F140W filter.
3. MERGER FRACTION
In order to measure the merger fraction we use at least
four human classifiers for each sample. For the Hz3C
and the Ty2 AGN samples we used six classifiers, to be
sure that the authors of the paper were not biased a
priori towards any specific result. Each classifier visually
inspects all of the targets. While being qualitative in
nature, visual classification has been proven to be an
effective way of classify mergers, since the eye can pick
all of the different signatures of such events. On the other
hand, quantitative methods using the Gini coefficient G,
the concentration index C, the asymmetry index A, or
the second-order moment of the brightest 20 per cent of
the light (M20) only select particular mergers that each
of the above indicators are able to identify (Lotz et al.
2011). Therefore, if we use any of those methods we
would derive smaller merger fractions.
We classify objects as mergers (or post-mergers) if clear
signatures of a mergers are present. These include the
presence of double/multiple nuclei, close pairs, tidal tails,
bridges, or distorted morphologies clearly indicating a
recent or ongoing merger. Close pairs are defined using
a projected separation of less than 25kpc between the
center of the galaxies involved, corresponding to 3 arcsec
in the redshift range spanned by our z > 1 samples8
.
Such a scale is similar to the typical separations observed
in galaxy pairs at low redshifts (e.g. Smith & Heckman
1989; Behroozi et al. 2015)9
.
When possible, mergers are also visually distinguished
between major and minor, assuming the usual separation
at a ∼ 4:1 mass/apparent brightness ratio (e.g. Lotz et al.
2011). If there is no clear evidence for any of the above
properties, we classify the object as a non-merger. For
the AGN samples, a blind classification is performed, i.e.
classifiers did not know whether each object was radio-
loud or radio-quiet, and if it belonged to the high or low-
power class. Classifiers are also asked to classify objects
more than once (typically twice).
While substantial agreement exists between the differ-
ent classifiers for most of the objects, different people
may see different features in each image, thus the classi-
fication for single sources may differ. This is why we do
not report the merger classification for each galaxy in the
tables. In order to reduce the effects of large deviations
among the different classifiers we calculate 10%-trimmed
means for each sample10
. We report the results for each
of the samples at z > 1 in Tab. 5.
Examples of the morphologies observed in the differ-
ent samples are given in Figs. 2, 3, and 4. In order to
avoid confusion between our merger classification crite-
ria, we use the figures to give a few specific examples.
3C 297 and 3C356 in Fig. 2 are both classified as merg-
ers based on those clear signatures of interaction. 3C 297
also shows a double nucleus. Although not all cases are
as straightforward as these, similar considerations can be
made for objects in the other samples (see e.g. the sys-
tems shown in the right panes of both Figs. 3 and 4). In
8 Between z=1 and z=2.5 the projected scale varies by less than
0.1 arcsec.
9 Note that the definitions of “double nucleus” and “close pair”
are only formally different. For the purposes of our work, these
objects are in fact the same. The different names only identify
the appearance of the object in the image, since our classification
is based on visual inspection. We classify the object as a double
(or multiple) nucleus if the two objects are not clearly separated
and they appear to lie within a common envelope. If the galaxies
are well separated, but their nuclei are less than ∼ 25kpc apart,
then we call it a close pair. However, it is important to note that
all of these objects are required to display evidence of bridges or
asymmetries to be classified as mergers.
10 Trimmed (or truncated) means are robust estimators of cen-
tral tendency, and it is less sensitive on the outliers than the mean.
Trimmed means are derived by calculating the mean after discard-
ing parts at the high and low ends of a probability distribution. In
our case, the distribution is defined by the number of mergers ob-
tained for each sample by each of the classifiers, and we reject 10%
at both ends. Note that a 50% trimmed mean would correspond
to the median.
RLAGN are mergers 7
TABLE 4
Radio Quiet High Power Ty2 AGN at 1 < z < 2.5
ID R.A. Decl. Redshift log L2−10 log L24µm
hh.mm.ss.s dd.mm.ss.s z log[erg s−1] log[erg s−1]
166 03:32:10.93 -27:44:15.20 1.605 44.21 44.81
243 03:32:17.19 -27:52:21.00 1.097 44.05 44.39
257 03:32:18.35 -27:50:55.61 1.536 44.07 44.30
278 03:32:20.07 -27:44:47.51 1.897 44.06 45.04
351 03:32:25.70 -27:43:06.00 2.291 44.31 45.46
518 03:32:37.77 -27:52:12.61 1.603 44.23 45.38
577 03:32:43.24 -27:49:14.50 1.920 44.12 44.70
713 03:33:05.90 -27:46:50.70 2.202 44.02 –
720 03:33:07.64 -27:51:27.30 1.609 44.39 –
Note. — The ID corresponds to the source ID in the Xue et al. (2011)
catalog. The redshifts (zadopt in the Xue et al. catalog) are spectroscopic,
if available, or photometric. The intrinsic X-ray luminosities (converted to
the 2-10keV band as explained in the text) are also from Xue et al. (2011).
The 24µm luminosities are from Cardamone et al. (2008).
Fig. 2.— RGB images of four radio galaxies from the high-z 3CR sample showing clear evidence for recent or ongoing major merger.
The objects are (from left to right, top to bottom) 3C 210, 3C297, 3C356 and 3C454.1. The HST WFC3-IR F140W image was used for
the R channel. The WFC3-UVIS F606W image was used for both the G and B channels. North is up, East is left. Data from Hilbert et
al. (in preparation)
particular, the objects shown in Fig. 3 are most likely ex-
amples of dry mergers in which the galaxy isophotes are
highly asymmetric (see e.g. Bell et al. 2006). The central
panels of Fig. 4 show objects that some of the classifiers
classified as mergers, while others did not. Those that
classified the objects as mergers noticed some asymme-
tries in the isophotes of the galaxies, in addition to the
presence of small companions.
The observed merger fraction in the radio-loud samples
(Hz3C and HzLLRG) are clearly larger than those found
for radio-quiet and non-active galaxies. In Sect. 4, we
test this result using careful statistical analysis.
3.1. On the impact of different sensitivities on the
merger classification
TABLE 5
Observed Merger Fractions (trimmed means) for the
z > 1 samples
Sample Sample Size Merger Fraction
Hz3C 11 100%
HzLLRG 8 88%
LPTy2AGN 26 38%
HPTy2AGN 9 33%
Bright Galaxies 45 27%
Faint Galaxies 46 20%
RL (3C + LLRG) 19 95%
RQ (HP+LPTy2AGN) 35 37%
The goal of this work is to identify merging systems
in samples of objects that were observed as part of dif-
8 Chiaberge et al.
Fig. 3.— Four examples of the morphologies observed among
the z > 1 radio quiet AGNs. In the top panels, we show two
LPTy2AGNs. A non-merger and a merger are shown on the left
and on the right, respectively. In the bottom panels, the same is
shown for two HPTy2AGNs. The circles are 6 arcsec radius, which
correspond to ∼ 50 kpc at the redshift of the objects. Images
are from CANDELS (Koekemoer et al. 2011; Grogin et al. 2011,
HST/WFC3/F160W).
ferent surveys or observing programs. All of the images
were taken using the WFC3-IR camera. Its extremely
high sensitivity and spatial resolution allows us to detect
low surface brightness features that characterize recent
merger events at z ∼ 1 − 2 even in short (1 orbit or less)
observations. However, for the sake of clarity, we report
in Table 6 the 5σ surface brightness limits for the dif-
ferent surveys we use. To derive the limits we used the
WFC3-IR Exposure Time Calculator (ETC). We assume
a 2x2 pixel extraction area and a spectrum of an ellipti-
cal galaxy with a UV upturn to perform the conversion
between F160W (used for the CANDELS observations)
and F140W magnitudes. Although the CANDELS deep
images we used for the radio quiet samples and for the
HzLLRGs are deeper than all other data, we checked
that the merger classification is not different if the shal-
lower 3D-HST images are considered. The images show
the very same features, irrespective of the redshift of the
source. The faintest tidal structures are less prominent
in the shallower images, but that does not significantly
affect our classification. The short exposure times of the
3C snapshot survey are also sufficient to detect the faint
features we are interested in, in the range of redshift of
our sample, as shown by the fact that that sample has
the greater observed merger fraction.
4. STATISTICAL ANALYSIS
The main goal of this work is to investigate if mergers
are associated with AGN activity and if that plays a role
in triggering such a phenomenon. Most importantly, we
want to test whether different classes of AGNs (e.g. radio
quiet vs. radio loud, low vs high bolometric luminosity)
are more likely to be triggered by merger than others.
We also test the hypothesis that AGNs are no different
than non-active galaxies.
We perform a set of statistical tests to compare the
derived merger fractions for the five different samples
described in Sect. 2. Throughout the paper, statistical
tests are performed using different techniques in the R
environment (R Core Team 2014).
We use the Bayesian version of the proportion test us-
ing bayes.prop.test, as part of the Bayesian First Aid
package for R (B˚a˚ath 2014). In principle, Bayesian tests
are more useful than classical proportion tests, since they
provide an estimate of the relative frequency of suc-
cess (e.g. Bolstad 2007). In this simplified version of
the Bayesian tests, the priors are uninformative, i.e. a
uniform distribution. This is suitable for our purposes,
since we have no a priori knowledge of the distribution
of mergers in each sample11
.
In table 7 we list the relative frequencies of success for
each sample, together with the 95% credible intervals.
By testing each sample against each of the others, we
can firmly establish that the Hz3C has a larger merger
fraction than both of the Ty2AGN samples (P> 99.9%).
The Hz3C merger fraction is also larger than that of
the non-active galaxies (both bright and faint samples,
P> 99.9%). Furthermore, the HzLLRGs are significantly
more associated with mergers than the non-active galax-
ies (P> 99.9). All other tests are inconclusive12
. How-
ever, these are very important results.
Furthermore, if we merge the two samples of z > 1
radio loud objects and we test them against the radio
quiet AGNs, the result is extremely robust. The merger
fraction in our sample of radio–loud AGNs is significantly
higher than that in the radio–quiet sample. This is again
a notable result, since the (Bayesian) merger fractions
for the RL and RQ sample are 92% and 38%, respec-
tively. As expected, the same result holds (with an even
higher statistical significance) for the RL sample against
the non–active (both bright and faint) galaxies, while
the RQ sample does not show any statistically significant
difference with respect to the non-active galaxies. It is
particularly important to note the results for the samples
that are matched in magnitude. On the one hand, the
RL and the bright galaxy sample are different, and on
the other hand, the RQ and the faint galaxy sample are
statistically indistinguishable.
As a sanity check, to avoid possible biases from a se-
lection made using near-IR magnitudes, we also used
the smaller sample of high-mass non-active galaxies (see
Sect. 2.5). In particular, given that we measure a merger
fraction of 30%+19%
−17%, the high-mass sample is statisti-
cally different from the Hz3C, with a Bayesian probabil-
ity > 99.9%. On the other hand, the merger fraction
in such a sample is statistically indistinguishable from
those in both the faint and the bright samples of non-
active galaxies.
Finally, we wish to point out that among the sam-
ples of radio-loud AGNs at z > 1 the large majority of
the objects (∼ 90%) appear to be associated with major
mergers. On the other hand, for radio quiet AGNs at
z > 1, only ∼ 50% of the observed mergers are major
mergers. Note that this is only based on our qualitative
11 We also perform a complete set of classical proportion tests
using the R task prop.test. For these classical tests we reject the
null hypothesis that the merger fractions in two samples are the
same if the p-value is p < 0.01. Not surprisingly, the results are
perfectly in agreement with the Bayesian relative frequencies. For
the sake of clarity, here we only discuss in details the Bayesian
results.
12 For a 2-sample proportion test in classical statistics this means
that we cannot reject the null hypothesis that the observed merger
fractions in two samples are the same (p-value < 0.01). For our
Bayesian treatment, this implies that the probability that one sam-
ple has a higher (or lower) merger fraction than the other is less
than 99%.
RLAGN are mergers 9
Fig. 4.— Six examples of non–active galaxies from our z > 1 sample. Both in the top and bottom rows, objects that are unanimously
classified as non-mergers or mergers are shown in the left and right panels, respectively. Objects with mixed classification are shown in
the middle panels. The circles are 6 arcsec radius, which correspond to ∼ 50 kpc at the redshift of the objects. Images are from 3D-HST
(Giavalisco et al. 2004; Brammer et al. 2012; Skelton et al. 2014, HST/WFC3/F140W)
TABLE 6
Surface brightness limits
Survey or HST Prog. ID Sample HST Camera/Filter 5σ Surface Brightness Limit Sensitivity
µF140W [ABmag arcsec−2] AB mag
SNAP-13023 Hz3C WFC3/F140W 23.9 25.8
CANDELS wide RQ and HzLLRG WFC3/F160W 24.1 26.5
CANDELS deep RQ and HzLLRG WFC3/F160W 25.6 27.2
3D-HST non-active WFC3/F140W 24.1 26.2
GO-12866 HzLLRG WFC3/F160W 25.0 26.7
Low-z Samples
GO-9045 3CRR,6C,7C,TOOT WFPC2/F785LP 20.7 24.9
SNAP-10173 3CR (z< 0.3) NICMOS/NIC2/F160W 22.5 24.3
Note. — The 5σ limits are estimated using the WFC3-IR ETC and assuming a 2x2 pixel extraction region. In column
4 we report the limit surface brightness for each datasets, converted to the WFC3-IR F140W filter to allow for an easy
comparison between the different surveys. An elliptical galaxy spectrum with UV upturn redshifted to the appropriate
redshift for each sample was used for the conversion between the two WFC3 filters. RQ in the samples column refers to
both the LP and HPTy2AGN samples. For the low redshift samples (GO9045 and SNAP10173) we used synphot to convert
magnitudes to the WFC3 filter system. In column 5 we report the 5σ image sensitivities calculated for point sources in
each of the bands used for the observations.
visual classification of the mergers. A more careful clas-
sification would require 2-D galaxy modeling and SEDs
to derive stellar mass estimates for the galaxies involved
in each merger, which is beyond the goals of this work.
4.1. Lower redshift samples of radio loud AGNs
One important goal of this work is to establish whether
the merger fraction for radio-loud AGN depends on ei-
ther redshift or luminosity. In order to test if that is
the case, we used additional lower redshift samples, for
comparison with the z > 1 data.
McLure et al. (2004) observed a sample of 41 inter-
mediate (z∼ 0.5) radio galaxies with HST and WFPC2
(GO 9045, P.I. Willott). The sample is taken from four
different complete catalogs, spanning about 4 dex in ra-
TABLE 7
Estimated Bayesian probabilities for the z > 1 samples.
Sample Merger Fraction 95% Credible Interval
Hz3C 94% 0.78 - 1.00
HzLLRG 82% 0.57 - 0.99
LPTy2AGN 39% 0.22 - 0.57
HPTy2AGN 36% 0.11 - 0.64
Bright Galaxies 27% 0.15 - 0.40
Faint Galaxies 20% 0.10 - 0.33
RL (3C + LLRG) 92% 0.78 - 1.00
RQ (HP+LPTy2AGN) 38% 0.23 - 0.54
dio power. The four catalogs are all complete, flux lim-
ited and radio selected at low frequencies. The sam-
10 Chiaberge et al.
TABLE 8
Estimated Bayesian probabilities for the z < 1 radio loud
AGN samples.
Sample Size Merger Fraction 95% Credible Interval
Willott Samples
3CRR 13 74% 0.53 - 0.94
6CE 7 68% 0.38 - 0.93
7CRS 9 65% 0.37 - 0.89
TOOT 12 65% 0.39 - 0.87
Full Sample 41 70% 0.56 - 0.83
Low Redshift Radio galaxies
z < 0.3 3CR 101 88% 0.81 - 0.94
ple includes objects from the 3CRR, 6CE, 7CRS and
the TexOx-1000 (TOOT sample, hereinafter) (McLure
et al. 2004, and references therein). The redshift range
spanned by the objects observed with WFPC2 is between
z = 0.40 and 0.59. We will refer to these galaxies as the
Willott sample throughout the paper.
For these objects, we retrieved the HST data from the
MAST and we reduced them using Astrodrizzle (Fruchter
et al. 2012). We then classify the objects between merg-
ers and non-mergers, since no classification was provided
in the original paper by McLure et al. (2004), and for
consistency with the other samples. Note that the filter
used for these observations (F785LP) provides images at
∼ 5300˚A in the rest frame. This is similar to the rest
frame wavelength of the WFC3-IR observations for the
z > 1 samples described above. In Tab. 8 we report the
merger fractions for this sample. The merger fractions
are statistically compatible with those for the radio-loud
samples at higher redshifts.
At even lower redshifts, we use the observations of the
3CR sample with z < 0.3 taken with HST-NICMOS
(program SNAP10173) and the F160W filter (Madrid
et al. 2006). Although these observations are in the rest-
frame IR, they are better suitable for our purposes than
the optical data of the same sample taken with WFPC2
(de Koff et al. 1996; Martel et al. 1999) because the NIC-
MOS images are significantly deeper. For this sample,
we consider the results published by Floyd et al. (2008).
These authors classified all of the objects in mergers, pre-
mergers, tidal-tails, major and minor companions. The
field of view covered by NIC2 is 19.2 × 19.2 , which
corresponds to 50x50 kpc2
at the median redshift of the
sample. They found that 89 out of 101 objects fall into
at least one of these categories. This corresponds to a
merger fraction of 0.88, with a Bayesian 95% credible in-
terval [0.81–0.94]. If we exclude objects with only minor
companions (i.e. 1 mag fainter than the radio galaxy
host, as defined by Floyd at al., 2008), the fraction is
reduced to 0.76 with a Bayesian 95% credible interval
[0.68–0.84].
Since the observations are not homogeneous, these two
lower redshift samples are only considered here for com-
parison. However, we do not base our conclusions on
these samples only.
5. DISCUSSION
The main result of this work is that the samples of ra-
dio quiet and radio loud Type 2 AGNs at 1 < z < 2.5
have different merger fractions. We showed that there is
clear statistical evidence that the radio loud AGNs al-
most always reside in environments where mergers are
undergoing, or that recently happened. As discussed
below, this is independent of the radio (or bolometric)
power of the AGN, and it is statistically compatible with
merger fractions as high as ∼ 100%.
The sample with the highest observed merger fraction
is the z > 1 3CR. In principle, this sample could be bi-
ased, since HST only imaged ∼ 35% of the radio galaxies
with z > 1 included in the 3CR catalog. However, it is
important to note that the observations were performed
as part of an HST SNAPSHOT program. In SNAP pro-
grams, targets are randomly selected based on the avail-
ability of gaps in the HST schedule. Therefore, there
was no a priori knowledge of the properties of the ob-
served targets with respect to the complete sample. But
since the observed sample is small, it is still possible that
we ended up picking a large number of objects in merg-
ers only by chance. In the following we briefly discuss
such an issue. For example, we could in principle as-
sume that the original population is composed by ∼50%
of mergers and 50% of non-mergers, similarly to what is
observed in our sample of non-active galaxies. We can
test the probability of obtaining a sample of 12 merg-
ers, randomly extracted from the complete sample of 34
radio galaxies included in the 3CR catalog with z > 1.
The selection of the 3CR catalog only covered part of
the sky (Decl. > −10 deg). Therefore, we should cor-
rect for the area coverage to obtain the total number
of radio sources (i.e. 58 radio galaxies). The binomial
probability of obtaining 12 mergers out of 12 observed is
extremely small (P = 2 × 10⁻⁴
). However, when objects
are randomly drawn from a sample without replacement,
the Hypergeometric distribution must be used instead of
the binomial. In that case, the probability of obtain-
ing 12 mergers out of 12 observed, from a population of
58 objects in which 50% of the objects are mergers is
P = 5.8 × 10⁻⁵
. Note that if the merger fraction in the
complete sample is higher than 72%, then the (hypergeo-
metric) probability of obtaining 12 mergers is P > 0.01.
Since that corresponds to the significance level we set
for all of the statistical tests, we can state that we can-
not completely rule out that the merger fraction in the
3CR is as low as ∼ 72%. Interestingly, this is similar
to the lower value of the credible interval given by the
Bayesian analysis for this sample (see Tab. 7). The only
other selection bias that might affect our sample is the
Eddington (1913) bias. However, that would have the
effect of lowering the actual number of sources in our
sample, and that in turn would lower the probability of
the hypergeometric distribution.
Therefore, we conclude that even if the number of 3CR
galaxies observed at z > 1 is small, the probability that
the observed merger fraction is overestimated because of
any selection bias is extremely small.
5.1. Radio loud samples: no trends with redshift and
luminosity
In this section we discuss the results we obtained for
the different radio loud samples. It is in fact particu-
larly interesting to investigate whether the merger frac-
tion in these object may depend on e.g. redshift, lumi-
nosity, or on the original criteria for each sample selec-
RLAGN are mergers 11
Fig. 5.— Left: merger fraction vs. redshift for the samples of radio loud and radio quiet AGN, and for non-active galaxies. The
coordinates of the filled dots are the median redshift of each sample, and the Bayesian merger probability. The errorbars show the range of
redshift spanned by each sample and the Bayesian 95% credible intervals for the merger probability. The High-z radio–loud sample (green
dot) corresponds to the 3CR at z > 1 merged with the HzLLRG sample to improve the statistics. The radio-quiet Ty2 AGN samples at
z > 1 are also merged (light red). The bright and faint samples of non active galaxies are plotted in yellow and cyan. The Willott sample
(3CR, 6CE, 7CRS and TOOT samples at z ∼ 0.5) is in red. The blue dot represents the 3CR sample with z < 0.3. Right: merger fraction
vs. radio luminosity at 151MHz for the radio loud samples. In this panel, the Willott samples (here marked as TOOT, 6C, 7C and 3C)
and the high-z radio-loud samples (Hz3CR and HzLLRG) are plotted separately. The color code is the same as for the left panel.
tion. However, while the statistical analysis clearly shows
that radio loud objects are almost all associated with
mergers, one important caveat is that the samples are
small. This is particularly true for the radio-loud sam-
ples (except for the low-z 3CR), but also for the high-z
radio-quiet comparison sample. Unfortunately, this pre-
vents us from drawing statistically firm conclusions on
any possible trends between the different samples of ra-
dio galaxies. For example, we cannot determine whether
the HzLLRG’s are less likely to be associated with merg-
ers than the Hz3C’s even if the observed fraction is lower
in the former than in the latter. Similarly, we cannot
determine whether each of the samples at z ∼ 0.5 that
compose the Willott sample behave differently, for exam-
ple as a result of their different radio power.
However, it is interesting to consider radio-loud sam-
ples grouped by redshift bin. We can thus compare the
merger fractions for the low-z 3CR, the whole Willott
sample (TOOT+7CRS+6CE+3CRR), and the high-z
objects (3CR+HzLLRG). In Sect. 4 we showed that we
find no statistical evidence that that the observed merger
fractions are different for any of those groups. Therefore,
while we wish to stress that this does not imply that they
are the same, we can conclude that the data show no ev-
idence for a redshift evolution. By comparing the 95%
Bayesian credible intervals, we can also conclude that
the merger fractions do not differ by more than ∼ 20%.
Since the samples are well separated in radio luminos-
ity, it is straightforward to perform a similar analysis for
samples grouped by radio luminosity, and conclude that
the merger fraction in low and high-power samples does
not differ by more than 20%. This is a notable result,
since these samples are separated by more than 4 dex
in radio power, and span a wide range of redshift (see
Fig.1).
In Fig.5 we show the Bayesian 95% credible inter-
vals for each of the groups of radio loud objects plot-
ted against the redshift (left panel) and radio luminos-
ity (right panel) range spanned by each group. In the
left panel (merger fraction vs redshift) we also include
the radio-quiet AGNs and the two samples of non-active
galaxies. The radio-quiet AGNs and the non–active
galaxies are not plotted in the right panel, since any
trends with the radio power would be irrelevant. In fact,
the origin of radio emission in radio-quiet AGN is still de-
bated, as it could be either thermal or non-thermal, and
a possible contribution from starbursts could not be ex-
cluded at the lowest luminosities. Starbursts are instead
the most likely origin for the radio emission in non-active
galaxies. These objects would lie on the bottom-left of
the figure in the right panel, but any correlation with
the merger fraction would be meaningless. As it is clear
from the figure (left panel), the only group of radio loud
AGNs that is still marginally compatible with the ra-
dio quiet samples is the Willott sample. However, this
might be due to the fact that the images were taken
with WFPC2, which was significantly less sensitive than
WFC3-IR. In Tab. 6 we report the limit magnitude es-
timated using the WFPC2 Exposure Time Calculator,
and converted to the F140W filter using synphot to al-
low an easier comparison with the WFC3 observations.
The value mF 140w = 20.7 mag arcsec−2
was derived us-
ing an elliptical galaxy spectrum redshifted to z=0.5. As
a result of that, some images might not show faint sur-
face brightness structures such as e.g. asymmetries or
tidal tails, which might lead us to misclassify some of
the objects as non-mergers. Deeper images with WFC3
or with ACS in the I band should be taken in order to
12 Chiaberge et al.
achieve a more reliable estimate of the merger fraction
in the Willott sample.
The right panel of Fig. 5 shows the merger fraction for
each sample, against radio power at 151MHz13
. Here we
plot the Willott samples separately, since they belong to
different luminosity bins. The low-z 3CR span a large
range in radio power. Most of these 3CR objects are
confined to the lower luminosity bin, as it is clear from
Fig. 1. As noted above, except for the low-z 3CR for
which the merger fraction is much better constrained,
the number statistics is small and the error on the merger
fraction is large. However the figure clearly shows that
all of the samples are located in the upper part up the
diagram, and that no trend with radio power is visible.
Finally, in Fig. 6 we show the merger fraction against
the radio loudness parameter RX. In order to represent
the average value of RX for each sample, we calculated
average values for both the radio and the X-ray lumi-
nosities (see the caption for references). The data are
very uncertain, since the information is extremely sparse.
This especially holds for the X-ray data of the Hz3C and
the Willott sample, while most of the HzLLRG only have
upper limits in the X-ray band, so the radio loudness of
the HzLLRGs is represented as a lower limit. Note that
∼ 20% of the radio-quiet objects are detected in the ra-
dio band. The value of Rx for the radio-quiet samples is
thus calculated using the average radio luminosity for the
detected objects, and the points in the figure are shown
as upper limits for the radio loudness parameter. For
all other samples, to be safe, we assume uncertainties up
to ∼ ±0.5dex in RX. This is reasonable considering the
uncertainties in the X-ray luminosity and the range of
radio and X-ray luminosity spanned by the objects.
This plot summarizes the main result of this work,
i.e. that radio quiet sources are systematically associ-
ated to smaller merger fractions (and they are located in
the lower-left side of the figure), while radio loud AGN
are unambiguously associated with mergers (and they are
located in the upper-right side of the figure).
5.2. Comparison with other recent results
Our results basically agree with the findings of Ramos
Almeida et al. (2012) and Ramos Almeida et al. (2013).
Those studies focus on samples of relatively low-redshift
(z < 0.7) sources with deep ground based observations.
These authors found that the large majority (∼ 80%)
of radio-loud objects show disturbed morphologies, and
they also reside in dense environments. However, the
parameter space covered by those papers is limited to
luminous low-redshift objects, while our work spans a
significantly larger range both in redshift and luminos-
ity. The same group also studied a sample of 20 Type 2
quasars (Bessiere et al. 2012) that includes at least two
RLQSOs, based on their location in the L5GHz v L[OIII]
plane (Xu et al. 1999). As expected in light of our results,
both RLQSOs are associated with mergers. The merger
fraction in the full sample is as high as 75%. If we only
exclude those two sources that exceed their definition of
radio-loudness, the observed merger fraction among the
remaining radio-quiet objects is still quite large (72%).
13 Measurements at radio frequencies different form 151MHz
were converted to the reference wavelength using a spectral index
α = 0.8 and Fν ∝ ν−α.
Fig. 6.— Merger fraction vs. average radio loudness parameter
RX for the different AGN samples. Filled symbols are the radio
loud samples, empty symbols are radio quiet. The Hz3C sam-
ple is plotted as a circle, the HzLLRG is the square (lower limit),
Willott’s 3CRR is the triangle, and the low-z 3CR is the pentagon.
For the radio quiet samples (empty symbols) the LPTy2AGN
sample is the triangle, and the HPTy2AGN is the square. The
dashed line represents the radio loudness threshold for PG QSOs
(Terashima & Wilson 2003). The solid line marks the 60% merger
fraction that appears to roughly separate radio–loud and radio–
quiet samples. Color code is the same as for Fig. 5
While this might appear in disagreement with our mea-
sured fraction for the RQAGNs, the uncertainty on the
value found by these authors is large, as a result of the
small number statistics (13 possible mergers out of 18 ob-
jects). Since the samples are small, we cannot reject the
null hypothesis that a 72% merger fraction for that sam-
ple is different from the fraction measured in our sample
of RQAGNs.
One of the major points here is that we showed that
there is no evidence for a trend with luminosity, at least
for the radio loud samples. This is apparently at odds
with the results of Treister et al. (2012), where only the
most powerful samples appear to predominantly reside
in merging systems. However, it is interesting to briefly
discuss their work in the light of our results. Two sam-
ples show a significantly greater merger fraction than any
other samples treated in that work. Those are the sample
of dust-reddened Type 1 QSOs of Urrutia et al. (2008)
and the Bahcall et al. (1997) sample of Type 1 QSOs.
The former is most likely biased in favor of a high merger
fraction, because of the nature of those obscured quasars.
The latter, instead, is more interesting. Of the 20 QSOs
observed with HST by Bahcall et al. (1997), 14 are radio
quiet and 6 are radio loud. All of the 6 RLQSOs are ap-
parently merging or show irregular features that might
be explained with a merger, in agreement with our re-
sults. Thus if we only limit the analysis to the RQQSOs,
the fraction of mergers is ∼ 50%, in agreement with our
findings. Therefore, we argue that the high fraction of
mergers in the full Bahcall sample (65%) could in princi-
ple be explained, in light of our results, by the fact that
a significant fraction of the objects are radio loud.
RLAGN are mergers 13
6. IMPLICATIONS FOR THE ORIGIN OF
RADIO-LOUDNESS
Our results show that radio galaxies are unambigu-
ously associated with mergers, independently of redshift
and luminosity, while radio-quiet AGN at z > 1 are in-
distinguishable from normal galaxies in the same red-
shift range. This result may have profound implications
for our understanding of the mechanisms that enable the
production of powerful relativistic jets from supermassive
BHs. In fact, such a strong connection between mergers
and radio loud AGNs may be a clue for a direct link
between these two phenomena.
The central question here is whether mergers may pro-
vide, or at least substantially contribute to the physical
conditions that ultimately enable the formation of jets in
RLAGNs.
6.1. Not all mergers may generate a RLAGN
First of all, we should point out that most mergers do
not generate a RLAGN. This is clear from the fact that
a fraction of non-active galaxies at z > 1 are seen to be
merging, but they show no signs of radio-loud activity. If
there is an association between these two phenomena, it
is not a univocal cause/effect relationship. Based on our
results, the same also holds for radio-quiet AGNs since a
fraction of those are associated with mergers. Thus, we
conclude that mergers are unrelated to radio-quiet AGNs
or, alternatively, only a fraction of those may be triggered
by mergers. However, it is worth noting that our defini-
tion of merger includes objects that still have to merge
as well as objects for which the signs of a past merger
are somehow still visible. Therefore, the timescale dur-
ing which we observe a merger is probably of the order of
at least ∼ 1-2 Gyr (e.g Di Matteo et al. 2005). The time
scale for radio loud activity is most likely significantly
shorter (∼ 107
− 108
yr) . Therefore, we cannot exclude
that some of the non-active galaxies that we observe in a
merger phase are turned-off radio loud AGNs, or, alter-
natively, they still have to be turned-on. Summarizing,
we believe that not all mergers may directly generate a
radio-loud AGN. Below we discuss a few possible condi-
tions for a merger to trigger RLAGN activity.
6.2. Conditions for mergers to trigger RLAGNs
We argue that when certain conditions are met, merg-
ers may trigger radio loud nuclear activity. What we
ultimately wish to know is what those conditions are.
An important piece of information here is that the asso-
ciation between mergers and RLAGNs is robustly estab-
lished at all redshifts. While both recent simulations and
observations show that the galaxies merger rate increases
with redshift (e.g. Hopkins et al. 2006; Conselice et al.
2003; Lotz et al. 2011; Rodriguez-Gomez et al. 2015),
our results show that there is no evidence that the merger
fraction for RLAGN is higher at higher z. Of course, this
should be confirmed through the analysis of larger sam-
ples that may better constrain the merger fractions and
highlight any possible trends with redshift. But even if
the uncertainties remain large with the present samples,
the existence of such a tight relationship between the
two phenomena means that somehow a RLAGN needs a
merger (at all redshifts) in order to manifest itself. The
predominance of major mergers among our radio loud
samples (at least at z > 1) that is apparent from vi-
sual inspection needs to be confirmed through a more
quantitative analysis. However, this may imply that one
of the conditions that must be met in order to trigger
a RLAGN is that the merger needs to be between two
galaxies (and thus between two BHs) of similar mass. It
is well known that radio galaxies are ubiquitously asso-
ciated with very massive hosts ( 1010−11
M , e.g. Best
et al. 2005) and high-mass SMBH ( 108
M Laor 2000;
Chiaberge & Marconi 2011; Dunlop et al. 2003; Best &
Heckman 2012). Therefore, we expect those major merg-
ers to involve high mass objects only.
6.3. How do mergers affect the central supermassive
black holes?
Understanding the details of this issue is central to our
future work on the subject, but it is beyond the scope
of this paper. However, we can build on our results and
speculate on a possible scenario. One of the effects of
mergers is to lower the specific angular momentum of the
gas in the galaxy, and thus to drive the gas towards the
center (e.g. Hernquist 1989; Hopkins & Quataert 2011).
While this may naturally happen in gas rich mergers, as
those observed in our high-z 3CR sample (e.g. Barthel
et al. 2012; Tadhunter et al. 2014; Podigachoski et al.
2015), the hosts of low redshift radio galaxies (in partic-
ular those of low radio powers) are often relatively gas–
poor systems. Therefore, this effect may play a role at
higher redshifts, but it is very unlikely to be the ultimate
cause of radio loud activity in general. Furthermore, tidal
effects happen in all mergers, thus merger events should
affect both RQ and RL AGNs at the same level, contrary
to our results.
Another effect of mergers is to alter the spin and the
mass of the central black hole. That can be achieved in
two ways, i.e. either via accretion, or via BH-BH merger
(e.g. Volonteri et al. 2013). The former implies that a
large amount of gas is driven toward the central region
of the galaxy, for a significant amount of time. If the
accretion of matter is coherent, i.e. if the flow of matter
occurs at a fixed angular momentum axis, that ultimate
leads to spinning-up the black hole. On the other hand, if
accretion results from multiple merger events that drive
the matter towards the black hole from different direc-
tions, the BH is spinned-down. In any case, as already
pointed out above, the expected amount of gas in major
mergers (at least at low redshifts) is probably too small
to alter the BH spin significantly in these objects.
In the case of BH-BH merger, the two BH coalesce
and the resulting object has increased mass and, in most
cases, a lower spin per unit mass. But there are scenar-
ios in which those events lead to the opposite result. For
example, it has been shown that a single major BH-BH
merger, where the ratio between the masses of the two
involved BHs approaches unity, may generate a spinning
BH, even if the two merging black hole are initially not
spinning (Hughes & Blandford 2003; Baker et al. 2006;
Li et al. 2010; Giacomazzo et al. 2012; Schnittman 2013,
for a recent review). However, current simulations are
unable to reproduce BH with dimensionless spin param-
eter greater than ∼ 0.94 as a result of BH-BH mergers
alone (Hemberger et al. 2013).
6.4. The role of rapidly spinning black holes
14 Chiaberge et al.
According to the so-called spin paradigm (Wilson &
Colbert 1995; Blandford et al. 1990), radio loud AGNs
are associated with rapidly spinning black holes, while
BHs in radio quiet AGN are expected to spin less rapidly.
Those major mergers that result in rapidly spinning
black holes may provide the link between our observa-
tions and the physics behind the RLAGN phenomenon
as a whole. Clearly, the objects that we are seeing in a
pre-merger phase, or the very few ones that are associ-
ated with a minor merger, do not fit the above scheme. In
those cases, we must assume that another major merger
event happened in the recent past. This does not seem
unreasonable, since all of these objects lie in over-dense
environments, but it should be proven by finding the sig-
natures of that previous merger.
In a framework in which BHs are spun up by major
BH-BH mergers, we expect a range of resulting spin val-
ues. Therefore, it is possible that different radio mor-
phologies (and radio powers) are associated with differ-
ent BH spin levels. For example, only the BHs that spin
more rapidly might be able to produce the most rela-
tivistic jets, in a framework in which the jet is powered
by energy extracted from the rotating black hole (e.g.
Blandford & Znajek 1977; McKinney et al. 2012; Ghis-
ellini et al. 2014). Such a scenario has been explored
for X-ray binaries jets, so far leading to contrasting re-
sults (e.g. Gardner & Done 2014; Narayan & McClin-
tock 2012; Fender et al. 2010; Russell et al. 2013). It
is interesting to note that Fanidakis et al. (2011) were
able to reproduce the RL and RQ AGN populations in
the context of galaxy evolution. Their model is based
on a scheme that includes a bimodal BH spin distribu-
tion mainly caused by the the combination of accretion
of matter onto the black hole and by the different type of
mergers that galaxies of different stellar mass undergo.
As pointed out in the previous section, black holes
could also be spun-up by merger-triggered accretion.
Such a mechanism could in principle account for our ob-
servations of mergers at z > 1, but only if those are gas-
rich mergers. However, it would not completely explain
the origin of radio-loud activity in low redshift, gas-poor
galaxies (see also the discussion in the next Section).
6.5. Low redshift radio loud AGNs
A scenario in which BH-BH mergers are directly im-
plied in triggering radio loud AGN activity seems to
be supported by the observed properties of low-redshift
RLAGN hosts. Capetti & Balmaverde (2006); de Ruiter
et al. (2005) showed that all radio loud AGNs in their
samples are hosted by core-galaxies, i.e. galaxies that
show a flat radial brightness profile in the central regions.
While this analysis is clearly limited to very low redshifts
(z 0.1), where the core radius can be resolved in HST
images, and to objects that are not affected by signifi-
cant amounts of dust in the central kiloparsecs, it very
clearly shows that there is a strong connection between
the presence of a core profile and RL activity. Interest-
ingly, one of the most likely explanations for the presence
of core profiles is related to a major BH-BH mergers, in
which the binary BH formed during the merger ejects
stars from the central regions before the two BHs coa-
lesce (e.g. Graham 2004; Merritt 2006). While the direct
physical connection between such a phenomenon and ra-
dio loud activity is still a matter of debate (see e.g. Chi-
aberge & Marconi 2011), it provides one more piece of
evidence that major mergers and radio loud AGNs are
strictly connected.
7. CONCLUSIONS
We derived the merger fraction in samples of z > 1
Type 2 RLAGN, Type 2 RQAGN, and non- active galax-
ies. We establish that the RLAGN are unambiguously
associated with mergers (92%+8%
−14%), while only 38%+16
−15
of the RQAGN show evidence for a merger. Non-
active galaxies are statistically indistinguishable from the
RQAGNs. The comparison with lower redshift samples
shows that there is no evidence for the fraction of mergers
in RLAGNs to be dependent on either redshift or AGN
luminosity.
Mergers are directly involved in triggering radio-loud
activity at all redshifts. We speculate that the galaxy
mergers we observe at z > 1 are responsible for spinning
up central black holes possibly through mergers of high-
mass BHs.
It will be extremely important to study the BH mass
distribution in samples of merging galaxies of different
type and to determine whether the BH mass and the
merger types are related to different type of activity.
Not all galaxy mergers in our RL samples appear the
same to visual inspection. It would be important to
firmly assess the ratio between major and minor mergers
at different redshifts, and radio power. The images in
this work show that a larger fraction of objects are in
a phase of ongoing- or post-major merger in higher red-
shift samples than in the lower redshift counterparts (see
also Floyd et al. 2008). The different HST cameras used
not only sample different rest-frame wavelengths (near-
IR at low-z and optical at z > 0.4), but they also have
significantly different sensitivities. It is extremely hard
to detect post-merger signatures such as e.g. faint tidal
tails in the intermediate redshift samples imaged with
WFPC2. Those features may lie outside the field of view
in the NICMOS images at low redshift. The only redshift
range that is covered with homogeneous observations is
between z=1 and 2.5. Clearly needed is a homogeneous
data set observed with HST-WFC3 or ACS at all red-
shifts.
Detailed studies of the mergers in our radio-loud sam-
ples using integral field spectroscopy, combined with deep
high resolution imaging in the rest frame IR , should be
used to study the kinematics of the mergers and mea-
sure a range of parameters such as dynamical masses
and angular momenta. The imaging part of the project
is feasible with WFC3, although at high redshifts the
rest frame wavelengths sampled by such a camera are
still within the optical bands. Dust obscuration may re-
duce the accuracy of the stellar mass measurements.
ALMA observations can trace the molecular gas in-
volved in the mergers. It is important to study a large
sample of these sources at different redshifts, to test
whether different amounts of gas are driven towards the
central supermassive black holes and whether that may
affect the type of radio loud nuclear activity A compari-
son with the mergers observed in radio-quiet AGNs and
in ULIRGs will elucidate the black hole feeding mecha-
nism in all of these sources, and relationships with AGN
activity.
This work is limited to Type 2 AGNs because in Type 1
RLAGN are mergers 15
AGNs the nuclear light from the central QSO hampers
morphological studies of the host galaxy. With a better
knowledge of the WFC3 PSF, such a study is possible
starting with the sample of 3CR QSOs at z > 1. Better
results can be achieved using coronographic observations
by Martel et al. (2003). While the coronographic mode is
now available on HST only in STIS, JWST with NIRISS
will allow us to image QSOs spanning a broader range of
redshift. We hope to be able to study in detail both the
structure and fueling mechanisms in Type 1 objects (see
e.g. Ford et al. 2014).
In conclusion, our results clearly establish that
RLAGNs are mergers. Conversely, based on the sam-
ples studied in this paper, we did not find any statistical
evidence that RQAGNs are related to merger events.
8. ACKNOWLEDGMENTS
The authors wish to thank G. Zamorani, C. O’Dea, S.
Baum and A. Capetti for insightful comments and sug-
gestions. We acknowledge W. B. Sparks and the HST-
3CR collaboration for making the images of the z > 1
3C radio galaxies available for this work. We are also in-
debted to M. Stiavelli and A. Mortazavi for helping out
with the mergers classification.
We are also greatful to the anonymous referee for
his/her helpful comments that greatly improved the pa-
per.
This research has made use of the NASA/IPAC In-
frared Science Archive, which is operated by the Jet
Propulsion Laboratory, California Institute of Technol-
ogy, under contract with the National Aeronautics and
Space Administration. This work is based on observa-
tions taken by the CANDELS Multi-Cycle Treasury Pro-
gram with the NASA/ESA HST, which is operated by
the Association of Universities for Research in Astron-
omy, Inc., under NASA contract NAS5-26555. This work
is based on observations taken by the 3D-HST Treasury
Program (GO 12177 and 12328) with the NASA/ESA
HST.
Based on observations made with the NASA/ESA
Hubble Space Telescope, obtained from the Data Archive
at the Space Telescope Science Institute, which is oper-
ated by the Association of Universities for Research in
Astronomy, Inc., under NASA contract NAS 5-26555.
REFERENCES
Alexander, D. M., & Hickox, R. C. 2012, New Astronomy Review,
56, 93
B˚a˚ath, R. 2014, in UseR! 2014 - the International R User
Conference
Bahcall, J. N., Kirhakos, S., Saxe, D. H., & Schneider, D. P. 1997,
ApJ, 479, 642
Baker, J. G., Centrella, J., Choi, D.-I., Koppitz, M., & van Meter,
J. 2006, Phys. Rev. D, 73, 104002
Balmaverde, B., Capetti, A., & Grandi, P. 2006, A&A, 451, 35
Barthel, P., Haas, M., Leipski, C., & Wilkes, B. 2012, ApJ, 757,
L26
Bell, E. F., Naab, T., McIntosh, D. H., et al. 2006, ApJ, 640, 241
Behroozi, P. S., Zhu, G., Ferguson, H. C., et al. 2015,
arXiv:1502.01342
Bessiere, P. S., Tadhunter, C. N., Ramos Almeida, C., & Villar
Mart´ın, M. 2012, MNRAS, 426, 276
Best, P. N., & Heckman, T. M. 2012, MNRAS, 421, 1569
Best, P. N., Kauffmann, G., Heckman, et al. 2005, MNRAS, 362,
25
Best, P. N., von der Linden, A., Kauffmann, G., Heckman, T. M.,
& Kaiser, C. R. 2007, MNRAS, 379, 894
Blandford, R. D., Netzer, H., Woltjer, L., Courvoisier, T. J.-L.,
& Mayor, M. 1990, Active Galactic Nuclei (Saas-Fee Advanced
Course 20. Lecture Notes 1990. Swiss Society for Astrophysics
and Astronomy, XII, 280 pp. 97 figs.. Springer-Verlag Berlin
Heidelberg New York)
Blandford, R. D., & Payne, D. G. 1982, MNRAS, 199, 883
Blandford, R. D., & Znajek, R. L. 1977, MNRAS, 179, 433
Bolstad, W. M. 2007, Introduction to Bayesian Statistics, 2nd
Edition (Wiley)
Bonzini, M., Mainieri, V., Padovani, P., et al. 2012, ApJS, 203, 15
Bonzini, M., Padovani, P., Mainieri, V., et al. 2013, MNRAS, 436,
3759
Brammer, G. B., van Dokkum, P. G., Franx, M., et al.. 2012, ApJS,
200, 13
Capetti, A., & Balmaverde, B. 2006, A&A, 453, 27
Cardamone, C. N., Urry, C. M., Damen, M., et al. 2008, ApJ, 680,
130
Cardamone, C. N., van Dokkum, P. G., Urry, C. M., et al. 2010,
ApJS, 189, 270
Chiaberge, M., Capetti, A., & Macchetto, F. D. 2005, ApJ, 625,
716
Chiaberge, M., & Marconi, A. 2011, MNRAS, 416, 917
Colina, L., & de Juan, L. 1995, ApJ, 448, 548
Condon, J. J., Cotton, W. D., Greisen, E. W., et al. 1998, AJ, 115,
1693
Conselice, C. J., Bershady, M. A., Dickinson, M., & Papovich, C.
2003, AJ, 126, 1183
de Koff, S., Baum, S. A., Sparks, W. B., et al. 1996, ApJS, 107,
621
De Lucia, G., & Blaizot, J. 2007, MNRAS, 375, 2
de Ruiter, H. R., Parma, P., Capetti, A., et al. 2005, A&A, 439,
487
Di Matteo, T., Springel, V., & Hernquist, L. 2005, Nature, 433,
604
Donoso, E., Li, C., Kauffmann, G., Best, P. N., & Heckman, T. M.
2010, MNRAS, 407, 1078
Dunlop, J. S., McLure, R. J., Kukula, M. J., et al. 2003, MNRAS,
340, 1095
Eddington, A. S. 1913, MNRAS, 73, 359
Fanaroff, B. L., & Riley, J. M. 1974, MNRAS, 167, 31P
Fanidakis, N., Baugh, C. M., Benson, A. J., et al. 2011, MNRAS,
410, 53
Fender, R. P., Gallo, E., & Russell, D. 2010, MNRAS, 406, 1425
Floyd, D. J. E., Axon, D., Baum, S., et al. 2008, ApJS, 177, 148
Ford, K. E. S., McKernan, B., Sivaramakrishnan, A., et al. 2014,
ApJ, 783, 73
Fruchter, A. S., Hack, W., Dencheva, N., et al. 2012, in American
Astronomical Society Meeting Abstracts, Vol. 219, American
Astronomical Society Meeting Abstracts #219, #145.15
Gardner, E., & Done, C. 2014, MNRAS, 438, 779
Ghisellini, G., Tavecchio, F., Maraschi, L., Celotti, A., & Sbarrato,
T. 2014, Nature, 515, 376
Giacconi, R., Zirm, A., Wang, J., et al. 2002, ApJS, 139, 369
Giacomazzo, B., Baker, J. G., Miller, M. C., Reynolds, C. S., &
van Meter, J. R. 2012, ApJ, 752, L15
Giavalisco, M., Ferguson, H. C., Koekemoer, A. M., et al. 2004,
ApJ, 600, L93
Graham, A. W. 2004, ApJ, 613, L33
Grogin, N. A., Kocevski, D. D., Faber, S. M., et al. 2011, ApJS,
197, 35
Grogin, N. A., Koekemoer, A. M., Schreier, E. J., et al. 2003, ApJ,
595, 685
Hawley, J. F., & Krolik, J. H. 2006, ApJ, 641, 103
Heckman, T. M., & Best, P. N. 2014, ARA&A, 52, 589
Heckman, T. M., Smith, E. P., Baum, S. A., et al. 1986, ApJ, 311,
526
Hemberger, D. A., Lovelace, G., Loredo, T. J., et al. 2013,
Phys. Rev. D, 88, 064014
Hernquist, L. 1989, Nature, 340, 687
Hernquist, L., & Mihos, J. C. 1995, ApJ, 448, 41
Hopkins, P. F., Cox, T. J., Kereˇs, D., & Hernquist, L. 2008a, ApJS,
175, 390
Hopkins, P. F., Hernquist, L., Cox, T. J., & Kereˇs, D. 2008b, ApJS,
175, 356
Hopkins, P. F., & Quataert, E. 2010, MNRAS, 407, 1529
16 Chiaberge et al.
—. 2011, MNRAS, 415, 1027
Hopkins, P. F., Somerville, R. S., Hernquist, L., et al. 2006, ApJ,
652, 864
Hughes, S. A., & Blandford, R. D. 2003, ApJ, 585, L101
Kartaltepe, J. S., Dickinson, M., Alexander, D. M., et al. 2012,
ApJ, 757, 23
Kellermann, K. I., Sramek, R., Schmidt, M., Shaffer, D. B., &
Green, R. 1989, AJ, 98, 1195
Koekemoer, A. M., Faber, S. M., Ferguson, H. C., et al. 2011, ApJS,
197, 36
Laing, R. A., & Peacock, J. A. 1980, MNRAS, 190, 903
Laor, A. 2000, ApJ, 543, L111
Lehmer, B. D., Brandt, W. N., Alexander, D. M., et al. 2005, ApJS,
161, 21
Li, Y., Hernquist, L., Robertson, B., et al. 2007, ApJ, 665, 187
Li, Y.-R., Wang, J.-M., Yuan, Y.-F., Hu, C., & Zhang, S. 2010,
ApJ, 710, 878
Lotz, J. M., Jonsson, P., Cox, T. J., et al. 2011, ApJ, 742, 103
Madrid, J. P., Chiaberge, M., Floyd, D., et al. 2006, ApJS, 164,
307
Martel, A. R., Baum, S. A., Sparks, W. B., et al. 1999, ApJS, 122,
81
Martel, A. R., Ford, H. C., Tran, H. D., et al. 2003, AJ, 125, 2964
McKinney, J. C., & Gammie, C. F. 2004, ApJ, 611, 977
McKinney, J. C., Tchekhovskoy, A., & Blandford, R. D. 2012,
MNRAS, 423, 3083
McLure, R. J., Willott, C. J., Jarvis, M. J., et al. 2004, MNRAS,
351, 347
Menci, N., Gatti, M., Fiore, F., & Lamastra, A. 2014, A&A, 569,
A37
Merritt, D. 1985, ApJ, 289, 18
Merritt, D. 2006, ApJ, 648, 976
Narayan, R., & McClintock, J. E. 2012, MNRAS, 419, L69
Ostriker, J. P., & Tremaine, S. D. 1975, ApJ, 202, L113
Podigachoski, P., Barthel, P. D., Haas, M., et al. 2015, ArXiv e-
prints:1501.01434
Pudritz, R. E., & Norman, C. A. 1986, ApJ, 301, 571
R Core Team. 2014, R: A Language and Environment for Statistical
Computing, R Foundation for Statistical Computing, Vienna,
Austria
Ramos Almeida, C., Bessiere, P. S., Tadhunter, C. N., et al. 2013,
MNRAS, 436, 997
Ramos Almeida, C., Bessiere, P. S., Tadhunter, C. N.,et al. 2012,
MNRAS, 419, 687
Rees, M. J. 1984, ARA&A, 22, 471
Rodriguez-Gomez, V., Genel, S., Vogelsberger, M., et al. 2015,
MNRAS, 449, 49
Russell, D. M., Gallo, E., & Fender, R. P. 2013, MNRAS, 431, 405
Sabater, J., Best, P. N., & Heckman, T. M. 2015, MNRAS, 447,
110
Salvati, M., Risaliti, G., V´eron, P., & Woltjer, L. 2008, A&A, 478,
121
Sanders, D. B., & Mirabel, I. F. 1996, ARA&A, 34, 749
S¸adowski, A., Narayan, R., Tchekhovskoy, A., et al. 2015, MNRAS,
447, 49
Schawinski, K., Simmons, B. D., Urry, C. M., Treister, E., &
Glikman, E. 2012, MNRAS, 425, L61
Schnittman, J. D. 2013, Classical and Quantum Gravity, 30, 244007
Seymour, N., Stern, D., De Breuck, C., et al. 2007, ApJS, 171, 353
Shen, Y., Strauss, M. A., Ross, N. P., et al. 2009, ApJ, 697, 1656
Sikora, M., Stawarz, L., & Lasota, J.-P. 2007, ApJ, 658, 815
Simpson, C., Rawlings, S., Ivison, R., et al. 2012, MNRAS, 421,
3060
Skelton, R. E., Whitaker, K. E., Momcheva, I. G., et al. 2014,
ApJS, 214, 24
Smith, E. P., & Heckman, T. M. 1989, ApJ, 341, 658
Soltan, A. 1982, MNRAS, 200, 115
Somerville, R. S., Hopkins, P. F., Cox, T. J., Robertson, B. E., &
Hernquist, L. 2008, MNRAS, 391, 481
Spinrad, H., Marr, J., Aguilar, L., & Djorgovski, S. 1985, PASP,
97, 932
Steinbring, E. 2011, AJ, 142, 172
Szokoly, G. P., Bergeron, J., Hasinger, G., et al. 2004, ApJS, 155,
271
Tadhunter, C., Dicken, D., Morganti, R., et al. 2014, MNRAS, 445,
L51
Tchekhovskoy, A., Narayan, R., & McKinney, J. C. 2011, MNRAS,
418, L79
Terashima, Y., & Wilson, A. S. 2003, ApJ, 583, 145
Treister, E., Schawinski, K., Urry, C. M., & Simmons, B. D. 2012,
ApJ, 758, L39
Tundo, E., Tozzi, P., & Chiaberge, M. 2012, MNRAS, 420, 187
Ueda, Y., Watson, M. G., Stewart, I. M., et al. 2008, ApJS, 179,
124
Urrutia, T., Lacy, M., & Becker, R. H. 2008, ApJ, 674, 80
Veilleux, S., Kim, D.-C., & Sanders, D. B. 2002, ApJS, 143, 315
Villforth, C., Hamann, F., Rosario, D. J., et al. 2014, MNRAS, 439,
3342
Volonteri, M., Sikora, M., Lasota, J.-P., & Merloni, A. 2013, ApJ,
775, 94
Wilkes, B. J., Kuraszkiewicz, J., Haas, M., et al. 2013, ApJ, 773,
15
Wilson, A. S., & Colbert, E. J. M. 1995, ApJ, 438, 62
Xu, C., Livio, M., & Baum, S. 1999, AJ, 118, 1169
Xue, Y. Q., Luo, B., Brandt, W. N., et al. 2011, ApJS, 195, 10

Weitere ähnliche Inhalte

Was ist angesagt?

Probing the innermost_regions_of_agn_jets_and_their_magnetic_fields_with_radi...
Probing the innermost_regions_of_agn_jets_and_their_magnetic_fields_with_radi...Probing the innermost_regions_of_agn_jets_and_their_magnetic_fields_with_radi...
Probing the innermost_regions_of_agn_jets_and_their_magnetic_fields_with_radi...
Sérgio Sacani
 
Evidence for a_distant_giant_planet_in_the_solar_system
Evidence for a_distant_giant_planet_in_the_solar_systemEvidence for a_distant_giant_planet_in_the_solar_system
Evidence for a_distant_giant_planet_in_the_solar_system
Sérgio Sacani
 
Ringed structure and_a_gap_at_1_au_in_the_nearest_protoplanetary_disk
Ringed structure and_a_gap_at_1_au_in_the_nearest_protoplanetary_diskRinged structure and_a_gap_at_1_au_in_the_nearest_protoplanetary_disk
Ringed structure and_a_gap_at_1_au_in_the_nearest_protoplanetary_disk
Sérgio Sacani
 
The yellow hypergiant HR 5171 A: Resolving a massive interacting binary in th...
The yellow hypergiant HR 5171 A: Resolving a massive interacting binary in th...The yellow hypergiant HR 5171 A: Resolving a massive interacting binary in th...
The yellow hypergiant HR 5171 A: Resolving a massive interacting binary in th...
GOASA
 
The characterization of_the_gamma_ray_signal_from_the_central_milk_way_a_comp...
The characterization of_the_gamma_ray_signal_from_the_central_milk_way_a_comp...The characterization of_the_gamma_ray_signal_from_the_central_milk_way_a_comp...
The characterization of_the_gamma_ray_signal_from_the_central_milk_way_a_comp...
Sérgio Sacani
 
Third epoch magellanic_clouud_proper_motions
Third epoch magellanic_clouud_proper_motionsThird epoch magellanic_clouud_proper_motions
Third epoch magellanic_clouud_proper_motions
Sérgio Sacani
 
Alignment of th_angular_momentum_vectors_of_planetary_nebulae_in_the_galactic...
Alignment of th_angular_momentum_vectors_of_planetary_nebulae_in_the_galactic...Alignment of th_angular_momentum_vectors_of_planetary_nebulae_in_the_galactic...
Alignment of th_angular_momentum_vectors_of_planetary_nebulae_in_the_galactic...
Sérgio Sacani
 
T he effect_of_orbital_configuration)_on_the_possible_climates_and_habitabili...
T he effect_of_orbital_configuration)_on_the_possible_climates_and_habitabili...T he effect_of_orbital_configuration)_on_the_possible_climates_and_habitabili...
T he effect_of_orbital_configuration)_on_the_possible_climates_and_habitabili...
Sérgio Sacani
 
First identification of_direct_collapse_black_holes_candidates_in_the_early_u...
First identification of_direct_collapse_black_holes_candidates_in_the_early_u...First identification of_direct_collapse_black_holes_candidates_in_the_early_u...
First identification of_direct_collapse_black_holes_candidates_in_the_early_u...
Sérgio Sacani
 
Young remmants of_type_ia_supernovae_and_their_progenitors_a_study_of_snr_g19_03
Young remmants of_type_ia_supernovae_and_their_progenitors_a_study_of_snr_g19_03Young remmants of_type_ia_supernovae_and_their_progenitors_a_study_of_snr_g19_03
Young remmants of_type_ia_supernovae_and_their_progenitors_a_study_of_snr_g19_03
Sérgio Sacani
 
Proper-motion age dating of the progeny of Nova Scorpii ad 1437
Proper-motion age dating of the progeny of Nova Scorpii ad 1437Proper-motion age dating of the progeny of Nova Scorpii ad 1437
Proper-motion age dating of the progeny of Nova Scorpii ad 1437
Sérgio Sacani
 
Shock breakout and_early_light_curves_of_type_ii_p_supernovae_observed_with_k...
Shock breakout and_early_light_curves_of_type_ii_p_supernovae_observed_with_k...Shock breakout and_early_light_curves_of_type_ii_p_supernovae_observed_with_k...
Shock breakout and_early_light_curves_of_type_ii_p_supernovae_observed_with_k...
Sérgio Sacani
 

Was ist angesagt? (20)

Evidence for reflected_lightfrom_the_most_eccentric_exoplanet_known
Evidence for reflected_lightfrom_the_most_eccentric_exoplanet_knownEvidence for reflected_lightfrom_the_most_eccentric_exoplanet_known
Evidence for reflected_lightfrom_the_most_eccentric_exoplanet_known
 
WHERE IS THE FLUX GOING? THE LONG-TERM PHOTOMETRIC VARIABILITY OF BOYAJIAN’S ...
WHERE IS THE FLUX GOING? THE LONG-TERM PHOTOMETRIC VARIABILITY OF BOYAJIAN’S ...WHERE IS THE FLUX GOING? THE LONG-TERM PHOTOMETRIC VARIABILITY OF BOYAJIAN’S ...
WHERE IS THE FLUX GOING? THE LONG-TERM PHOTOMETRIC VARIABILITY OF BOYAJIAN’S ...
 
Probing the innermost_regions_of_agn_jets_and_their_magnetic_fields_with_radi...
Probing the innermost_regions_of_agn_jets_and_their_magnetic_fields_with_radi...Probing the innermost_regions_of_agn_jets_and_their_magnetic_fields_with_radi...
Probing the innermost_regions_of_agn_jets_and_their_magnetic_fields_with_radi...
 
The abundance of_x_shpoaed_radio_sources_implications_for_the_gravitational_w...
The abundance of_x_shpoaed_radio_sources_implications_for_the_gravitational_w...The abundance of_x_shpoaed_radio_sources_implications_for_the_gravitational_w...
The abundance of_x_shpoaed_radio_sources_implications_for_the_gravitational_w...
 
A 2 4_determination_of_the_local_value_of_the_hubble_constant
A 2 4_determination_of_the_local_value_of_the_hubble_constantA 2 4_determination_of_the_local_value_of_the_hubble_constant
A 2 4_determination_of_the_local_value_of_the_hubble_constant
 
Deep chandra observations_of_pictor_a
Deep chandra observations_of_pictor_aDeep chandra observations_of_pictor_a
Deep chandra observations_of_pictor_a
 
Evidence for a_distant_giant_planet_in_the_solar_system
Evidence for a_distant_giant_planet_in_the_solar_systemEvidence for a_distant_giant_planet_in_the_solar_system
Evidence for a_distant_giant_planet_in_the_solar_system
 
Hats 6b a_warm_saturn_transiting_an_early_m_dwarf_star_and_a_set_of_empirical...
Hats 6b a_warm_saturn_transiting_an_early_m_dwarf_star_and_a_set_of_empirical...Hats 6b a_warm_saturn_transiting_an_early_m_dwarf_star_and_a_set_of_empirical...
Hats 6b a_warm_saturn_transiting_an_early_m_dwarf_star_and_a_set_of_empirical...
 
Storm in teacup_a_radio_quiet_quasar_with_radio_emitting_bubbles
Storm in teacup_a_radio_quiet_quasar_with_radio_emitting_bubblesStorm in teacup_a_radio_quiet_quasar_with_radio_emitting_bubbles
Storm in teacup_a_radio_quiet_quasar_with_radio_emitting_bubbles
 
Ringed structure and_a_gap_at_1_au_in_the_nearest_protoplanetary_disk
Ringed structure and_a_gap_at_1_au_in_the_nearest_protoplanetary_diskRinged structure and_a_gap_at_1_au_in_the_nearest_protoplanetary_disk
Ringed structure and_a_gap_at_1_au_in_the_nearest_protoplanetary_disk
 
The yellow hypergiant HR 5171 A: Resolving a massive interacting binary in th...
The yellow hypergiant HR 5171 A: Resolving a massive interacting binary in th...The yellow hypergiant HR 5171 A: Resolving a massive interacting binary in th...
The yellow hypergiant HR 5171 A: Resolving a massive interacting binary in th...
 
The characterization of_the_gamma_ray_signal_from_the_central_milk_way_a_comp...
The characterization of_the_gamma_ray_signal_from_the_central_milk_way_a_comp...The characterization of_the_gamma_ray_signal_from_the_central_milk_way_a_comp...
The characterization of_the_gamma_ray_signal_from_the_central_milk_way_a_comp...
 
Third epoch magellanic_clouud_proper_motions
Third epoch magellanic_clouud_proper_motionsThird epoch magellanic_clouud_proper_motions
Third epoch magellanic_clouud_proper_motions
 
Alignment of th_angular_momentum_vectors_of_planetary_nebulae_in_the_galactic...
Alignment of th_angular_momentum_vectors_of_planetary_nebulae_in_the_galactic...Alignment of th_angular_momentum_vectors_of_planetary_nebulae_in_the_galactic...
Alignment of th_angular_momentum_vectors_of_planetary_nebulae_in_the_galactic...
 
T he effect_of_orbital_configuration)_on_the_possible_climates_and_habitabili...
T he effect_of_orbital_configuration)_on_the_possible_climates_and_habitabili...T he effect_of_orbital_configuration)_on_the_possible_climates_and_habitabili...
T he effect_of_orbital_configuration)_on_the_possible_climates_and_habitabili...
 
First identification of_direct_collapse_black_holes_candidates_in_the_early_u...
First identification of_direct_collapse_black_holes_candidates_in_the_early_u...First identification of_direct_collapse_black_holes_candidates_in_the_early_u...
First identification of_direct_collapse_black_holes_candidates_in_the_early_u...
 
apj_825_1_40
apj_825_1_40apj_825_1_40
apj_825_1_40
 
Young remmants of_type_ia_supernovae_and_their_progenitors_a_study_of_snr_g19_03
Young remmants of_type_ia_supernovae_and_their_progenitors_a_study_of_snr_g19_03Young remmants of_type_ia_supernovae_and_their_progenitors_a_study_of_snr_g19_03
Young remmants of_type_ia_supernovae_and_their_progenitors_a_study_of_snr_g19_03
 
Proper-motion age dating of the progeny of Nova Scorpii ad 1437
Proper-motion age dating of the progeny of Nova Scorpii ad 1437Proper-motion age dating of the progeny of Nova Scorpii ad 1437
Proper-motion age dating of the progeny of Nova Scorpii ad 1437
 
Shock breakout and_early_light_curves_of_type_ii_p_supernovae_observed_with_k...
Shock breakout and_early_light_curves_of_type_ii_p_supernovae_observed_with_k...Shock breakout and_early_light_curves_of_type_ii_p_supernovae_observed_with_k...
Shock breakout and_early_light_curves_of_type_ii_p_supernovae_observed_with_k...
 

Andere mochten auch

Early optical spectra_of_nova_v1369_cen_show_the_presence_of_lithium
Early optical spectra_of_nova_v1369_cen_show_the_presence_of_lithiumEarly optical spectra_of_nova_v1369_cen_show_the_presence_of_lithium
Early optical spectra_of_nova_v1369_cen_show_the_presence_of_lithium
Sérgio Sacani
 
Galaxy dynamics and the mass density of the universe
Galaxy dynamics and the mass density of the universeGalaxy dynamics and the mass density of the universe
Galaxy dynamics and the mass density of the universe
Sérgio Sacani
 

Andere mochten auch (18)

Observational evidence for_a_dark_side_to_ngc5128_globular_cluster_system
Observational evidence for_a_dark_side_to_ngc5128_globular_cluster_systemObservational evidence for_a_dark_side_to_ngc5128_globular_cluster_system
Observational evidence for_a_dark_side_to_ngc5128_globular_cluster_system
 
The x ray_outburst_of_the_galactic_centre_magnetar_sgr_j1745_2900_during_the_...
The x ray_outburst_of_the_galactic_centre_magnetar_sgr_j1745_2900_during_the_...The x ray_outburst_of_the_galactic_centre_magnetar_sgr_j1745_2900_during_the_...
The x ray_outburst_of_the_galactic_centre_magnetar_sgr_j1745_2900_during_the_...
 
The mass of_the_mars_sized_exoplanet_kepler_138_b_from_transit_timing
The mass of_the_mars_sized_exoplanet_kepler_138_b_from_transit_timingThe mass of_the_mars_sized_exoplanet_kepler_138_b_from_transit_timing
The mass of_the_mars_sized_exoplanet_kepler_138_b_from_transit_timing
 
Lord of the_rings_a_kinematic_distance_to_circinus_x1_from_a_giant_x_ray_ligh...
Lord of the_rings_a_kinematic_distance_to_circinus_x1_from_a_giant_x_ray_ligh...Lord of the_rings_a_kinematic_distance_to_circinus_x1_from_a_giant_x_ray_ligh...
Lord of the_rings_a_kinematic_distance_to_circinus_x1_from_a_giant_x_ray_ligh...
 
Early optical spectra_of_nova_v1369_cen_show_the_presence_of_lithium
Early optical spectra_of_nova_v1369_cen_show_the_presence_of_lithiumEarly optical spectra_of_nova_v1369_cen_show_the_presence_of_lithium
Early optical spectra_of_nova_v1369_cen_show_the_presence_of_lithium
 
The morphological diversity_of_comet_67_p_churyumov_gerasimenko
The morphological diversity_of_comet_67_p_churyumov_gerasimenkoThe morphological diversity_of_comet_67_p_churyumov_gerasimenko
The morphological diversity_of_comet_67_p_churyumov_gerasimenko
 
Isolated compact elliptical_galaxies_stellar_systems_that_ran_away
Isolated compact elliptical_galaxies_stellar_systems_that_ran_awayIsolated compact elliptical_galaxies_stellar_systems_that_ran_away
Isolated compact elliptical_galaxies_stellar_systems_that_ran_away
 
Resonant interactions and_chaotic_rotation_of_plutos_small_moons
Resonant interactions and_chaotic_rotation_of_plutos_small_moonsResonant interactions and_chaotic_rotation_of_plutos_small_moons
Resonant interactions and_chaotic_rotation_of_plutos_small_moons
 
A permanent asymmetric_dust_cloud_around_the_moon
A permanent asymmetric_dust_cloud_around_the_moonA permanent asymmetric_dust_cloud_around_the_moon
A permanent asymmetric_dust_cloud_around_the_moon
 
The formation of_a_quadruple_star_system_with_wide_separation
The formation of_a_quadruple_star_system_with_wide_separationThe formation of_a_quadruple_star_system_with_wide_separation
The formation of_a_quadruple_star_system_with_wide_separation
 
Small particles dominate_saturn_phoebe_ring_to_surprisingly_large_distances
Small particles dominate_saturn_phoebe_ring_to_surprisingly_large_distancesSmall particles dominate_saturn_phoebe_ring_to_surprisingly_large_distances
Small particles dominate_saturn_phoebe_ring_to_surprisingly_large_distances
 
Intra cluster light_at_the_frontier_abell_2744
Intra cluster light_at_the_frontier_abell_2744Intra cluster light_at_the_frontier_abell_2744
Intra cluster light_at_the_frontier_abell_2744
 
Evidence ofr mature_bulges_and_an_inside_out_quenching_phase_3_billion_years_...
Evidence ofr mature_bulges_and_an_inside_out_quenching_phase_3_billion_years_...Evidence ofr mature_bulges_and_an_inside_out_quenching_phase_3_billion_years_...
Evidence ofr mature_bulges_and_an_inside_out_quenching_phase_3_billion_years_...
 
The computational limit_to_quantum_determinism_and_the_black_hole_information...
The computational limit_to_quantum_determinism_and_the_black_hole_information...The computational limit_to_quantum_determinism_and_the_black_hole_information...
The computational limit_to_quantum_determinism_and_the_black_hole_information...
 
The bubble like_interior_of_the_core_collapse_supernova_remnant_cassiopeia_a
The bubble like_interior_of_the_core_collapse_supernova_remnant_cassiopeia_aThe bubble like_interior_of_the_core_collapse_supernova_remnant_cassiopeia_a
The bubble like_interior_of_the_core_collapse_supernova_remnant_cassiopeia_a
 
Helium atmospheres on_warm_neptune_and_sub_neptune_sized_exoplanets_and_appli...
Helium atmospheres on_warm_neptune_and_sub_neptune_sized_exoplanets_and_appli...Helium atmospheres on_warm_neptune_and_sub_neptune_sized_exoplanets_and_appli...
Helium atmospheres on_warm_neptune_and_sub_neptune_sized_exoplanets_and_appli...
 
Mars methane detection_and_variability_at_gale_crater
Mars methane detection_and_variability_at_gale_craterMars methane detection_and_variability_at_gale_crater
Mars methane detection_and_variability_at_gale_crater
 
Galaxy dynamics and the mass density of the universe
Galaxy dynamics and the mass density of the universeGalaxy dynamics and the mass density of the universe
Galaxy dynamics and the mass density of the universe
 

Ähnlich wie Radio loud agn_are_mergers

Submillimeter galaxies as_progenitors_of_compact_quiescent_galaxies
Submillimeter galaxies as_progenitors_of_compact_quiescent_galaxiesSubmillimeter galaxies as_progenitors_of_compact_quiescent_galaxies
Submillimeter galaxies as_progenitors_of_compact_quiescent_galaxies
Sérgio Sacani
 
DYNAMICAL ANALYSIS OF THE DARK MATTER AND CENTRAL BLACK HOLE MASS IN THE DWAR...
DYNAMICAL ANALYSIS OF THE DARK MATTER AND CENTRAL BLACK HOLE MASS IN THE DWAR...DYNAMICAL ANALYSIS OF THE DARK MATTER AND CENTRAL BLACK HOLE MASS IN THE DWAR...
DYNAMICAL ANALYSIS OF THE DARK MATTER AND CENTRAL BLACK HOLE MASS IN THE DWAR...
Sérgio Sacani
 
Hydrogen Column Density Variability in a Sample of Local Compton-Thin AGN
Hydrogen Column Density Variability in a Sample of Local Compton-Thin AGNHydrogen Column Density Variability in a Sample of Local Compton-Thin AGN
Hydrogen Column Density Variability in a Sample of Local Compton-Thin AGN
Sérgio Sacani
 
Kinematics and simulations_of_the_stellar_stream_in_the_halo_of_the_umbrella_...
Kinematics and simulations_of_the_stellar_stream_in_the_halo_of_the_umbrella_...Kinematics and simulations_of_the_stellar_stream_in_the_halo_of_the_umbrella_...
Kinematics and simulations_of_the_stellar_stream_in_the_halo_of_the_umbrella_...
Sérgio Sacani
 
An excess of dusty starbursts related to the Spiderweb galaxy
An excess of dusty starbursts related to the Spiderweb galaxyAn excess of dusty starbursts related to the Spiderweb galaxy
An excess of dusty starbursts related to the Spiderweb galaxy
GOASA
 
A spectroscopic sample_of_massive_galaxies
A spectroscopic sample_of_massive_galaxiesA spectroscopic sample_of_massive_galaxies
A spectroscopic sample_of_massive_galaxies
Sérgio Sacani
 
Search for an Isotropic Gravitational-wave Background with the Parkes Pulsar ...
Search for an Isotropic Gravitational-wave Background with the Parkes Pulsar ...Search for an Isotropic Gravitational-wave Background with the Parkes Pulsar ...
Search for an Isotropic Gravitational-wave Background with the Parkes Pulsar ...
Sérgio Sacani
 
The Lyα Reference Sample. XIV. Lyα Imaging of 45 Low-redshift Star-forming Ga...
The Lyα Reference Sample. XIV. Lyα Imaging of 45 Low-redshift Star-forming Ga...The Lyα Reference Sample. XIV. Lyα Imaging of 45 Low-redshift Star-forming Ga...
The Lyα Reference Sample. XIV. Lyα Imaging of 45 Low-redshift Star-forming Ga...
Sérgio Sacani
 
Large scale mass_distribution_in_the_illustris_simulation
Large scale mass_distribution_in_the_illustris_simulationLarge scale mass_distribution_in_the_illustris_simulation
Large scale mass_distribution_in_the_illustris_simulation
Sérgio Sacani
 
Eso1426a
Eso1426aEso1426a
Eso1426a
GOASA
 
Stellar tidal streams_in_spiral_galaxies_of_the_local_volume
Stellar tidal streams_in_spiral_galaxies_of_the_local_volumeStellar tidal streams_in_spiral_galaxies_of_the_local_volume
Stellar tidal streams_in_spiral_galaxies_of_the_local_volume
Sérgio Sacani
 
Candels the correlation_between_galaxy_morphology_and_star_formation_activity...
Candels the correlation_between_galaxy_morphology_and_star_formation_activity...Candels the correlation_between_galaxy_morphology_and_star_formation_activity...
Candels the correlation_between_galaxy_morphology_and_star_formation_activity...
Sérgio Sacani
 
The identification of_93_day_periodic_photometric_variability_for_yso_ylw_16a
The identification of_93_day_periodic_photometric_variability_for_yso_ylw_16aThe identification of_93_day_periodic_photometric_variability_for_yso_ylw_16a
The identification of_93_day_periodic_photometric_variability_for_yso_ylw_16a
Sérgio Sacani
 
Eso1437a
Eso1437aEso1437a
Eso1437a
GOASA
 

Ähnlich wie Radio loud agn_are_mergers (20)

Slowpokes
SlowpokesSlowpokes
Slowpokes
 
Submillimeter galaxies as_progenitors_of_compact_quiescent_galaxies
Submillimeter galaxies as_progenitors_of_compact_quiescent_galaxiesSubmillimeter galaxies as_progenitors_of_compact_quiescent_galaxies
Submillimeter galaxies as_progenitors_of_compact_quiescent_galaxies
 
DYNAMICAL ANALYSIS OF THE DARK MATTER AND CENTRAL BLACK HOLE MASS IN THE DWAR...
DYNAMICAL ANALYSIS OF THE DARK MATTER AND CENTRAL BLACK HOLE MASS IN THE DWAR...DYNAMICAL ANALYSIS OF THE DARK MATTER AND CENTRAL BLACK HOLE MASS IN THE DWAR...
DYNAMICAL ANALYSIS OF THE DARK MATTER AND CENTRAL BLACK HOLE MASS IN THE DWAR...
 
Hydrogen Column Density Variability in a Sample of Local Compton-Thin AGN
Hydrogen Column Density Variability in a Sample of Local Compton-Thin AGNHydrogen Column Density Variability in a Sample of Local Compton-Thin AGN
Hydrogen Column Density Variability in a Sample of Local Compton-Thin AGN
 
Kinematics and simulations_of_the_stellar_stream_in_the_halo_of_the_umbrella_...
Kinematics and simulations_of_the_stellar_stream_in_the_halo_of_the_umbrella_...Kinematics and simulations_of_the_stellar_stream_in_the_halo_of_the_umbrella_...
Kinematics and simulations_of_the_stellar_stream_in_the_halo_of_the_umbrella_...
 
An excess of dusty starbursts related to the Spiderweb galaxy
An excess of dusty starbursts related to the Spiderweb galaxyAn excess of dusty starbursts related to the Spiderweb galaxy
An excess of dusty starbursts related to the Spiderweb galaxy
 
An excess of_dusty_starbusts_related_to_the_spiderweb_galaxy
An excess of_dusty_starbusts_related_to_the_spiderweb_galaxyAn excess of_dusty_starbusts_related_to_the_spiderweb_galaxy
An excess of_dusty_starbusts_related_to_the_spiderweb_galaxy
 
A spectroscopic sample_of_massive_galaxies
A spectroscopic sample_of_massive_galaxiesA spectroscopic sample_of_massive_galaxies
A spectroscopic sample_of_massive_galaxies
 
Major mergers host_the_most_luminous_red_quasars_at_z2_a_hubble_space_telesco...
Major mergers host_the_most_luminous_red_quasars_at_z2_a_hubble_space_telesco...Major mergers host_the_most_luminous_red_quasars_at_z2_a_hubble_space_telesco...
Major mergers host_the_most_luminous_red_quasars_at_z2_a_hubble_space_telesco...
 
From globular clusters_to_tidal_dwarfs_structure_formation_in_the_tidal_tails...
From globular clusters_to_tidal_dwarfs_structure_formation_in_the_tidal_tails...From globular clusters_to_tidal_dwarfs_structure_formation_in_the_tidal_tails...
From globular clusters_to_tidal_dwarfs_structure_formation_in_the_tidal_tails...
 
Search for an Isotropic Gravitational-wave Background with the Parkes Pulsar ...
Search for an Isotropic Gravitational-wave Background with the Parkes Pulsar ...Search for an Isotropic Gravitational-wave Background with the Parkes Pulsar ...
Search for an Isotropic Gravitational-wave Background with the Parkes Pulsar ...
 
The Lyα Reference Sample. XIV. Lyα Imaging of 45 Low-redshift Star-forming Ga...
The Lyα Reference Sample. XIV. Lyα Imaging of 45 Low-redshift Star-forming Ga...The Lyα Reference Sample. XIV. Lyα Imaging of 45 Low-redshift Star-forming Ga...
The Lyα Reference Sample. XIV. Lyα Imaging of 45 Low-redshift Star-forming Ga...
 
Large scale mass_distribution_in_the_illustris_simulation
Large scale mass_distribution_in_the_illustris_simulationLarge scale mass_distribution_in_the_illustris_simulation
Large scale mass_distribution_in_the_illustris_simulation
 
Eso1426a
Eso1426aEso1426a
Eso1426a
 
Stellar tidal streams_in_spiral_galaxies_of_the_local_volume
Stellar tidal streams_in_spiral_galaxies_of_the_local_volumeStellar tidal streams_in_spiral_galaxies_of_the_local_volume
Stellar tidal streams_in_spiral_galaxies_of_the_local_volume
 
The Cosmic V-Web
The Cosmic V-WebThe Cosmic V-Web
The Cosmic V-Web
 
Candels the correlation_between_galaxy_morphology_and_star_formation_activity...
Candels the correlation_between_galaxy_morphology_and_star_formation_activity...Candels the correlation_between_galaxy_morphology_and_star_formation_activity...
Candels the correlation_between_galaxy_morphology_and_star_formation_activity...
 
The identification of_93_day_periodic_photometric_variability_for_yso_ylw_16a
The identification of_93_day_periodic_photometric_variability_for_yso_ylw_16aThe identification of_93_day_periodic_photometric_variability_for_yso_ylw_16a
The identification of_93_day_periodic_photometric_variability_for_yso_ylw_16a
 
Eso1437a
Eso1437aEso1437a
Eso1437a
 
MUSE sneaks a peek at extreme ram-pressure stripping events. I. A kinematic s...
MUSE sneaks a peek at extreme ram-pressure stripping events. I. A kinematic s...MUSE sneaks a peek at extreme ram-pressure stripping events. I. A kinematic s...
MUSE sneaks a peek at extreme ram-pressure stripping events. I. A kinematic s...
 

Mehr von Sérgio Sacani

Biogenic Sulfur Gases as Biosignatures on Temperate Sub-Neptune Waterworlds
Biogenic Sulfur Gases as Biosignatures on Temperate Sub-Neptune WaterworldsBiogenic Sulfur Gases as Biosignatures on Temperate Sub-Neptune Waterworlds
Biogenic Sulfur Gases as Biosignatures on Temperate Sub-Neptune Waterworlds
Sérgio Sacani
 
Asymmetry in the atmosphere of the ultra-hot Jupiter WASP-76 b
Asymmetry in the atmosphere of the ultra-hot Jupiter WASP-76 bAsymmetry in the atmosphere of the ultra-hot Jupiter WASP-76 b
Asymmetry in the atmosphere of the ultra-hot Jupiter WASP-76 b
Sérgio Sacani
 
Formation of low mass protostars and their circumstellar disks
Formation of low mass protostars and their circumstellar disksFormation of low mass protostars and their circumstellar disks
Formation of low mass protostars and their circumstellar disks
Sérgio Sacani
 
Discovery of an Accretion Streamer and a Slow Wide-angle Outflow around FUOri...
Discovery of an Accretion Streamer and a Slow Wide-angle Outflow around FUOri...Discovery of an Accretion Streamer and a Slow Wide-angle Outflow around FUOri...
Discovery of an Accretion Streamer and a Slow Wide-angle Outflow around FUOri...
Sérgio Sacani
 
Disentangling the origin of chemical differences using GHOST
Disentangling the origin of chemical differences using GHOSTDisentangling the origin of chemical differences using GHOST
Disentangling the origin of chemical differences using GHOST
Sérgio Sacani
 
Hubble Asteroid Hunter III. Physical properties of newly found asteroids
Hubble Asteroid Hunter III. Physical properties of newly found asteroidsHubble Asteroid Hunter III. Physical properties of newly found asteroids
Hubble Asteroid Hunter III. Physical properties of newly found asteroids
Sérgio Sacani
 
Observation of Gravitational Waves from the Coalescence of a 2.5–4.5 M⊙ Compa...
Observation of Gravitational Waves from the Coalescence of a 2.5–4.5 M⊙ Compa...Observation of Gravitational Waves from the Coalescence of a 2.5–4.5 M⊙ Compa...
Observation of Gravitational Waves from the Coalescence of a 2.5–4.5 M⊙ Compa...
Sérgio Sacani
 
The SAMI Galaxy Sur v ey: galaxy spin is more strongly correlated with stella...
The SAMI Galaxy Sur v ey: galaxy spin is more strongly correlated with stella...The SAMI Galaxy Sur v ey: galaxy spin is more strongly correlated with stella...
The SAMI Galaxy Sur v ey: galaxy spin is more strongly correlated with stella...
Sérgio Sacani
 
Is Betelgeuse Really Rotating? Synthetic ALMA Observations of Large-scale Con...
Is Betelgeuse Really Rotating? Synthetic ALMA Observations of Large-scale Con...Is Betelgeuse Really Rotating? Synthetic ALMA Observations of Large-scale Con...
Is Betelgeuse Really Rotating? Synthetic ALMA Observations of Large-scale Con...
Sérgio Sacani
 
First Direct Imaging of a Kelvin–Helmholtz Instability by PSP/WISPR
First Direct Imaging of a Kelvin–Helmholtz Instability by PSP/WISPRFirst Direct Imaging of a Kelvin–Helmholtz Instability by PSP/WISPR
First Direct Imaging of a Kelvin–Helmholtz Instability by PSP/WISPR
Sérgio Sacani
 

Mehr von Sérgio Sacani (20)

TransientOffsetin14CAftertheCarringtonEventRecordedbyPolarTreeRings
TransientOffsetin14CAftertheCarringtonEventRecordedbyPolarTreeRingsTransientOffsetin14CAftertheCarringtonEventRecordedbyPolarTreeRings
TransientOffsetin14CAftertheCarringtonEventRecordedbyPolarTreeRings
 
Biogenic Sulfur Gases as Biosignatures on Temperate Sub-Neptune Waterworlds
Biogenic Sulfur Gases as Biosignatures on Temperate Sub-Neptune WaterworldsBiogenic Sulfur Gases as Biosignatures on Temperate Sub-Neptune Waterworlds
Biogenic Sulfur Gases as Biosignatures on Temperate Sub-Neptune Waterworlds
 
Asymmetry in the atmosphere of the ultra-hot Jupiter WASP-76 b
Asymmetry in the atmosphere of the ultra-hot Jupiter WASP-76 bAsymmetry in the atmosphere of the ultra-hot Jupiter WASP-76 b
Asymmetry in the atmosphere of the ultra-hot Jupiter WASP-76 b
 
Formation of low mass protostars and their circumstellar disks
Formation of low mass protostars and their circumstellar disksFormation of low mass protostars and their circumstellar disks
Formation of low mass protostars and their circumstellar disks
 
Nightside clouds and disequilibrium chemistry on the hot Jupiter WASP-43b
Nightside clouds and disequilibrium chemistry on the hot Jupiter WASP-43bNightside clouds and disequilibrium chemistry on the hot Jupiter WASP-43b
Nightside clouds and disequilibrium chemistry on the hot Jupiter WASP-43b
 
Discovery of an Accretion Streamer and a Slow Wide-angle Outflow around FUOri...
Discovery of an Accretion Streamer and a Slow Wide-angle Outflow around FUOri...Discovery of an Accretion Streamer and a Slow Wide-angle Outflow around FUOri...
Discovery of an Accretion Streamer and a Slow Wide-angle Outflow around FUOri...
 
Disentangling the origin of chemical differences using GHOST
Disentangling the origin of chemical differences using GHOSTDisentangling the origin of chemical differences using GHOST
Disentangling the origin of chemical differences using GHOST
 
All-domain Anomaly Resolution Office U.S. Department of Defense (U) Case: “Eg...
All-domain Anomaly Resolution Office U.S. Department of Defense (U) Case: “Eg...All-domain Anomaly Resolution Office U.S. Department of Defense (U) Case: “Eg...
All-domain Anomaly Resolution Office U.S. Department of Defense (U) Case: “Eg...
 
PossibleEoarcheanRecordsoftheGeomagneticFieldPreservedintheIsuaSupracrustalBe...
PossibleEoarcheanRecordsoftheGeomagneticFieldPreservedintheIsuaSupracrustalBe...PossibleEoarcheanRecordsoftheGeomagneticFieldPreservedintheIsuaSupracrustalBe...
PossibleEoarcheanRecordsoftheGeomagneticFieldPreservedintheIsuaSupracrustalBe...
 
Isotopic evidence of long-lived volcanism on Io
Isotopic evidence of long-lived volcanism on IoIsotopic evidence of long-lived volcanism on Io
Isotopic evidence of long-lived volcanism on Io
 
Hubble Asteroid Hunter III. Physical properties of newly found asteroids
Hubble Asteroid Hunter III. Physical properties of newly found asteroidsHubble Asteroid Hunter III. Physical properties of newly found asteroids
Hubble Asteroid Hunter III. Physical properties of newly found asteroids
 
Observational constraints on mergers creating magnetism in massive stars
Observational constraints on mergers creating magnetism in massive starsObservational constraints on mergers creating magnetism in massive stars
Observational constraints on mergers creating magnetism in massive stars
 
Observation of Gravitational Waves from the Coalescence of a 2.5–4.5 M⊙ Compa...
Observation of Gravitational Waves from the Coalescence of a 2.5–4.5 M⊙ Compa...Observation of Gravitational Waves from the Coalescence of a 2.5–4.5 M⊙ Compa...
Observation of Gravitational Waves from the Coalescence of a 2.5–4.5 M⊙ Compa...
 
The SAMI Galaxy Sur v ey: galaxy spin is more strongly correlated with stella...
The SAMI Galaxy Sur v ey: galaxy spin is more strongly correlated with stella...The SAMI Galaxy Sur v ey: galaxy spin is more strongly correlated with stella...
The SAMI Galaxy Sur v ey: galaxy spin is more strongly correlated with stella...
 
Is Betelgeuse Really Rotating? Synthetic ALMA Observations of Large-scale Con...
Is Betelgeuse Really Rotating? Synthetic ALMA Observations of Large-scale Con...Is Betelgeuse Really Rotating? Synthetic ALMA Observations of Large-scale Con...
Is Betelgeuse Really Rotating? Synthetic ALMA Observations of Large-scale Con...
 
First Direct Imaging of a Kelvin–Helmholtz Instability by PSP/WISPR
First Direct Imaging of a Kelvin–Helmholtz Instability by PSP/WISPRFirst Direct Imaging of a Kelvin–Helmholtz Instability by PSP/WISPR
First Direct Imaging of a Kelvin–Helmholtz Instability by PSP/WISPR
 
The Sun’s differential rotation is controlled by high- latitude baroclinicall...
The Sun’s differential rotation is controlled by high- latitude baroclinicall...The Sun’s differential rotation is controlled by high- latitude baroclinicall...
The Sun’s differential rotation is controlled by high- latitude baroclinicall...
 
Huygens - Exploring Titan A Mysterious World
Huygens - Exploring Titan A Mysterious WorldHuygens - Exploring Titan A Mysterious World
Huygens - Exploring Titan A Mysterious World
 
The Radcliffe Wave Of Milk Way is oscillating
The Radcliffe Wave Of Milk Way  is oscillatingThe Radcliffe Wave Of Milk Way  is oscillating
The Radcliffe Wave Of Milk Way is oscillating
 
Thermonuclear explosions on neutron stars reveal the speed of their jets
Thermonuclear explosions on neutron stars reveal the speed of their jetsThermonuclear explosions on neutron stars reveal the speed of their jets
Thermonuclear explosions on neutron stars reveal the speed of their jets
 

Kürzlich hochgeladen

The Mariana Trench remarkable geological features on Earth.pptx
The Mariana Trench remarkable geological features on Earth.pptxThe Mariana Trench remarkable geological features on Earth.pptx
The Mariana Trench remarkable geological features on Earth.pptx
seri bangash
 
development of diagnostic enzyme assay to detect leuser virus
development of diagnostic enzyme assay to detect leuser virusdevelopment of diagnostic enzyme assay to detect leuser virus
development of diagnostic enzyme assay to detect leuser virus
NazaninKarimi6
 
Conjugation, transduction and transformation
Conjugation, transduction and transformationConjugation, transduction and transformation
Conjugation, transduction and transformation
Areesha Ahmad
 
Pests of cotton_Borer_Pests_Binomics_Dr.UPR.pdf
Pests of cotton_Borer_Pests_Binomics_Dr.UPR.pdfPests of cotton_Borer_Pests_Binomics_Dr.UPR.pdf
Pests of cotton_Borer_Pests_Binomics_Dr.UPR.pdf
PirithiRaju
 
Module for Grade 9 for Asynchronous/Distance learning
Module for Grade 9 for Asynchronous/Distance learningModule for Grade 9 for Asynchronous/Distance learning
Module for Grade 9 for Asynchronous/Distance learning
levieagacer
 

Kürzlich hochgeladen (20)

The Mariana Trench remarkable geological features on Earth.pptx
The Mariana Trench remarkable geological features on Earth.pptxThe Mariana Trench remarkable geological features on Earth.pptx
The Mariana Trench remarkable geological features on Earth.pptx
 
pumpkin fruit fly, water melon fruit fly, cucumber fruit fly
pumpkin fruit fly, water melon fruit fly, cucumber fruit flypumpkin fruit fly, water melon fruit fly, cucumber fruit fly
pumpkin fruit fly, water melon fruit fly, cucumber fruit fly
 
Connaught Place, Delhi Call girls :8448380779 Model Escorts | 100% verified
Connaught Place, Delhi Call girls :8448380779 Model Escorts | 100% verifiedConnaught Place, Delhi Call girls :8448380779 Model Escorts | 100% verified
Connaught Place, Delhi Call girls :8448380779 Model Escorts | 100% verified
 
Forensic Biology & Its biological significance.pdf
Forensic Biology & Its biological significance.pdfForensic Biology & Its biological significance.pdf
Forensic Biology & Its biological significance.pdf
 
development of diagnostic enzyme assay to detect leuser virus
development of diagnostic enzyme assay to detect leuser virusdevelopment of diagnostic enzyme assay to detect leuser virus
development of diagnostic enzyme assay to detect leuser virus
 
GBSN - Microbiology (Unit 3)
GBSN - Microbiology (Unit 3)GBSN - Microbiology (Unit 3)
GBSN - Microbiology (Unit 3)
 
module for grade 9 for distance learning
module for grade 9 for distance learningmodule for grade 9 for distance learning
module for grade 9 for distance learning
 
Kochi ❤CALL GIRL 84099*07087 ❤CALL GIRLS IN Kochi ESCORT SERVICE❤CALL GIRL
Kochi ❤CALL GIRL 84099*07087 ❤CALL GIRLS IN Kochi ESCORT SERVICE❤CALL GIRLKochi ❤CALL GIRL 84099*07087 ❤CALL GIRLS IN Kochi ESCORT SERVICE❤CALL GIRL
Kochi ❤CALL GIRL 84099*07087 ❤CALL GIRLS IN Kochi ESCORT SERVICE❤CALL GIRL
 
Justdial Call Girls In Indirapuram, Ghaziabad, 8800357707 Escorts Service
Justdial Call Girls In Indirapuram, Ghaziabad, 8800357707 Escorts ServiceJustdial Call Girls In Indirapuram, Ghaziabad, 8800357707 Escorts Service
Justdial Call Girls In Indirapuram, Ghaziabad, 8800357707 Escorts Service
 
300003-World Science Day For Peace And Development.pptx
300003-World Science Day For Peace And Development.pptx300003-World Science Day For Peace And Development.pptx
300003-World Science Day For Peace And Development.pptx
 
Clean In Place(CIP).pptx .
Clean In Place(CIP).pptx                 .Clean In Place(CIP).pptx                 .
Clean In Place(CIP).pptx .
 
High Class Escorts in Hyderabad ₹7.5k Pick Up & Drop With Cash Payment 969456...
High Class Escorts in Hyderabad ₹7.5k Pick Up & Drop With Cash Payment 969456...High Class Escorts in Hyderabad ₹7.5k Pick Up & Drop With Cash Payment 969456...
High Class Escorts in Hyderabad ₹7.5k Pick Up & Drop With Cash Payment 969456...
 
Conjugation, transduction and transformation
Conjugation, transduction and transformationConjugation, transduction and transformation
Conjugation, transduction and transformation
 
Pests of cotton_Borer_Pests_Binomics_Dr.UPR.pdf
Pests of cotton_Borer_Pests_Binomics_Dr.UPR.pdfPests of cotton_Borer_Pests_Binomics_Dr.UPR.pdf
Pests of cotton_Borer_Pests_Binomics_Dr.UPR.pdf
 
Module for Grade 9 for Asynchronous/Distance learning
Module for Grade 9 for Asynchronous/Distance learningModule for Grade 9 for Asynchronous/Distance learning
Module for Grade 9 for Asynchronous/Distance learning
 
chemical bonding Essentials of Physical Chemistry2.pdf
chemical bonding Essentials of Physical Chemistry2.pdfchemical bonding Essentials of Physical Chemistry2.pdf
chemical bonding Essentials of Physical Chemistry2.pdf
 
Human & Veterinary Respiratory Physilogy_DR.E.Muralinath_Associate Professor....
Human & Veterinary Respiratory Physilogy_DR.E.Muralinath_Associate Professor....Human & Veterinary Respiratory Physilogy_DR.E.Muralinath_Associate Professor....
Human & Veterinary Respiratory Physilogy_DR.E.Muralinath_Associate Professor....
 
Pulmonary drug delivery system M.pharm -2nd sem P'ceutics
Pulmonary drug delivery system M.pharm -2nd sem P'ceuticsPulmonary drug delivery system M.pharm -2nd sem P'ceutics
Pulmonary drug delivery system M.pharm -2nd sem P'ceutics
 
Site Acceptance Test .
Site Acceptance Test                    .Site Acceptance Test                    .
Site Acceptance Test .
 
Call Girls Ahmedabad +917728919243 call me Independent Escort Service
Call Girls Ahmedabad +917728919243 call me Independent Escort ServiceCall Girls Ahmedabad +917728919243 call me Independent Escort Service
Call Girls Ahmedabad +917728919243 call me Independent Escort Service
 

Radio loud agn_are_mergers

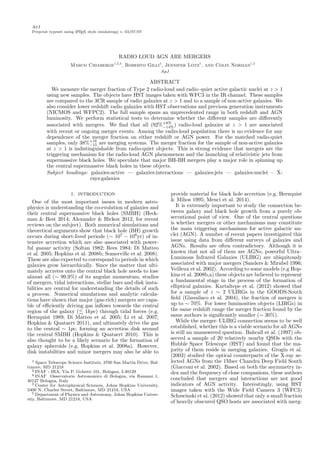
  • 1. ApJ Preprint typeset using LATEX style emulateapj v. 03/07/07 RADIO LOUD AGN ARE MERGERS Marco Chiaberge1,2,3 , Roberto Gilli4 , Jennifer Lotz1 , and Colin Norman1,5 ApJ ABSTRACT We measure the merger fraction of Type 2 radio-loud and radio–quiet active galactic nuclei at z > 1 using new samples. The objects have HST images taken with WFC3 in the IR channel. These samples are compared to the 3CR sample of radio galaxies at z > 1 and to a sample of non-active galaxies. We also consider lower redshift radio galaxies with HST observations and previous generation instruments (NICMOS and WFPC2). The full sample spans an unprecedented range in both redshift and AGN luminosity. We perform statistical tests to determine whether the different samples are differently associated with mergers. We find that all (92%+8% −14%) radio-loud galaxies at z > 1 are associated with recent or ongoing merger events. Among the radio-loud population there is no evidence for any dependence of the merger fraction on either redshift or AGN power. For the matched radio-quiet samples, only 38%+16 −15 are merging systems. The merger fraction for the sample of non-active galaxies at z > 1 is indistinguishable from radio-quiet objects. This is strong evidence that mergers are the triggering mechanism for the radio-loud AGN phenomenon and the launching of relativistic jets from supermassive black holes. We speculate that major BH-BH mergers play a major role in spinning up the central supermassive black holes in these objects. Subject headings: galaxies:active — galaxies:interactions — galaxies:jets — galaxies:nuclei – X- rays:galaxies 1. INTRODUCTION One of the most important issues in modern astro- physics is understanding the co-evolution of galaxies and their central supermassive black holes (SMBH) (Heck- man & Best 2014; Alexander & Hickox 2012, for recent reviews on the subject). Both numerical simulations and theoretical arguments show that black hole (BH) growth occurs during short-lived periods (∼ 107 − 108 yr) of in- tensive accretion which are also associated with power- ful quasar activity (Soltan 1982; Rees 1984; Di Matteo et al. 2005; Hopkins et al. 2008b; Somerville et al. 2008). These are also expected to correspond to periods in which galaxies grow hierarchically. Since the matter that ulti- mately accretes onto the central black hole needs to lose almost all (∼ 99.9%) of its angular momentum, studies of mergers, tidal interactions, stellar bars and disk insta- bilities are central for understanding the details of such a process. Numerical simulations and analytic calcula- tions have shown that major (gas-rich) mergers are capa- ble of efficiently driving gas inflows towards the central region of the galaxy ( 1kpc) through tidal forces (e.g. Hernquist 1989; Di Matteo et al. 2005; Li et al. 2007; Hopkins & Quataert 2011), and ultimately drive the gas to the central ∼ 1pc, forming an accretion disk around the central SMBH (Hopkins & Quataert 2010). This is also thought to be a likely scenario for the formation of galaxy spheroids (e.g. Hopkins et al. 2008a). However, disk instabilities and minor mergers may also be able to 1 Space Telescope Science Institute, 3700 San Martin Drive, Bal- timore, MD 21218 2 INAF - IRA, Via P. Gobetti 101, Bologna, I-40129 4 INAF Osservatorio Astronomico di Bologna, via Ranzani 1, 40127 Bologna, Italy 3 Center for Astrophysical Sciences, Johns Hopkins University, 3400 N. Charles Street, Baltimore, MD 21218, USA 5 Department of Physics and Astronomy, Johns Hopkins Univer- sity, Baltimore, MD 21218, USA provide material for black hole accretion (e.g. Hernquist & Mihos 1995; Menci et al. 2014). It is extremely important to study the connection be- tween galaxy and black hole growth from a purely ob- servational point of view. One of the central questions is whether mergers or other mechanisms may constitute the main triggering mechanisms for active galactic nu- clei (AGN). A number of recent papers investigated this issue using data from different surveys of galaxies and AGNs. Results are often contradictory. Although it is known that not all of them are AGNs, powerful Ultra– Luminous Infrared Galaxies (ULIRG) are ubiquitously associated with major mergers (Sanders & Mirabel 1996; Veilleux et al. 2002). According to some models (e.g Hop- kins et al. 2008b,a) these objects are believed to represent a fundamental stage in the process of the formation of elliptical galaxies. Kartaltepe et al. (2012) showed that for a sample of z ∼ 2 ULIRGs in the GOODS-South field (Giavalisco et al. 2004), the fraction of mergers is up to ∼ 70%. For lower luminosities objects (LIRGs) in the same redshift range the merger fraction found by the same authors is significantly smaller (∼ 30%). While the merger–ULIRG connection seems to be well established, whether this is a viable scenario for all AGNs is still an unanswered question. Bahcall et al. (1997) ob- served a sample of 20 relatively nearby QSOs with the Hubble Space Telescope (HST) and found that the ma- jority of them reside in merging galaxies. Grogin et al. (2003) studied the optical counterparts of the X-ray se- lected AGNs from the 1Msec Chandra Deep Field South (Giacconi et al. 2002). Based on both the asymmetry in- dex and the frequency of close companions, these authors concluded that mergers and interactions are not good indicators of AGN activity. Interestingly, using HST images taken with the Wide Field Camera 3 (WFC3) Schawinski et al. (2012) showed that only a small fraction of heavily obscured QSO hosts are associated with merg-
  • 2. 2 Chiaberge et al. ers. Treister et al. (2012) put together a relatively large sample of literature data and found clues for a luminosity dependence of the merger fraction in both ULIRGs and AGNs. On the other hand, Villforth et al. (2014) showed that their sample of QSOs observed with HST did not show any evidence for a dependence of the merger frac- tion on luminosity. Recently, based on a sample of SDSS galaxies, Sabater et al. (2015) found that the effect of interactions is minimal in triggering AGN activity. A major issue is related to the so-called radio- loud/radio-quiet dichotomy of active nuclei. It has been long argued that in order to produce powerful relativis- tic jets, radio-loud AGNs must possess an extra source of energy with respect to radio–quiet AGNs. The most popular scenarios among those proposed so far assume that the energy may be extracted from the innermost region of a magnetized accretion disk around a rapidly spinning black hole Blandford & Znajek (1977). In the Blandford-Znajek framework, the radio-quiet/radio-loud dichotomy can be explained in terms of a correspond- ing low/high black hole spin separation (Blandford et al. 1990). Alternative models predict that jets are directly powered by the accretion disk (Blandford & Payne 1982; Pudritz & Norman 1986; Xu et al. 1999). Both the- oretical arguments and observational evidence support the Blandford-Znajek scenario (see e.g. Ghisellini et al. 2014). Recent numerical simulations also seem to con- firm such a mechanism as a viable physical explanation for efficient jet production (e.g. Hawley & Krolik 2006; McKinney & Gammie 2004; Tchekhovskoy et al. 2011; S¸adowski et al. 2015). Wilson & Colbert (1995) origi- nally proposed that radio–loud AGNs are associated with rapidly spinning black holes that are ultimately spun-up by major BH-BH mergers. It is clear that a straightfor- ward prediction of such a scenario is that radio galaxies and radio-loud QSOs (RLQSOs) should exhibit signa- tures of major galaxy mergers. Radio–loud AGNs are known to be hosted by large el- liptical galaxies and are associated with SMBH of at least ∼ 108 M (e.g. Laor 2000; Dunlop et al. 2003; Best et al. 2005; Chiaberge & Marconi 2011). Furthermore, these objects are present in richer environments (clusters and groups of galaxies) than radio quiet AGNs (Shen et al. 2009; Donoso et al. 2010; Ramos Almeida et al. 2013) and they are often associated with brightest cluster galaxies (Best et al. 2007). At least a fraction of them have been known to be associated with merging system for a long time (e.g. Heckman et al. 1986; Colina & de Juan 1995). Recently, Ramos Almeida et al. (2012) studied samples of relatively low-redshift (z < 0.7) sources with deep ground based observations. These authors found that the large majority (∼ 80%) of radio-loud objects show disturbed morphologies. The same group also studied a small sam- ple of radio–quiet Type 2 quasars (Bessiere et al. 2012) and found that the merger fraction sample is as high as 75%. However, an accurate census of the merger fraction in carefully selected samples of AGNs over a large range of redshift, luminosity and radio–loudness is still needed to provide a final answer to the above questions. This should also be based on a homogeneous set of deep, high spatial resolution observations and supported by firm statistical evidence for any difference in the observed merger fractions amongst the different samples. The aim of this paper is to make a significant step towards such a goal. With the aim of determining the importance of merg- ers in triggering different types of AGN activity, we se- lect samples of both radio–loud and radio–quiet Type 2 AGN. In this paper we focus on Type 2 objects only, be- cause the bright nuclear component that dominates the emission on Type 1 AGNs (QSOs) hampers a detailed morphological study of both the host galaxies and the close environment of those objects. This constitutes a serious concern, particularly at moderate to high red- shifts, even using HST images. In this work we focus on objects with 1 < z < 2.5. This is a range of redshift where the peak of the AGN activity is believed to oc- cur, and where mergers play a dramatic role in the late evolution of massive galaxies (e.g. Hopkins et al. 2008b). The availability of HST data for a substantial number of objects in each sample is key to this work. In particular, we focus on samples observed with WFC3 and the IR channel. The extremely high sensitivity, low background level and the range of wavelengths covered by such an in- strument is particularly suitable to our goals. In fact, the rest frame wavelength corresponding to the most widely used WFC3–IR filters (i.e. F140W and F160W) is still well within the optical range for objects in the redshift range of our interest. Even in relatively short exposures (i.e. a few hundreds seconds, or less than 1 HST orbit) the effects of merger events on the structure of galaxies are clearly revealed in WFC3–IR images. This is possible thanks to the high sensitivity in the near IR coupled with the large field of view of WFC3, compared to previous generation instruments such as WFPC2, NICMOS and ACS. In Sect. 2 we describe the samples and the observations analyzed in this work, while in Sect. 3 we discuss our method to classify mergers based on visual inspection of the HST images. In Sect. 4 we describe the statistical analysis of the results. In Sect. 5 we discuss our findings and we outline our framework for their interpretation in Sect. 6. Finally, in Sect. 7 we summarize our results and we draw conclusions. Throughout the paper we assume ΩM = 0.3, Ωλ = 0.7 and H0 = 70 Km s−1 Mpc−1 . For the magnitude system, we use AB magnitudes. 2. THE SAMPLE One fundamental goal of this work is to establish whether there is a significant difference in the role played by mergers among different classes of AGNs and for dif- ferent bins of redshift and bolometric power. To this aim, we use well defined samples of classical radio galax- ies spanning 5 dex in radio power. We also select new samples of both radio quiet and radio loud AGNs, as well as non-active galaxies at z > 1. In doing so, we use par- ticular care in separating the radio quiet and radio loud populations, as explained below. In the following we describe the properties of each of the samples used as part of this work, together with the selection criteria used to derive new samples. 2.1. Radio loud AGNs: z > 1 3CR radio galaxies The first sample we consider is composed by the radio galaxies with z > 1 from the 3CR catalog (Spinrad et al. 1985). These are all powerful radio galaxies belonging
  • 3. RLAGN are mergers 3 to the Fanaroff–Riley class II (FR II Fanaroff & Riley 1974), i.e. those in which the brightest components of the radio structure lie at the edges of the radio source, in contrast to the FR Is, in which the peak of the radio emission is located at the core. The 3CR is a flux limited sample selected at low ra- dio frequencies (S178 > 9 Jy at 178MHz). Since the radio emission at such frequencies is dominated by the radio lobes, the selection is independent of the AGN orientation. The original catalog includes both Type 1 (QSOs) and Type 2 objects (radio galaxies) and it is one of the best studied samples of radio loud AGNs, be- ing perfectly suitable to test AGN unification scenarios. The high redshift objects included in the 3CR are all firmly established radio loud AGNs with powerful rel- ativistic jets emanating from the central supermassive black hole. Even at the lowest luminosities, the active nucleus is strongly radio loud (see e.g. Sikora et al. 2007; Chiaberge et al. 2005), assuming the canonical threshold R = F5GHz/FB > 10 (Kellermann et al. 1989), where F5GHz and FB are the fluxes in the radio band at 5 GHz and in the optical B band, respectively. The z > 1 sub- sample of the 3CR catalog includes 58 objects. The high- est redshift object is the radio galaxy 3C257 at z = 2.47. The radio power of these AGNs is L151 ∼ 1035 erg s−1 Hz−1 or slightly higher, which corresponds to a bolometric luminosity Lbol ∼ 1045−46 erg s−1 assum- ing standard bolometric corrections. This result is also supported by the estimates of the X-ray luminosity for some of these objects, which is typically in the range L2−10 ∼ 1044−45 erg s−1 . Salvati et al. (2008) observed a sample of the most luminous and most distant radio galaxies and QSOs from the 3CR catalog with XMM. They found that the intrinsic X-ray luminosity is in the range 6×1044 < L2−10keV < 2×1046 erg s−1 , the Type 1 QSOs being a factor of ∼ 6 or higher brighter than the (Type 2) radio galaxies. These authors interpreted such a discrepancy as a result of the presence of a beamed component in the Type 1 QSOs. Wilkes et al. (2013) found similar results based on Chandra data. Torresi et al. (priv. comm.) analyzed both Chandra and XMM archival data for the 3CR radio galaxies observed with HST, and found intrinsic X-ray luminosities as low as L2−10keV ∼ 2 × 1044 erg s−1 . However, the absorbing column density is poorly constrained, and it is possible that at least some of the Type 2 radio galaxies are in fact Compton-thick. In that case, the derived X-ray luminos- ity sets a lower limit to the intrinsic AGN luminosity in that band. Twelve 3CR radio galaxies were observed with WFC3– IR and the F140W filter (in addition to WFC3-UVIS and F606W, not used in this work) as part of program SNAP13023 (PI M. Chiaberge, Hilbert et al., in prepa- ration). The wide-band filter used for the HST obser- vations (F140W) includes emission lines at the redshift considered here (mainly Hα, Hβ and/or [OIII]5007, de- pending on the redshift of the source). However, the only object that is significantly contaminated by line emis- sion is 3C 230 (see Steinbring 2011). The HST image of this specific object only shows the narrow-line region and thus we cannot observe the stellar component of the host. Therefore we exclude this source from our sam- Fig. 1.— Radio loud samples considered in this paper. The horizontal line represents the canonical separation between low and high power radio galaxies (i.e. FR I and FR II, respectively). The color code identifies the different catalogs, and the shaded area show the regions of the radio luminosity v redshift plane where HST observations are suitable for this paper (see text). Here, the z< 0.3 range is covered by the 3CR sources (yellow), and the four groups that are part of the Willott sample (6C, 7C and TOOT are in red, blue and green, respectively plus the 3CR with z ∼ 0.5) cover the range around z=0.5. Both the low-z 3CR and the Willott sample are described in Sect. 4.1. The z > 1 range is covered again by the 3CR at high luminosity, and by the ECDFS HzLLRGs (purple) at the lowest luminosities. See Sect. 2 for more details. ple6 . HST snapshot surveys of complete samples are well suitable for statistical studies, since the observations are scheduled by randomly picking objects from the original target list to fill gaps in the HST schedule. The observed sample spans the entire range of redshift of the original list, i.e. from z = 1.0 to 2.47. The comparison samples described in the following are tailored to match the prop- erties of these 3CR galaxies, in either bolometric power or redshift range (or both). In Tab. 1 we report the data for the 11 sources belong- ing to this sample. The 24µm luminosities taken from Podigachoski et al. (2015) are used in the following to check that the relevant comparison sample is correctly matched to the Hz3C. In Fig. 1 we show the location of the 3CR sample in the radio power vs. redshift plane, with respect to other samples used throughout the paper. Note that, at any redshift, 3CR objects are always the most powerful radio sources. 6 A quick inspection of the images from the HST-SNAP13023 program shows that 3C 230 is the only object that presents an identical structure in both of the observed bands which is easily recognizable as due to emission line filaments. All other objects show, in the filter used in this work, a much smoother morphol- ogy that is not typical of emission line regions. The bandwidth of F140W is extremely wide (∼ 0.4µm), therefore the expected emission line contamination is small. In fact, for all radio galax- ies except for 3C 230, we estimate that, based on the observed emission line flux from ground based spectra, the total emission line contamination does not exceed 20% of the total observed flux (Hilbert et al., in preparation). Similar considerations hold for the other samples used in this work.
  • 4. 4 Chiaberge et al. 2.2. Radio loud AGNs: low-luminosity radio galaxies at 1 < z < 2.5 The sample of high redshift low-luminosity radio galax- ies (HzLLRGs) is derived from the Extended Chandra Deep Field South (ECDFS Lehmer et al. 2005). We use the Bonzini et al. (2012) catalog and AGN type classifi- cation to derive this sample. The criteria are as follows. i) The spectroscopic, if available, or photometric red- shift of the source must be in the range 1 < z < 2.5. The redshift range is chosen to roughly match the range spanned by the 3CR sample described above. ii) The total radio power at 1.4 GHz must be greater than P1.4GHz > 1030 erg s−1 Hz−1 and below the fiducial FRI/FRII separation P1.4GHz < 4 × 1032 erg s−1 Hz−1 (Fanaroff & Riley 1974). iii) The source must be classified as a radio loud AGN by Bonzini et al. (2013), i.e. it must show radio emis- sion in excess of that produced by starbursts. This is measured by using the q24obs parameter, defined as q24obs = log(S24obs/Sr), where S24obs is the observed flux density at 24µm and Sr is the observed flux density at 1.4GHz. Bonzini et al. (2013) define an object as radio loud if q24obs is 2σ off of the starburst locus, defined using the M82 template (see their Fig. 2). iv) We also impose the additional constraint that its X–ray luminosity must not exceed L2−10keV = 1044 erg s−1 . This is to ensure that the objects are consistent with typical low power radio galaxies at both low and high redshifts (e.g. Balmaverde et al. 2006; Tundo et al. 2012). The upper limit to the X–ray luminosity is also consistent with the results of Terashima & Wilson (2003). These authors showed that the radio loud – radio quiet dichotomy can be redefined using the X–ray emission in- stead of the flux in the optical band. This is particularly useful for Type 2 AGNs such as the ones considered in this work, since the optical emission form the accretion disk is heavily obscured in these object. According to such a scheme, powerful radio loud AGNs are present for RX −3.5, where RX is defined as the logarithm of the ratio between the radio luminosity (νLν) at 1.4GHz and the X-ray luminosity L2−10. At low radio powers, it is easy to confuse a powerful radio quiet AGN that shows some radio emission with a radio loud object that is intrinsically weak at all wavelengths. Note that our se- lection criteria for the radio and X-ray luminosities cor- respond to RX > −2.3, which is a rather conservative value. We prefer to follow a conservative approach be- cause for low luminosity AGNs the transition between radio–quiet and radio–loud most likely occurs at higher values than for high power objects, similarly to the classi- cal radio–loudness parameter R derived using the radio- to-optical luminosity ratio (Terashima & Wilson 2003; Chiaberge et al. 2005; Sikora et al. 2007). v) The source must be observed with HST WFC3–IR. Most of the images are taken from the CANDELS survey (Koekemoer et al. 2011; Grogin et al. 2011), or from sur- rounding fields observed as part of program GO-12866 (see Table 2). The ECDF sample includes 6 HzLLRGs. We also use the same criteria to select HzLLRG in the CANDELS UDS field in the Subaru/XMM Newton Deep field survey (SXDF, Ueda et al. 2008). The radio data are from (Simpson et al. 2012), the 24µm Spitzer IR data are taken from the Spitzer Public Legacy Survey of the UKIDSS Ultra Deep Survey (SpUDS, P.I. J.S. Dunlop) using the IRSA database. Only two galaxies that satisfy our selection criteria lie in the region covered by the HST WFC3 observations. The properties of the 8 galaxies included in the HzLLRG sample are reported in Table 2. In Fig. 1 we show the radio power vs. redshift distribution of these AGNs, compared with the other radio loud sam- ples. Note that the two radio loud samples at z > 1 used in this paper (i.e. the 3CR and the HzLLRGs) are separated by about 4dex in radio power, on average. 2.3. Radio quiet AGNs: low-power Type 2 AGNs at 1 < z < 2.5 The sample of low-power Type 2 AGN (LPTy2AGN) is selected from the 4Msec CDFS catalog and source clas- sification (Xue et al. 2011). We include objects that are classified as AGNs, that do not show strong broad emis- sion lines in the optical spectrum, and whose redshift is 1.0 < z < 2.5. We also use the additional constraint that the intrinsic (de-absorbed) X-ray luminosity (inte- grated between 2 and 10 keV, in the rest frame of the source) must be L2−10keV < 2 × 1042 erg s−1 , in order to be consistent with the properties of the corresponding radio loud sample described in Sect. 2.2. The L2−10keV luminosity is derived from the 0.5-8keV luminosity listed in the catalog, converted to the 2-10keV band using a photon index Γ = 1.8. Furthermore, for the objects that are detected in the radio, we require that the X- ray radio loudness parameter RX defined in Sect. 2.2 is < −3.5. The sample includes 26 objects. These are very low power AGNs that are similar to Seyfert 2 galaxies in the local Universe. The properties of these AGNs are re- ported in Tables 3. The HST/WFC3-IR images for this sample are taken from the CANDELS survey (Koeke- moer et al. 2011; Grogin et al. 2011). 2.4. Radio quiet AGNs: high-power Type 2 AGNs at 1 < z < 2.5 As for the low power AGNs described above, the sam- ple of high-power Type 2 AGN (HPTy2AGN) is drawn from the CDFS. When selecting this sample we want to match as close as possible both the redshift range and the bolometric luminosity of the powerful 3CR radio galaxy sample. The sample of high-power Type 2 AGNs includes ob- jects classified as AGN with redshift 1 < z < 2.5 and intrinsic X-ray luminosity L2−10keV > 1044 erg s−1 . The lower limit in X-ray power is chosen to match the prop- erties of the 3CR sample described in Sect. 2.1. Two of the objects (166 and 577) show relatively broad MgII and CIII] emission lines in the optical spectrum (Szokoly et al. 2004). However, the HST images clearly show the host galaxy and there is no evidence for the presence of any strong unresolved nuclear source, as it would be ex- pected for a powerful Type 1 QSO. Therefore, for the purpose of this work, we consider those two objects as Type 2, regardless of the presence of broad lines. As for the LPTy2AGN, for the objects that are de- tected in the radio, we require that the X-ray radio loud- ness parameter RX defined in Sect. 2.2 is < −3.5. This sample includes 9 AGNs (see Table 4). The HST/WFC3- IR images for this sample are taken from the CANDELS survey (Koekemoer et al. 2011; Grogin et al. 2011).
  • 5. RLAGN are mergers 5 TABLE 1 High z 3CR Radio Galaxies Name R.A. (2000.0) Decl. (2000.0) Redshift log P1.4GHz L24µm hh:mm:ss.ss dd:mm:ss.ss z log[erg s−1 Hz−1] log[erg s−1 Hz−1] 3C 210 08:58:10.0 +27:50:52 1.169 35.13 45.65 3C 255 11:19:25.2 –03:02:52 1.355 35.29 <44.54 3C 257 11:23:09.2 +05:30:19 2.474 35.94 45.94 3C 297 14:17:24.0 –04:00:48 1.406 35.33 44.84 3C 300.1 14:28:31.3 –01:24:08 1.159 35.37 – 3C 305.1 14:47:09.5 +76:56:22 1.132 35.10 45.36 3C 322 15:35:01.2 +55:36:53 1.168 35.20 44.90 3C 324 15:49:48.9 +21:25:38 1.206 35.34 45.48 3C 326.1 15:56:10.1 +20:04:20 1.825 35.75 45.64 3C 356 17:24:19.0 +50:57:40 1.079 34.96a 45.52 3C 454.1 22:50:32.9 +71:29:19 1.841 35.60 45.67 Note. — S1.4 from Condon et al. (1998) except for a Laing & Peacock (1980). The 24µm luminosities are derived from the fluxes published in Podigachoski et al. (2015). TABLE 2 High z Low Luminosity Radio Galaxies ID R.A. (2000.0) Decl. (2000.0) Redshift HST Survey or Prog. ID log P1.4GHz log L2−10 q24 hh:mm:ss.ss dd:mm:ss.ss z log[erg s−1 Hz−1] log[erg s−1] ECDFS 65 03:31:23.30 -27:49:05.80 1.10a 12866 31.85 <42.56 -1.54 127 03:31:34.13 -27:55:44.40 1.06 12866 30.51 <42.69 -0.09 215 03:31:50.74 -27:53:52.15 1.77 12866 31.13 <42.69 -0.46 338 03:32:10.79 -27:46:27.80 1.61b CANDELS 31.29 42.43 -0.98 410 03:32:19.30 -27:52:19.38 1.10b CANDELS 30.37 <42.27 -0.23 412 03:32:19.51 -27:52:17.69 1.06 CANDELS 30.93 <42.24 -0.51 UDS 48 02 18 18.38 -05 15 45.2 1.56 CANDELS 32.27 <43.93 0.09 124 02 17 04.77 -05 15 18.1 1.28b CANDELS 31.54 <43.73 -0.50 Note. — For the ECDFS sources the ID corresponds to the source ID in the Bonzini et al. (2012) catalog. For the UDS galaxies, the ID is the Simpson et al. (2012) source number. Redshifts are photometric redshifts from Bonzini et al. (2012), except where stated otherwise. The UDS sources are undetected in the X-rays. a Photometric redshift from Cardamone et al. (2010) b Spectroscopic redshift Since the X-ray luminosity might be poorly con- strained because of the uncertainty on the amount of nuclear obscuration, we should also make sure that this sample and the Hz3Cs have similar mid-IR luminosities. We performed a K-S test to check whether the distribu- tions of 24µm luminosity of the Hz3C and HPTy2AGN are different7 . The resulting p-value is p=0.1, therefore we cannot reject the null hypothesis that the two distri- butions are drawn from the same population. 2.5. Non-active galaxies at 1 < z < 2.5 This sample is derived from the 3D–HST survey of the GOODS–SOUTH field (Giavalisco et al. 2004; Brammer et al. 2012; Skelton et al. 2014). We select galaxies with spectroscopic redshift 1 < z < 2.5 and with magnitude in the F140W filter 19 < mF 140W < 22. The magnitude range is chosen to match the magnitudes of the 3CR ra- dio galaxies from Sect. 2.1 (Hilbert et al., in prep.). The full sample includes 145 galaxies. We limit the sample to the 50 objects included in the southern half area of 7 Note that we did not perform the same test for the LPTy2AGN because those are all undetected at 24µm. the field observed with WFC3-IR and the F140W filter as part of the 3D-HST survey. Five of these objects are AGNs, therefore we are left with a sample of 45 galaxies. These are sufficient to provide us a statistically sound sample to be compared with the active galaxy samples described above. We refer to this sample as the bright sample of non-active galaxies. Note that we could in principle derive a larger sample by using the full area covered by the 3D–HST image of the GOODS-S field. However, this would not significantly improve the statis- tics for a sample that is already the largest we consider. In the same area of the sky, we also select a compara- ble sample of fainter galaxies (22 < mKs < 24) from the same HST survey. This sample spans the same magni- tude range as the bulk of our radio–quiet AGN popula- tion. In the following, we will refer to this sample as the faint galaxies sample. Even if we are selecting objects in the very same red- shift range, the near-IR (rest-frame optical) magnitude might not be a good tracer of the stellar mass because of the possible presence of obscuration in some objects. We do not believe that this might significantly affect our results. However, in order to perform a sanity check,
  • 6. 6 Chiaberge et al. TABLE 3 Radio Quiet Low Power Ty2 AGN at 1 < z < 2.5 ID R.A. Decl. Redshift log L2−10 hh:mm:ss.s dd:mm:ss.s z log[erg s−1] Low Power Type 2 AGN (CDFS) 125 03:32:06.77 -27:49:14.10 1.050 42.04 147 03:32:09.22 -27:51:43.50 1.352 41.99 216 03:32:15.26 -27:44:38.60 1.109 41.70 225 03:32:15.91 -27:48:02.20 1.520 41.90 226 03:32:16.04 -27:48:59.90 1.413 41.91 247 03:32:17.84 -27:52:10.80 1.760 42.15 317 03:32:23.16 -27:45:55.00 1.224 42.25 318 03:32:23.17 -27:44:41.60 1.571 42.09 321 03:32:23.61 -27:46:01.40 1.033 41.98 376 03:32:27.04 -27:53:18.60 1.103 41.88 389 03:32:28.62 -27:45:57.20 1.626 41.97 394 03:32:28.85 -27:47:56.00 1.383 41.89 416 03:32:29.94 -27:52:52.80 1.017 41.76 419 03:32:30.05 -27:50:26.80 1.005 41.48 428 03:32:31.11 -27:49:40.00 1.508 41.79 455 03:32:33.06 -27:48:07.80 1.188 41.75 462 03:32:33.67 -27:47:51.20 1.388 41.84 463 03:32:33.84 -27:46:00.60 1.903 42.09 491 03:32:35.80 -27:47:35.10 1.223 42.13 493 03:32:35.98 -27:48:50.70 1.309 42.19 504 03:32:36.35 -27:49:33.40 1.508 41.81 536 03:32:39.07 -27:53:14.80 1.380 41.98 541 03:32:39.42 -27:53:12.70 1.381 42.00 545 03:32:39.65 -27:47:09.60 1.317 41.88 558 03:32:41.01 -27:51:53.40 1.476 42.19 579 03:32:43.45 -27:49:02.20 1.603 41.97 Note. — The ID corresponds to the source ID in the Xue et al. (2011) catalog. The redshifts (zadopt in the Xue et al. catalog) are spectroscopic, if available, or photometric. The intrinsic X-ray luminosities (converted to the 2-10keV band as explained in the text) are also from Xue et al. (2011). we also select a sample of non-active galaxies in the full GOODS-S area of 3D–HST matched to the stellar mass estimates of the Hz3C galaxies. At 1 < z < 2.5 these are typically between 1 × 10¹¹ and 5 × 10¹¹ M (Seymour et al. 2007), although a small number of lower mass ob- jects are also present. Although stellar mass measure- ments based on SED fitting heavily rely on models, it is important to check that our non-active galaxy samples are correctly representing the population of objects we need for comparison. If we restrict our range of masses between the above values, and after excluding those that are AGNs, we obtain 23 objects. About half of them are in common with the bright sample. While we do not consider this as our main control sample of non-active galaxies, results for this sample are briefly discussed in Sect. 4, for the sake of completeness. The HST/WFC3-IR images are taken as part of the 3DHST survey with the F140W filter. 3. MERGER FRACTION In order to measure the merger fraction we use at least four human classifiers for each sample. For the Hz3C and the Ty2 AGN samples we used six classifiers, to be sure that the authors of the paper were not biased a priori towards any specific result. Each classifier visually inspects all of the targets. While being qualitative in nature, visual classification has been proven to be an effective way of classify mergers, since the eye can pick all of the different signatures of such events. On the other hand, quantitative methods using the Gini coefficient G, the concentration index C, the asymmetry index A, or the second-order moment of the brightest 20 per cent of the light (M20) only select particular mergers that each of the above indicators are able to identify (Lotz et al. 2011). Therefore, if we use any of those methods we would derive smaller merger fractions. We classify objects as mergers (or post-mergers) if clear signatures of a mergers are present. These include the presence of double/multiple nuclei, close pairs, tidal tails, bridges, or distorted morphologies clearly indicating a recent or ongoing merger. Close pairs are defined using a projected separation of less than 25kpc between the center of the galaxies involved, corresponding to 3 arcsec in the redshift range spanned by our z > 1 samples8 . Such a scale is similar to the typical separations observed in galaxy pairs at low redshifts (e.g. Smith & Heckman 1989; Behroozi et al. 2015)9 . When possible, mergers are also visually distinguished between major and minor, assuming the usual separation at a ∼ 4:1 mass/apparent brightness ratio (e.g. Lotz et al. 2011). If there is no clear evidence for any of the above properties, we classify the object as a non-merger. For the AGN samples, a blind classification is performed, i.e. classifiers did not know whether each object was radio- loud or radio-quiet, and if it belonged to the high or low- power class. Classifiers are also asked to classify objects more than once (typically twice). While substantial agreement exists between the differ- ent classifiers for most of the objects, different people may see different features in each image, thus the classi- fication for single sources may differ. This is why we do not report the merger classification for each galaxy in the tables. In order to reduce the effects of large deviations among the different classifiers we calculate 10%-trimmed means for each sample10 . We report the results for each of the samples at z > 1 in Tab. 5. Examples of the morphologies observed in the differ- ent samples are given in Figs. 2, 3, and 4. In order to avoid confusion between our merger classification crite- ria, we use the figures to give a few specific examples. 3C 297 and 3C356 in Fig. 2 are both classified as merg- ers based on those clear signatures of interaction. 3C 297 also shows a double nucleus. Although not all cases are as straightforward as these, similar considerations can be made for objects in the other samples (see e.g. the sys- tems shown in the right panes of both Figs. 3 and 4). In 8 Between z=1 and z=2.5 the projected scale varies by less than 0.1 arcsec. 9 Note that the definitions of “double nucleus” and “close pair” are only formally different. For the purposes of our work, these objects are in fact the same. The different names only identify the appearance of the object in the image, since our classification is based on visual inspection. We classify the object as a double (or multiple) nucleus if the two objects are not clearly separated and they appear to lie within a common envelope. If the galaxies are well separated, but their nuclei are less than ∼ 25kpc apart, then we call it a close pair. However, it is important to note that all of these objects are required to display evidence of bridges or asymmetries to be classified as mergers. 10 Trimmed (or truncated) means are robust estimators of cen- tral tendency, and it is less sensitive on the outliers than the mean. Trimmed means are derived by calculating the mean after discard- ing parts at the high and low ends of a probability distribution. In our case, the distribution is defined by the number of mergers ob- tained for each sample by each of the classifiers, and we reject 10% at both ends. Note that a 50% trimmed mean would correspond to the median.
  • 7. RLAGN are mergers 7 TABLE 4 Radio Quiet High Power Ty2 AGN at 1 < z < 2.5 ID R.A. Decl. Redshift log L2−10 log L24µm hh.mm.ss.s dd.mm.ss.s z log[erg s−1] log[erg s−1] 166 03:32:10.93 -27:44:15.20 1.605 44.21 44.81 243 03:32:17.19 -27:52:21.00 1.097 44.05 44.39 257 03:32:18.35 -27:50:55.61 1.536 44.07 44.30 278 03:32:20.07 -27:44:47.51 1.897 44.06 45.04 351 03:32:25.70 -27:43:06.00 2.291 44.31 45.46 518 03:32:37.77 -27:52:12.61 1.603 44.23 45.38 577 03:32:43.24 -27:49:14.50 1.920 44.12 44.70 713 03:33:05.90 -27:46:50.70 2.202 44.02 – 720 03:33:07.64 -27:51:27.30 1.609 44.39 – Note. — The ID corresponds to the source ID in the Xue et al. (2011) catalog. The redshifts (zadopt in the Xue et al. catalog) are spectroscopic, if available, or photometric. The intrinsic X-ray luminosities (converted to the 2-10keV band as explained in the text) are also from Xue et al. (2011). The 24µm luminosities are from Cardamone et al. (2008). Fig. 2.— RGB images of four radio galaxies from the high-z 3CR sample showing clear evidence for recent or ongoing major merger. The objects are (from left to right, top to bottom) 3C 210, 3C297, 3C356 and 3C454.1. The HST WFC3-IR F140W image was used for the R channel. The WFC3-UVIS F606W image was used for both the G and B channels. North is up, East is left. Data from Hilbert et al. (in preparation) particular, the objects shown in Fig. 3 are most likely ex- amples of dry mergers in which the galaxy isophotes are highly asymmetric (see e.g. Bell et al. 2006). The central panels of Fig. 4 show objects that some of the classifiers classified as mergers, while others did not. Those that classified the objects as mergers noticed some asymme- tries in the isophotes of the galaxies, in addition to the presence of small companions. The observed merger fraction in the radio-loud samples (Hz3C and HzLLRG) are clearly larger than those found for radio-quiet and non-active galaxies. In Sect. 4, we test this result using careful statistical analysis. 3.1. On the impact of different sensitivities on the merger classification TABLE 5 Observed Merger Fractions (trimmed means) for the z > 1 samples Sample Sample Size Merger Fraction Hz3C 11 100% HzLLRG 8 88% LPTy2AGN 26 38% HPTy2AGN 9 33% Bright Galaxies 45 27% Faint Galaxies 46 20% RL (3C + LLRG) 19 95% RQ (HP+LPTy2AGN) 35 37% The goal of this work is to identify merging systems in samples of objects that were observed as part of dif-
  • 8. 8 Chiaberge et al. Fig. 3.— Four examples of the morphologies observed among the z > 1 radio quiet AGNs. In the top panels, we show two LPTy2AGNs. A non-merger and a merger are shown on the left and on the right, respectively. In the bottom panels, the same is shown for two HPTy2AGNs. The circles are 6 arcsec radius, which correspond to ∼ 50 kpc at the redshift of the objects. Images are from CANDELS (Koekemoer et al. 2011; Grogin et al. 2011, HST/WFC3/F160W). ferent surveys or observing programs. All of the images were taken using the WFC3-IR camera. Its extremely high sensitivity and spatial resolution allows us to detect low surface brightness features that characterize recent merger events at z ∼ 1 − 2 even in short (1 orbit or less) observations. However, for the sake of clarity, we report in Table 6 the 5σ surface brightness limits for the dif- ferent surveys we use. To derive the limits we used the WFC3-IR Exposure Time Calculator (ETC). We assume a 2x2 pixel extraction area and a spectrum of an ellipti- cal galaxy with a UV upturn to perform the conversion between F160W (used for the CANDELS observations) and F140W magnitudes. Although the CANDELS deep images we used for the radio quiet samples and for the HzLLRGs are deeper than all other data, we checked that the merger classification is not different if the shal- lower 3D-HST images are considered. The images show the very same features, irrespective of the redshift of the source. The faintest tidal structures are less prominent in the shallower images, but that does not significantly affect our classification. The short exposure times of the 3C snapshot survey are also sufficient to detect the faint features we are interested in, in the range of redshift of our sample, as shown by the fact that that sample has the greater observed merger fraction. 4. STATISTICAL ANALYSIS The main goal of this work is to investigate if mergers are associated with AGN activity and if that plays a role in triggering such a phenomenon. Most importantly, we want to test whether different classes of AGNs (e.g. radio quiet vs. radio loud, low vs high bolometric luminosity) are more likely to be triggered by merger than others. We also test the hypothesis that AGNs are no different than non-active galaxies. We perform a set of statistical tests to compare the derived merger fractions for the five different samples described in Sect. 2. Throughout the paper, statistical tests are performed using different techniques in the R environment (R Core Team 2014). We use the Bayesian version of the proportion test us- ing bayes.prop.test, as part of the Bayesian First Aid package for R (B˚a˚ath 2014). In principle, Bayesian tests are more useful than classical proportion tests, since they provide an estimate of the relative frequency of suc- cess (e.g. Bolstad 2007). In this simplified version of the Bayesian tests, the priors are uninformative, i.e. a uniform distribution. This is suitable for our purposes, since we have no a priori knowledge of the distribution of mergers in each sample11 . In table 7 we list the relative frequencies of success for each sample, together with the 95% credible intervals. By testing each sample against each of the others, we can firmly establish that the Hz3C has a larger merger fraction than both of the Ty2AGN samples (P> 99.9%). The Hz3C merger fraction is also larger than that of the non-active galaxies (both bright and faint samples, P> 99.9%). Furthermore, the HzLLRGs are significantly more associated with mergers than the non-active galax- ies (P> 99.9). All other tests are inconclusive12 . How- ever, these are very important results. Furthermore, if we merge the two samples of z > 1 radio loud objects and we test them against the radio quiet AGNs, the result is extremely robust. The merger fraction in our sample of radio–loud AGNs is significantly higher than that in the radio–quiet sample. This is again a notable result, since the (Bayesian) merger fractions for the RL and RQ sample are 92% and 38%, respec- tively. As expected, the same result holds (with an even higher statistical significance) for the RL sample against the non–active (both bright and faint) galaxies, while the RQ sample does not show any statistically significant difference with respect to the non-active galaxies. It is particularly important to note the results for the samples that are matched in magnitude. On the one hand, the RL and the bright galaxy sample are different, and on the other hand, the RQ and the faint galaxy sample are statistically indistinguishable. As a sanity check, to avoid possible biases from a se- lection made using near-IR magnitudes, we also used the smaller sample of high-mass non-active galaxies (see Sect. 2.5). In particular, given that we measure a merger fraction of 30%+19% −17%, the high-mass sample is statisti- cally different from the Hz3C, with a Bayesian probabil- ity > 99.9%. On the other hand, the merger fraction in such a sample is statistically indistinguishable from those in both the faint and the bright samples of non- active galaxies. Finally, we wish to point out that among the sam- ples of radio-loud AGNs at z > 1 the large majority of the objects (∼ 90%) appear to be associated with major mergers. On the other hand, for radio quiet AGNs at z > 1, only ∼ 50% of the observed mergers are major mergers. Note that this is only based on our qualitative 11 We also perform a complete set of classical proportion tests using the R task prop.test. For these classical tests we reject the null hypothesis that the merger fractions in two samples are the same if the p-value is p < 0.01. Not surprisingly, the results are perfectly in agreement with the Bayesian relative frequencies. For the sake of clarity, here we only discuss in details the Bayesian results. 12 For a 2-sample proportion test in classical statistics this means that we cannot reject the null hypothesis that the observed merger fractions in two samples are the same (p-value < 0.01). For our Bayesian treatment, this implies that the probability that one sam- ple has a higher (or lower) merger fraction than the other is less than 99%.
  • 9. RLAGN are mergers 9 Fig. 4.— Six examples of non–active galaxies from our z > 1 sample. Both in the top and bottom rows, objects that are unanimously classified as non-mergers or mergers are shown in the left and right panels, respectively. Objects with mixed classification are shown in the middle panels. The circles are 6 arcsec radius, which correspond to ∼ 50 kpc at the redshift of the objects. Images are from 3D-HST (Giavalisco et al. 2004; Brammer et al. 2012; Skelton et al. 2014, HST/WFC3/F140W) TABLE 6 Surface brightness limits Survey or HST Prog. ID Sample HST Camera/Filter 5σ Surface Brightness Limit Sensitivity µF140W [ABmag arcsec−2] AB mag SNAP-13023 Hz3C WFC3/F140W 23.9 25.8 CANDELS wide RQ and HzLLRG WFC3/F160W 24.1 26.5 CANDELS deep RQ and HzLLRG WFC3/F160W 25.6 27.2 3D-HST non-active WFC3/F140W 24.1 26.2 GO-12866 HzLLRG WFC3/F160W 25.0 26.7 Low-z Samples GO-9045 3CRR,6C,7C,TOOT WFPC2/F785LP 20.7 24.9 SNAP-10173 3CR (z< 0.3) NICMOS/NIC2/F160W 22.5 24.3 Note. — The 5σ limits are estimated using the WFC3-IR ETC and assuming a 2x2 pixel extraction region. In column 4 we report the limit surface brightness for each datasets, converted to the WFC3-IR F140W filter to allow for an easy comparison between the different surveys. An elliptical galaxy spectrum with UV upturn redshifted to the appropriate redshift for each sample was used for the conversion between the two WFC3 filters. RQ in the samples column refers to both the LP and HPTy2AGN samples. For the low redshift samples (GO9045 and SNAP10173) we used synphot to convert magnitudes to the WFC3 filter system. In column 5 we report the 5σ image sensitivities calculated for point sources in each of the bands used for the observations. visual classification of the mergers. A more careful clas- sification would require 2-D galaxy modeling and SEDs to derive stellar mass estimates for the galaxies involved in each merger, which is beyond the goals of this work. 4.1. Lower redshift samples of radio loud AGNs One important goal of this work is to establish whether the merger fraction for radio-loud AGN depends on ei- ther redshift or luminosity. In order to test if that is the case, we used additional lower redshift samples, for comparison with the z > 1 data. McLure et al. (2004) observed a sample of 41 inter- mediate (z∼ 0.5) radio galaxies with HST and WFPC2 (GO 9045, P.I. Willott). The sample is taken from four different complete catalogs, spanning about 4 dex in ra- TABLE 7 Estimated Bayesian probabilities for the z > 1 samples. Sample Merger Fraction 95% Credible Interval Hz3C 94% 0.78 - 1.00 HzLLRG 82% 0.57 - 0.99 LPTy2AGN 39% 0.22 - 0.57 HPTy2AGN 36% 0.11 - 0.64 Bright Galaxies 27% 0.15 - 0.40 Faint Galaxies 20% 0.10 - 0.33 RL (3C + LLRG) 92% 0.78 - 1.00 RQ (HP+LPTy2AGN) 38% 0.23 - 0.54 dio power. The four catalogs are all complete, flux lim- ited and radio selected at low frequencies. The sam-
  • 10. 10 Chiaberge et al. TABLE 8 Estimated Bayesian probabilities for the z < 1 radio loud AGN samples. Sample Size Merger Fraction 95% Credible Interval Willott Samples 3CRR 13 74% 0.53 - 0.94 6CE 7 68% 0.38 - 0.93 7CRS 9 65% 0.37 - 0.89 TOOT 12 65% 0.39 - 0.87 Full Sample 41 70% 0.56 - 0.83 Low Redshift Radio galaxies z < 0.3 3CR 101 88% 0.81 - 0.94 ple includes objects from the 3CRR, 6CE, 7CRS and the TexOx-1000 (TOOT sample, hereinafter) (McLure et al. 2004, and references therein). The redshift range spanned by the objects observed with WFPC2 is between z = 0.40 and 0.59. We will refer to these galaxies as the Willott sample throughout the paper. For these objects, we retrieved the HST data from the MAST and we reduced them using Astrodrizzle (Fruchter et al. 2012). We then classify the objects between merg- ers and non-mergers, since no classification was provided in the original paper by McLure et al. (2004), and for consistency with the other samples. Note that the filter used for these observations (F785LP) provides images at ∼ 5300˚A in the rest frame. This is similar to the rest frame wavelength of the WFC3-IR observations for the z > 1 samples described above. In Tab. 8 we report the merger fractions for this sample. The merger fractions are statistically compatible with those for the radio-loud samples at higher redshifts. At even lower redshifts, we use the observations of the 3CR sample with z < 0.3 taken with HST-NICMOS (program SNAP10173) and the F160W filter (Madrid et al. 2006). Although these observations are in the rest- frame IR, they are better suitable for our purposes than the optical data of the same sample taken with WFPC2 (de Koff et al. 1996; Martel et al. 1999) because the NIC- MOS images are significantly deeper. For this sample, we consider the results published by Floyd et al. (2008). These authors classified all of the objects in mergers, pre- mergers, tidal-tails, major and minor companions. The field of view covered by NIC2 is 19.2 × 19.2 , which corresponds to 50x50 kpc2 at the median redshift of the sample. They found that 89 out of 101 objects fall into at least one of these categories. This corresponds to a merger fraction of 0.88, with a Bayesian 95% credible in- terval [0.81–0.94]. If we exclude objects with only minor companions (i.e. 1 mag fainter than the radio galaxy host, as defined by Floyd at al., 2008), the fraction is reduced to 0.76 with a Bayesian 95% credible interval [0.68–0.84]. Since the observations are not homogeneous, these two lower redshift samples are only considered here for com- parison. However, we do not base our conclusions on these samples only. 5. DISCUSSION The main result of this work is that the samples of ra- dio quiet and radio loud Type 2 AGNs at 1 < z < 2.5 have different merger fractions. We showed that there is clear statistical evidence that the radio loud AGNs al- most always reside in environments where mergers are undergoing, or that recently happened. As discussed below, this is independent of the radio (or bolometric) power of the AGN, and it is statistically compatible with merger fractions as high as ∼ 100%. The sample with the highest observed merger fraction is the z > 1 3CR. In principle, this sample could be bi- ased, since HST only imaged ∼ 35% of the radio galaxies with z > 1 included in the 3CR catalog. However, it is important to note that the observations were performed as part of an HST SNAPSHOT program. In SNAP pro- grams, targets are randomly selected based on the avail- ability of gaps in the HST schedule. Therefore, there was no a priori knowledge of the properties of the ob- served targets with respect to the complete sample. But since the observed sample is small, it is still possible that we ended up picking a large number of objects in merg- ers only by chance. In the following we briefly discuss such an issue. For example, we could in principle as- sume that the original population is composed by ∼50% of mergers and 50% of non-mergers, similarly to what is observed in our sample of non-active galaxies. We can test the probability of obtaining a sample of 12 merg- ers, randomly extracted from the complete sample of 34 radio galaxies included in the 3CR catalog with z > 1. The selection of the 3CR catalog only covered part of the sky (Decl. > −10 deg). Therefore, we should cor- rect for the area coverage to obtain the total number of radio sources (i.e. 58 radio galaxies). The binomial probability of obtaining 12 mergers out of 12 observed is extremely small (P = 2 × 10⁻⁴ ). However, when objects are randomly drawn from a sample without replacement, the Hypergeometric distribution must be used instead of the binomial. In that case, the probability of obtain- ing 12 mergers out of 12 observed, from a population of 58 objects in which 50% of the objects are mergers is P = 5.8 × 10⁻⁵ . Note that if the merger fraction in the complete sample is higher than 72%, then the (hypergeo- metric) probability of obtaining 12 mergers is P > 0.01. Since that corresponds to the significance level we set for all of the statistical tests, we can state that we can- not completely rule out that the merger fraction in the 3CR is as low as ∼ 72%. Interestingly, this is similar to the lower value of the credible interval given by the Bayesian analysis for this sample (see Tab. 7). The only other selection bias that might affect our sample is the Eddington (1913) bias. However, that would have the effect of lowering the actual number of sources in our sample, and that in turn would lower the probability of the hypergeometric distribution. Therefore, we conclude that even if the number of 3CR galaxies observed at z > 1 is small, the probability that the observed merger fraction is overestimated because of any selection bias is extremely small. 5.1. Radio loud samples: no trends with redshift and luminosity In this section we discuss the results we obtained for the different radio loud samples. It is in fact particu- larly interesting to investigate whether the merger frac- tion in these object may depend on e.g. redshift, lumi- nosity, or on the original criteria for each sample selec-
  • 11. RLAGN are mergers 11 Fig. 5.— Left: merger fraction vs. redshift for the samples of radio loud and radio quiet AGN, and for non-active galaxies. The coordinates of the filled dots are the median redshift of each sample, and the Bayesian merger probability. The errorbars show the range of redshift spanned by each sample and the Bayesian 95% credible intervals for the merger probability. The High-z radio–loud sample (green dot) corresponds to the 3CR at z > 1 merged with the HzLLRG sample to improve the statistics. The radio-quiet Ty2 AGN samples at z > 1 are also merged (light red). The bright and faint samples of non active galaxies are plotted in yellow and cyan. The Willott sample (3CR, 6CE, 7CRS and TOOT samples at z ∼ 0.5) is in red. The blue dot represents the 3CR sample with z < 0.3. Right: merger fraction vs. radio luminosity at 151MHz for the radio loud samples. In this panel, the Willott samples (here marked as TOOT, 6C, 7C and 3C) and the high-z radio-loud samples (Hz3CR and HzLLRG) are plotted separately. The color code is the same as for the left panel. tion. However, while the statistical analysis clearly shows that radio loud objects are almost all associated with mergers, one important caveat is that the samples are small. This is particularly true for the radio-loud sam- ples (except for the low-z 3CR), but also for the high-z radio-quiet comparison sample. Unfortunately, this pre- vents us from drawing statistically firm conclusions on any possible trends between the different samples of ra- dio galaxies. For example, we cannot determine whether the HzLLRG’s are less likely to be associated with merg- ers than the Hz3C’s even if the observed fraction is lower in the former than in the latter. Similarly, we cannot determine whether each of the samples at z ∼ 0.5 that compose the Willott sample behave differently, for exam- ple as a result of their different radio power. However, it is interesting to consider radio-loud sam- ples grouped by redshift bin. We can thus compare the merger fractions for the low-z 3CR, the whole Willott sample (TOOT+7CRS+6CE+3CRR), and the high-z objects (3CR+HzLLRG). In Sect. 4 we showed that we find no statistical evidence that that the observed merger fractions are different for any of those groups. Therefore, while we wish to stress that this does not imply that they are the same, we can conclude that the data show no ev- idence for a redshift evolution. By comparing the 95% Bayesian credible intervals, we can also conclude that the merger fractions do not differ by more than ∼ 20%. Since the samples are well separated in radio luminos- ity, it is straightforward to perform a similar analysis for samples grouped by radio luminosity, and conclude that the merger fraction in low and high-power samples does not differ by more than 20%. This is a notable result, since these samples are separated by more than 4 dex in radio power, and span a wide range of redshift (see Fig.1). In Fig.5 we show the Bayesian 95% credible inter- vals for each of the groups of radio loud objects plot- ted against the redshift (left panel) and radio luminos- ity (right panel) range spanned by each group. In the left panel (merger fraction vs redshift) we also include the radio-quiet AGNs and the two samples of non-active galaxies. The radio-quiet AGNs and the non–active galaxies are not plotted in the right panel, since any trends with the radio power would be irrelevant. In fact, the origin of radio emission in radio-quiet AGN is still de- bated, as it could be either thermal or non-thermal, and a possible contribution from starbursts could not be ex- cluded at the lowest luminosities. Starbursts are instead the most likely origin for the radio emission in non-active galaxies. These objects would lie on the bottom-left of the figure in the right panel, but any correlation with the merger fraction would be meaningless. As it is clear from the figure (left panel), the only group of radio loud AGNs that is still marginally compatible with the ra- dio quiet samples is the Willott sample. However, this might be due to the fact that the images were taken with WFPC2, which was significantly less sensitive than WFC3-IR. In Tab. 6 we report the limit magnitude es- timated using the WFPC2 Exposure Time Calculator, and converted to the F140W filter using synphot to al- low an easier comparison with the WFC3 observations. The value mF 140w = 20.7 mag arcsec−2 was derived us- ing an elliptical galaxy spectrum redshifted to z=0.5. As a result of that, some images might not show faint sur- face brightness structures such as e.g. asymmetries or tidal tails, which might lead us to misclassify some of the objects as non-mergers. Deeper images with WFC3 or with ACS in the I band should be taken in order to
  • 12. 12 Chiaberge et al. achieve a more reliable estimate of the merger fraction in the Willott sample. The right panel of Fig. 5 shows the merger fraction for each sample, against radio power at 151MHz13 . Here we plot the Willott samples separately, since they belong to different luminosity bins. The low-z 3CR span a large range in radio power. Most of these 3CR objects are confined to the lower luminosity bin, as it is clear from Fig. 1. As noted above, except for the low-z 3CR for which the merger fraction is much better constrained, the number statistics is small and the error on the merger fraction is large. However the figure clearly shows that all of the samples are located in the upper part up the diagram, and that no trend with radio power is visible. Finally, in Fig. 6 we show the merger fraction against the radio loudness parameter RX. In order to represent the average value of RX for each sample, we calculated average values for both the radio and the X-ray lumi- nosities (see the caption for references). The data are very uncertain, since the information is extremely sparse. This especially holds for the X-ray data of the Hz3C and the Willott sample, while most of the HzLLRG only have upper limits in the X-ray band, so the radio loudness of the HzLLRGs is represented as a lower limit. Note that ∼ 20% of the radio-quiet objects are detected in the ra- dio band. The value of Rx for the radio-quiet samples is thus calculated using the average radio luminosity for the detected objects, and the points in the figure are shown as upper limits for the radio loudness parameter. For all other samples, to be safe, we assume uncertainties up to ∼ ±0.5dex in RX. This is reasonable considering the uncertainties in the X-ray luminosity and the range of radio and X-ray luminosity spanned by the objects. This plot summarizes the main result of this work, i.e. that radio quiet sources are systematically associ- ated to smaller merger fractions (and they are located in the lower-left side of the figure), while radio loud AGN are unambiguously associated with mergers (and they are located in the upper-right side of the figure). 5.2. Comparison with other recent results Our results basically agree with the findings of Ramos Almeida et al. (2012) and Ramos Almeida et al. (2013). Those studies focus on samples of relatively low-redshift (z < 0.7) sources with deep ground based observations. These authors found that the large majority (∼ 80%) of radio-loud objects show disturbed morphologies, and they also reside in dense environments. However, the parameter space covered by those papers is limited to luminous low-redshift objects, while our work spans a significantly larger range both in redshift and luminos- ity. The same group also studied a sample of 20 Type 2 quasars (Bessiere et al. 2012) that includes at least two RLQSOs, based on their location in the L5GHz v L[OIII] plane (Xu et al. 1999). As expected in light of our results, both RLQSOs are associated with mergers. The merger fraction in the full sample is as high as 75%. If we only exclude those two sources that exceed their definition of radio-loudness, the observed merger fraction among the remaining radio-quiet objects is still quite large (72%). 13 Measurements at radio frequencies different form 151MHz were converted to the reference wavelength using a spectral index α = 0.8 and Fν ∝ ν−α. Fig. 6.— Merger fraction vs. average radio loudness parameter RX for the different AGN samples. Filled symbols are the radio loud samples, empty symbols are radio quiet. The Hz3C sam- ple is plotted as a circle, the HzLLRG is the square (lower limit), Willott’s 3CRR is the triangle, and the low-z 3CR is the pentagon. For the radio quiet samples (empty symbols) the LPTy2AGN sample is the triangle, and the HPTy2AGN is the square. The dashed line represents the radio loudness threshold for PG QSOs (Terashima & Wilson 2003). The solid line marks the 60% merger fraction that appears to roughly separate radio–loud and radio– quiet samples. Color code is the same as for Fig. 5 While this might appear in disagreement with our mea- sured fraction for the RQAGNs, the uncertainty on the value found by these authors is large, as a result of the small number statistics (13 possible mergers out of 18 ob- jects). Since the samples are small, we cannot reject the null hypothesis that a 72% merger fraction for that sam- ple is different from the fraction measured in our sample of RQAGNs. One of the major points here is that we showed that there is no evidence for a trend with luminosity, at least for the radio loud samples. This is apparently at odds with the results of Treister et al. (2012), where only the most powerful samples appear to predominantly reside in merging systems. However, it is interesting to briefly discuss their work in the light of our results. Two sam- ples show a significantly greater merger fraction than any other samples treated in that work. Those are the sample of dust-reddened Type 1 QSOs of Urrutia et al. (2008) and the Bahcall et al. (1997) sample of Type 1 QSOs. The former is most likely biased in favor of a high merger fraction, because of the nature of those obscured quasars. The latter, instead, is more interesting. Of the 20 QSOs observed with HST by Bahcall et al. (1997), 14 are radio quiet and 6 are radio loud. All of the 6 RLQSOs are ap- parently merging or show irregular features that might be explained with a merger, in agreement with our re- sults. Thus if we only limit the analysis to the RQQSOs, the fraction of mergers is ∼ 50%, in agreement with our findings. Therefore, we argue that the high fraction of mergers in the full Bahcall sample (65%) could in princi- ple be explained, in light of our results, by the fact that a significant fraction of the objects are radio loud.
  • 13. RLAGN are mergers 13 6. IMPLICATIONS FOR THE ORIGIN OF RADIO-LOUDNESS Our results show that radio galaxies are unambigu- ously associated with mergers, independently of redshift and luminosity, while radio-quiet AGN at z > 1 are in- distinguishable from normal galaxies in the same red- shift range. This result may have profound implications for our understanding of the mechanisms that enable the production of powerful relativistic jets from supermassive BHs. In fact, such a strong connection between mergers and radio loud AGNs may be a clue for a direct link between these two phenomena. The central question here is whether mergers may pro- vide, or at least substantially contribute to the physical conditions that ultimately enable the formation of jets in RLAGNs. 6.1. Not all mergers may generate a RLAGN First of all, we should point out that most mergers do not generate a RLAGN. This is clear from the fact that a fraction of non-active galaxies at z > 1 are seen to be merging, but they show no signs of radio-loud activity. If there is an association between these two phenomena, it is not a univocal cause/effect relationship. Based on our results, the same also holds for radio-quiet AGNs since a fraction of those are associated with mergers. Thus, we conclude that mergers are unrelated to radio-quiet AGNs or, alternatively, only a fraction of those may be triggered by mergers. However, it is worth noting that our defini- tion of merger includes objects that still have to merge as well as objects for which the signs of a past merger are somehow still visible. Therefore, the timescale dur- ing which we observe a merger is probably of the order of at least ∼ 1-2 Gyr (e.g Di Matteo et al. 2005). The time scale for radio loud activity is most likely significantly shorter (∼ 107 − 108 yr) . Therefore, we cannot exclude that some of the non-active galaxies that we observe in a merger phase are turned-off radio loud AGNs, or, alter- natively, they still have to be turned-on. Summarizing, we believe that not all mergers may directly generate a radio-loud AGN. Below we discuss a few possible condi- tions for a merger to trigger RLAGN activity. 6.2. Conditions for mergers to trigger RLAGNs We argue that when certain conditions are met, merg- ers may trigger radio loud nuclear activity. What we ultimately wish to know is what those conditions are. An important piece of information here is that the asso- ciation between mergers and RLAGNs is robustly estab- lished at all redshifts. While both recent simulations and observations show that the galaxies merger rate increases with redshift (e.g. Hopkins et al. 2006; Conselice et al. 2003; Lotz et al. 2011; Rodriguez-Gomez et al. 2015), our results show that there is no evidence that the merger fraction for RLAGN is higher at higher z. Of course, this should be confirmed through the analysis of larger sam- ples that may better constrain the merger fractions and highlight any possible trends with redshift. But even if the uncertainties remain large with the present samples, the existence of such a tight relationship between the two phenomena means that somehow a RLAGN needs a merger (at all redshifts) in order to manifest itself. The predominance of major mergers among our radio loud samples (at least at z > 1) that is apparent from vi- sual inspection needs to be confirmed through a more quantitative analysis. However, this may imply that one of the conditions that must be met in order to trigger a RLAGN is that the merger needs to be between two galaxies (and thus between two BHs) of similar mass. It is well known that radio galaxies are ubiquitously asso- ciated with very massive hosts ( 1010−11 M , e.g. Best et al. 2005) and high-mass SMBH ( 108 M Laor 2000; Chiaberge & Marconi 2011; Dunlop et al. 2003; Best & Heckman 2012). Therefore, we expect those major merg- ers to involve high mass objects only. 6.3. How do mergers affect the central supermassive black holes? Understanding the details of this issue is central to our future work on the subject, but it is beyond the scope of this paper. However, we can build on our results and speculate on a possible scenario. One of the effects of mergers is to lower the specific angular momentum of the gas in the galaxy, and thus to drive the gas towards the center (e.g. Hernquist 1989; Hopkins & Quataert 2011). While this may naturally happen in gas rich mergers, as those observed in our high-z 3CR sample (e.g. Barthel et al. 2012; Tadhunter et al. 2014; Podigachoski et al. 2015), the hosts of low redshift radio galaxies (in partic- ular those of low radio powers) are often relatively gas– poor systems. Therefore, this effect may play a role at higher redshifts, but it is very unlikely to be the ultimate cause of radio loud activity in general. Furthermore, tidal effects happen in all mergers, thus merger events should affect both RQ and RL AGNs at the same level, contrary to our results. Another effect of mergers is to alter the spin and the mass of the central black hole. That can be achieved in two ways, i.e. either via accretion, or via BH-BH merger (e.g. Volonteri et al. 2013). The former implies that a large amount of gas is driven toward the central region of the galaxy, for a significant amount of time. If the accretion of matter is coherent, i.e. if the flow of matter occurs at a fixed angular momentum axis, that ultimate leads to spinning-up the black hole. On the other hand, if accretion results from multiple merger events that drive the matter towards the black hole from different direc- tions, the BH is spinned-down. In any case, as already pointed out above, the expected amount of gas in major mergers (at least at low redshifts) is probably too small to alter the BH spin significantly in these objects. In the case of BH-BH merger, the two BH coalesce and the resulting object has increased mass and, in most cases, a lower spin per unit mass. But there are scenar- ios in which those events lead to the opposite result. For example, it has been shown that a single major BH-BH merger, where the ratio between the masses of the two involved BHs approaches unity, may generate a spinning BH, even if the two merging black hole are initially not spinning (Hughes & Blandford 2003; Baker et al. 2006; Li et al. 2010; Giacomazzo et al. 2012; Schnittman 2013, for a recent review). However, current simulations are unable to reproduce BH with dimensionless spin param- eter greater than ∼ 0.94 as a result of BH-BH mergers alone (Hemberger et al. 2013). 6.4. The role of rapidly spinning black holes
  • 14. 14 Chiaberge et al. According to the so-called spin paradigm (Wilson & Colbert 1995; Blandford et al. 1990), radio loud AGNs are associated with rapidly spinning black holes, while BHs in radio quiet AGN are expected to spin less rapidly. Those major mergers that result in rapidly spinning black holes may provide the link between our observa- tions and the physics behind the RLAGN phenomenon as a whole. Clearly, the objects that we are seeing in a pre-merger phase, or the very few ones that are associ- ated with a minor merger, do not fit the above scheme. In those cases, we must assume that another major merger event happened in the recent past. This does not seem unreasonable, since all of these objects lie in over-dense environments, but it should be proven by finding the sig- natures of that previous merger. In a framework in which BHs are spun up by major BH-BH mergers, we expect a range of resulting spin val- ues. Therefore, it is possible that different radio mor- phologies (and radio powers) are associated with differ- ent BH spin levels. For example, only the BHs that spin more rapidly might be able to produce the most rela- tivistic jets, in a framework in which the jet is powered by energy extracted from the rotating black hole (e.g. Blandford & Znajek 1977; McKinney et al. 2012; Ghis- ellini et al. 2014). Such a scenario has been explored for X-ray binaries jets, so far leading to contrasting re- sults (e.g. Gardner & Done 2014; Narayan & McClin- tock 2012; Fender et al. 2010; Russell et al. 2013). It is interesting to note that Fanidakis et al. (2011) were able to reproduce the RL and RQ AGN populations in the context of galaxy evolution. Their model is based on a scheme that includes a bimodal BH spin distribu- tion mainly caused by the the combination of accretion of matter onto the black hole and by the different type of mergers that galaxies of different stellar mass undergo. As pointed out in the previous section, black holes could also be spun-up by merger-triggered accretion. Such a mechanism could in principle account for our ob- servations of mergers at z > 1, but only if those are gas- rich mergers. However, it would not completely explain the origin of radio-loud activity in low redshift, gas-poor galaxies (see also the discussion in the next Section). 6.5. Low redshift radio loud AGNs A scenario in which BH-BH mergers are directly im- plied in triggering radio loud AGN activity seems to be supported by the observed properties of low-redshift RLAGN hosts. Capetti & Balmaverde (2006); de Ruiter et al. (2005) showed that all radio loud AGNs in their samples are hosted by core-galaxies, i.e. galaxies that show a flat radial brightness profile in the central regions. While this analysis is clearly limited to very low redshifts (z 0.1), where the core radius can be resolved in HST images, and to objects that are not affected by signifi- cant amounts of dust in the central kiloparsecs, it very clearly shows that there is a strong connection between the presence of a core profile and RL activity. Interest- ingly, one of the most likely explanations for the presence of core profiles is related to a major BH-BH mergers, in which the binary BH formed during the merger ejects stars from the central regions before the two BHs coa- lesce (e.g. Graham 2004; Merritt 2006). While the direct physical connection between such a phenomenon and ra- dio loud activity is still a matter of debate (see e.g. Chi- aberge & Marconi 2011), it provides one more piece of evidence that major mergers and radio loud AGNs are strictly connected. 7. CONCLUSIONS We derived the merger fraction in samples of z > 1 Type 2 RLAGN, Type 2 RQAGN, and non- active galax- ies. We establish that the RLAGN are unambiguously associated with mergers (92%+8% −14%), while only 38%+16 −15 of the RQAGN show evidence for a merger. Non- active galaxies are statistically indistinguishable from the RQAGNs. The comparison with lower redshift samples shows that there is no evidence for the fraction of mergers in RLAGNs to be dependent on either redshift or AGN luminosity. Mergers are directly involved in triggering radio-loud activity at all redshifts. We speculate that the galaxy mergers we observe at z > 1 are responsible for spinning up central black holes possibly through mergers of high- mass BHs. It will be extremely important to study the BH mass distribution in samples of merging galaxies of different type and to determine whether the BH mass and the merger types are related to different type of activity. Not all galaxy mergers in our RL samples appear the same to visual inspection. It would be important to firmly assess the ratio between major and minor mergers at different redshifts, and radio power. The images in this work show that a larger fraction of objects are in a phase of ongoing- or post-major merger in higher red- shift samples than in the lower redshift counterparts (see also Floyd et al. 2008). The different HST cameras used not only sample different rest-frame wavelengths (near- IR at low-z and optical at z > 0.4), but they also have significantly different sensitivities. It is extremely hard to detect post-merger signatures such as e.g. faint tidal tails in the intermediate redshift samples imaged with WFPC2. Those features may lie outside the field of view in the NICMOS images at low redshift. The only redshift range that is covered with homogeneous observations is between z=1 and 2.5. Clearly needed is a homogeneous data set observed with HST-WFC3 or ACS at all red- shifts. Detailed studies of the mergers in our radio-loud sam- ples using integral field spectroscopy, combined with deep high resolution imaging in the rest frame IR , should be used to study the kinematics of the mergers and mea- sure a range of parameters such as dynamical masses and angular momenta. The imaging part of the project is feasible with WFC3, although at high redshifts the rest frame wavelengths sampled by such a camera are still within the optical bands. Dust obscuration may re- duce the accuracy of the stellar mass measurements. ALMA observations can trace the molecular gas in- volved in the mergers. It is important to study a large sample of these sources at different redshifts, to test whether different amounts of gas are driven towards the central supermassive black holes and whether that may affect the type of radio loud nuclear activity A compari- son with the mergers observed in radio-quiet AGNs and in ULIRGs will elucidate the black hole feeding mecha- nism in all of these sources, and relationships with AGN activity. This work is limited to Type 2 AGNs because in Type 1
  • 15. RLAGN are mergers 15 AGNs the nuclear light from the central QSO hampers morphological studies of the host galaxy. With a better knowledge of the WFC3 PSF, such a study is possible starting with the sample of 3CR QSOs at z > 1. Better results can be achieved using coronographic observations by Martel et al. (2003). While the coronographic mode is now available on HST only in STIS, JWST with NIRISS will allow us to image QSOs spanning a broader range of redshift. We hope to be able to study in detail both the structure and fueling mechanisms in Type 1 objects (see e.g. Ford et al. 2014). In conclusion, our results clearly establish that RLAGNs are mergers. Conversely, based on the sam- ples studied in this paper, we did not find any statistical evidence that RQAGNs are related to merger events. 8. ACKNOWLEDGMENTS The authors wish to thank G. Zamorani, C. O’Dea, S. Baum and A. Capetti for insightful comments and sug- gestions. We acknowledge W. B. Sparks and the HST- 3CR collaboration for making the images of the z > 1 3C radio galaxies available for this work. We are also in- debted to M. Stiavelli and A. Mortazavi for helping out with the mergers classification. We are also greatful to the anonymous referee for his/her helpful comments that greatly improved the pa- per. This research has made use of the NASA/IPAC In- frared Science Archive, which is operated by the Jet Propulsion Laboratory, California Institute of Technol- ogy, under contract with the National Aeronautics and Space Administration. This work is based on observa- tions taken by the CANDELS Multi-Cycle Treasury Pro- gram with the NASA/ESA HST, which is operated by the Association of Universities for Research in Astron- omy, Inc., under NASA contract NAS5-26555. This work is based on observations taken by the 3D-HST Treasury Program (GO 12177 and 12328) with the NASA/ESA HST. Based on observations made with the NASA/ESA Hubble Space Telescope, obtained from the Data Archive at the Space Telescope Science Institute, which is oper- ated by the Association of Universities for Research in Astronomy, Inc., under NASA contract NAS 5-26555. REFERENCES Alexander, D. M., & Hickox, R. C. 2012, New Astronomy Review, 56, 93 B˚a˚ath, R. 2014, in UseR! 2014 - the International R User Conference Bahcall, J. N., Kirhakos, S., Saxe, D. H., & Schneider, D. P. 1997, ApJ, 479, 642 Baker, J. G., Centrella, J., Choi, D.-I., Koppitz, M., & van Meter, J. 2006, Phys. Rev. D, 73, 104002 Balmaverde, B., Capetti, A., & Grandi, P. 2006, A&A, 451, 35 Barthel, P., Haas, M., Leipski, C., & Wilkes, B. 2012, ApJ, 757, L26 Bell, E. F., Naab, T., McIntosh, D. H., et al. 2006, ApJ, 640, 241 Behroozi, P. S., Zhu, G., Ferguson, H. C., et al. 2015, arXiv:1502.01342 Bessiere, P. S., Tadhunter, C. N., Ramos Almeida, C., & Villar Mart´ın, M. 2012, MNRAS, 426, 276 Best, P. N., & Heckman, T. M. 2012, MNRAS, 421, 1569 Best, P. N., Kauffmann, G., Heckman, et al. 2005, MNRAS, 362, 25 Best, P. N., von der Linden, A., Kauffmann, G., Heckman, T. M., & Kaiser, C. R. 2007, MNRAS, 379, 894 Blandford, R. D., Netzer, H., Woltjer, L., Courvoisier, T. J.-L., & Mayor, M. 1990, Active Galactic Nuclei (Saas-Fee Advanced Course 20. Lecture Notes 1990. Swiss Society for Astrophysics and Astronomy, XII, 280 pp. 97 figs.. Springer-Verlag Berlin Heidelberg New York) Blandford, R. D., & Payne, D. G. 1982, MNRAS, 199, 883 Blandford, R. D., & Znajek, R. L. 1977, MNRAS, 179, 433 Bolstad, W. M. 2007, Introduction to Bayesian Statistics, 2nd Edition (Wiley) Bonzini, M., Mainieri, V., Padovani, P., et al. 2012, ApJS, 203, 15 Bonzini, M., Padovani, P., Mainieri, V., et al. 2013, MNRAS, 436, 3759 Brammer, G. B., van Dokkum, P. G., Franx, M., et al.. 2012, ApJS, 200, 13 Capetti, A., & Balmaverde, B. 2006, A&A, 453, 27 Cardamone, C. N., Urry, C. M., Damen, M., et al. 2008, ApJ, 680, 130 Cardamone, C. N., van Dokkum, P. G., Urry, C. M., et al. 2010, ApJS, 189, 270 Chiaberge, M., Capetti, A., & Macchetto, F. D. 2005, ApJ, 625, 716 Chiaberge, M., & Marconi, A. 2011, MNRAS, 416, 917 Colina, L., & de Juan, L. 1995, ApJ, 448, 548 Condon, J. J., Cotton, W. D., Greisen, E. W., et al. 1998, AJ, 115, 1693 Conselice, C. J., Bershady, M. A., Dickinson, M., & Papovich, C. 2003, AJ, 126, 1183 de Koff, S., Baum, S. A., Sparks, W. B., et al. 1996, ApJS, 107, 621 De Lucia, G., & Blaizot, J. 2007, MNRAS, 375, 2 de Ruiter, H. R., Parma, P., Capetti, A., et al. 2005, A&A, 439, 487 Di Matteo, T., Springel, V., & Hernquist, L. 2005, Nature, 433, 604 Donoso, E., Li, C., Kauffmann, G., Best, P. N., & Heckman, T. M. 2010, MNRAS, 407, 1078 Dunlop, J. S., McLure, R. J., Kukula, M. J., et al. 2003, MNRAS, 340, 1095 Eddington, A. S. 1913, MNRAS, 73, 359 Fanaroff, B. L., & Riley, J. M. 1974, MNRAS, 167, 31P Fanidakis, N., Baugh, C. M., Benson, A. J., et al. 2011, MNRAS, 410, 53 Fender, R. P., Gallo, E., & Russell, D. 2010, MNRAS, 406, 1425 Floyd, D. J. E., Axon, D., Baum, S., et al. 2008, ApJS, 177, 148 Ford, K. E. S., McKernan, B., Sivaramakrishnan, A., et al. 2014, ApJ, 783, 73 Fruchter, A. S., Hack, W., Dencheva, N., et al. 2012, in American Astronomical Society Meeting Abstracts, Vol. 219, American Astronomical Society Meeting Abstracts #219, #145.15 Gardner, E., & Done, C. 2014, MNRAS, 438, 779 Ghisellini, G., Tavecchio, F., Maraschi, L., Celotti, A., & Sbarrato, T. 2014, Nature, 515, 376 Giacconi, R., Zirm, A., Wang, J., et al. 2002, ApJS, 139, 369 Giacomazzo, B., Baker, J. G., Miller, M. C., Reynolds, C. S., & van Meter, J. R. 2012, ApJ, 752, L15 Giavalisco, M., Ferguson, H. C., Koekemoer, A. M., et al. 2004, ApJ, 600, L93 Graham, A. W. 2004, ApJ, 613, L33 Grogin, N. A., Kocevski, D. D., Faber, S. M., et al. 2011, ApJS, 197, 35 Grogin, N. A., Koekemoer, A. M., Schreier, E. J., et al. 2003, ApJ, 595, 685 Hawley, J. F., & Krolik, J. H. 2006, ApJ, 641, 103 Heckman, T. M., & Best, P. N. 2014, ARA&A, 52, 589 Heckman, T. M., Smith, E. P., Baum, S. A., et al. 1986, ApJ, 311, 526 Hemberger, D. A., Lovelace, G., Loredo, T. J., et al. 2013, Phys. Rev. D, 88, 064014 Hernquist, L. 1989, Nature, 340, 687 Hernquist, L., & Mihos, J. C. 1995, ApJ, 448, 41 Hopkins, P. F., Cox, T. J., Kereˇs, D., & Hernquist, L. 2008a, ApJS, 175, 390 Hopkins, P. F., Hernquist, L., Cox, T. J., & Kereˇs, D. 2008b, ApJS, 175, 356 Hopkins, P. F., & Quataert, E. 2010, MNRAS, 407, 1529
  • 16. 16 Chiaberge et al. —. 2011, MNRAS, 415, 1027 Hopkins, P. F., Somerville, R. S., Hernquist, L., et al. 2006, ApJ, 652, 864 Hughes, S. A., & Blandford, R. D. 2003, ApJ, 585, L101 Kartaltepe, J. S., Dickinson, M., Alexander, D. M., et al. 2012, ApJ, 757, 23 Kellermann, K. I., Sramek, R., Schmidt, M., Shaffer, D. B., & Green, R. 1989, AJ, 98, 1195 Koekemoer, A. M., Faber, S. M., Ferguson, H. C., et al. 2011, ApJS, 197, 36 Laing, R. A., & Peacock, J. A. 1980, MNRAS, 190, 903 Laor, A. 2000, ApJ, 543, L111 Lehmer, B. D., Brandt, W. N., Alexander, D. M., et al. 2005, ApJS, 161, 21 Li, Y., Hernquist, L., Robertson, B., et al. 2007, ApJ, 665, 187 Li, Y.-R., Wang, J.-M., Yuan, Y.-F., Hu, C., & Zhang, S. 2010, ApJ, 710, 878 Lotz, J. M., Jonsson, P., Cox, T. J., et al. 2011, ApJ, 742, 103 Madrid, J. P., Chiaberge, M., Floyd, D., et al. 2006, ApJS, 164, 307 Martel, A. R., Baum, S. A., Sparks, W. B., et al. 1999, ApJS, 122, 81 Martel, A. R., Ford, H. C., Tran, H. D., et al. 2003, AJ, 125, 2964 McKinney, J. C., & Gammie, C. F. 2004, ApJ, 611, 977 McKinney, J. C., Tchekhovskoy, A., & Blandford, R. D. 2012, MNRAS, 423, 3083 McLure, R. J., Willott, C. J., Jarvis, M. J., et al. 2004, MNRAS, 351, 347 Menci, N., Gatti, M., Fiore, F., & Lamastra, A. 2014, A&A, 569, A37 Merritt, D. 1985, ApJ, 289, 18 Merritt, D. 2006, ApJ, 648, 976 Narayan, R., & McClintock, J. E. 2012, MNRAS, 419, L69 Ostriker, J. P., & Tremaine, S. D. 1975, ApJ, 202, L113 Podigachoski, P., Barthel, P. D., Haas, M., et al. 2015, ArXiv e- prints:1501.01434 Pudritz, R. E., & Norman, C. A. 1986, ApJ, 301, 571 R Core Team. 2014, R: A Language and Environment for Statistical Computing, R Foundation for Statistical Computing, Vienna, Austria Ramos Almeida, C., Bessiere, P. S., Tadhunter, C. N., et al. 2013, MNRAS, 436, 997 Ramos Almeida, C., Bessiere, P. S., Tadhunter, C. N.,et al. 2012, MNRAS, 419, 687 Rees, M. J. 1984, ARA&A, 22, 471 Rodriguez-Gomez, V., Genel, S., Vogelsberger, M., et al. 2015, MNRAS, 449, 49 Russell, D. M., Gallo, E., & Fender, R. P. 2013, MNRAS, 431, 405 Sabater, J., Best, P. N., & Heckman, T. M. 2015, MNRAS, 447, 110 Salvati, M., Risaliti, G., V´eron, P., & Woltjer, L. 2008, A&A, 478, 121 Sanders, D. B., & Mirabel, I. F. 1996, ARA&A, 34, 749 S¸adowski, A., Narayan, R., Tchekhovskoy, A., et al. 2015, MNRAS, 447, 49 Schawinski, K., Simmons, B. D., Urry, C. M., Treister, E., & Glikman, E. 2012, MNRAS, 425, L61 Schnittman, J. D. 2013, Classical and Quantum Gravity, 30, 244007 Seymour, N., Stern, D., De Breuck, C., et al. 2007, ApJS, 171, 353 Shen, Y., Strauss, M. A., Ross, N. P., et al. 2009, ApJ, 697, 1656 Sikora, M., Stawarz, L., & Lasota, J.-P. 2007, ApJ, 658, 815 Simpson, C., Rawlings, S., Ivison, R., et al. 2012, MNRAS, 421, 3060 Skelton, R. E., Whitaker, K. E., Momcheva, I. G., et al. 2014, ApJS, 214, 24 Smith, E. P., & Heckman, T. M. 1989, ApJ, 341, 658 Soltan, A. 1982, MNRAS, 200, 115 Somerville, R. S., Hopkins, P. F., Cox, T. J., Robertson, B. E., & Hernquist, L. 2008, MNRAS, 391, 481 Spinrad, H., Marr, J., Aguilar, L., & Djorgovski, S. 1985, PASP, 97, 932 Steinbring, E. 2011, AJ, 142, 172 Szokoly, G. P., Bergeron, J., Hasinger, G., et al. 2004, ApJS, 155, 271 Tadhunter, C., Dicken, D., Morganti, R., et al. 2014, MNRAS, 445, L51 Tchekhovskoy, A., Narayan, R., & McKinney, J. C. 2011, MNRAS, 418, L79 Terashima, Y., & Wilson, A. S. 2003, ApJ, 583, 145 Treister, E., Schawinski, K., Urry, C. M., & Simmons, B. D. 2012, ApJ, 758, L39 Tundo, E., Tozzi, P., & Chiaberge, M. 2012, MNRAS, 420, 187 Ueda, Y., Watson, M. G., Stewart, I. M., et al. 2008, ApJS, 179, 124 Urrutia, T., Lacy, M., & Becker, R. H. 2008, ApJ, 674, 80 Veilleux, S., Kim, D.-C., & Sanders, D. B. 2002, ApJS, 143, 315 Villforth, C., Hamann, F., Rosario, D. J., et al. 2014, MNRAS, 439, 3342 Volonteri, M., Sikora, M., Lasota, J.-P., & Merloni, A. 2013, ApJ, 775, 94 Wilkes, B. J., Kuraszkiewicz, J., Haas, M., et al. 2013, ApJ, 773, 15 Wilson, A. S., & Colbert, E. J. M. 1995, ApJ, 438, 62 Xu, C., Livio, M., & Baum, S. 1999, AJ, 118, 1169 Xue, Y. Q., Luo, B., Brandt, W. N., et al. 2011, ApJS, 195, 10