SlideShare ist ein Scribd-Unternehmen logo
1 von 15
Downloaden Sie, um offline zu lesen
LETTER doi:10.1038/nature14162
An extremely high-altitude plume seen at Mars’
morning terminator
A. Sa´nchez-Lavega1,2
, A. Garcı´a Mun˜oz3
, E. Garcı´a-Melendo1,4
, S. Pe´rez-Hoyos1,2
, J. M. Go´mez-Forrellad4
, C. Pellier5
,
M. Delcroix5
, M. A. Lo´pez-Valverde2,6
, F. Gonza´lez-Galindo2,6
, W. Jaeschke7
, D. Parker8
, J. Phillips9
& D. Peach10
The Martian limb (that is, the observed ‘edge’ of the planet) repre-
sents a unique window into the complex atmospheric phenomena
occurringthere.Cloudsoficecrystals(CO2 iceorH2Oice)havebeen
observednumeroustimesbyspacecraftandground-basedtelescopes,
showingthat clouds are typically layered and alwaysconfined below
analtitudeof 100 kilometres;suspendeddusthasalso been detected
at altitudes up to 60 kilometres duringmajor dust storms1–6
. Highly
concentrated and localized patches of auroral emission controlled
by magnetic field anomalies in the crust have been observed at an
altitude of 130 kilometres7
. Here we report the occurrence in March
and April 2012 of two bright, extremely high-altitude plumes at the
Martianterminator(theday–nightboundary)at200to250kilometres
or more above the surface, and thus well into the ionosphere and the
exosphere8,9
. They were spotted at a longitude of about 1956 west, a
latitude of about 2456 (at Terra Cimmeria), extended about 500 to
1,000 kilometres in both the north–south and east–west directions,
and lasted for about 10 days. The features exhibited day-to-day vari-
ability,andwereseenat the morningterminatorbutnotat the even-
ing limb, which indicates rapid evolution in less than 10 hours and a
cyclicbehaviour.Weusedphotometricmeasurementstoexploretwo
possible scenarios and investigate their nature.For particles reflect-
ing solar radiation, clouds of CO2-ice or H2O-ice particles with an
effective radius of 0.1 micrometres are favoured over dust. Alterna-
tively, the plume could arise from auroral emission, of a brightness
more than 1,000 times that of the Earth’s aurora, over a region with
a strong magnetic anomaly where aurorae have previously been
detected7
. Importantly, both explanations defy our current under-
standing of Mars’ upper atmosphere.
On12March2012,amateurastronomersreportedasmallprotrusion
above the morning terminator of the Martian southern hemisphere
(Fig.1).Theprotrusionbecamemoreprominentoverthefollowingdays,
andon20and21Marchitwascapturedbyatleast18observersemploy-
ing20–40-cmtelescopesatwavelengthsfrombluetored(,450–650 nm;
Extended Data Figs 1–3). The feature was not detectable when it was
passingMars’centralmeridianorwhenitreachedtheoppositeafternoon
limb.AvailableimagesandanimationsproducedwiththeMARCI(Mars
Color Imager) instrument on board the Mars Reconnaissance Orbiter
(see Methods) do not show the feature, because such animations are
essentially mosaics formed by planet strips taken at 62 h of 15:00 local
Martian solar time (when the limb plume is not observed)10
. The 20–
21March measurements show that the feature extends from mean lati-
tudes 238.7u 6 6.4u to 249.7u 6 4.2u (,460 km) with extremes from
themeanrangingfrom232.3uto253.9u(,900 km),andwhenrotating
intoview,itslongitude(westwardreferencesystem)spans190.2u 64.2u
to201.4u6 6.8u (,660 km) withextremes fromthe mean ranging from
186u to 208.2u (,1,310 km). Thus, the feature is approximately above
the southeastern area of Terra Cimmeria11
. The event occurred when
theMartiansolarheliocentriclongitudewas Ls 5 85u–90u(earlywinter
of the southern hemisphere), and the daily mean insolation gradient at
Terra Cimmeria was large12
.
Theplumewasdetectedfor11consecutivedaysfrom12to23March.
Therearehoweverno observations of the terminator aboveTerra Cim-
meria from 24 March to 1 April (when it was not observed), a fact that
prevents us from putting an end date to the plume. Remarkably, the
aspect of the features changed rapidly, their shapes going from double
blob protrusions to pillars or finger-plume-like morphologies (Fig. 1).
On6 Aprilasecond,similar,eventwasobservednearthesameareaand
lasted until at least 16 April (Extended Data Fig. 2). Each event had an
overall lifetime $ 10 days, but changes over timescales ,12 h between
dawn and dusk were accompanied by day-to-day variability. A survey
offulldiskMartianimagestakenwiththeHubbleSpaceTelescope(HST)
between 1995 and 1999, and of amateur image databases (the latter
come from the Association of Lunar and Planetary Observers-Japan,
andSocie´te´AstronomiquedeFrance(CommissionSurfacesPlanetaires);
Methods)fromMarsapparitionsbetween2001to2014(atotalofabout
3,500images),showstheoccasionalpresenceofcloudsatthelimbsimilar
to those observed by spacecraft. These clouds, however, are typically less
prominent and conspicuous than in the 2012 events. Exceptionally, a
set of HST images from 17 May 1997 show an abnormal plume, which
is included here for photometric study13,14
.
We have measured the altitude of the plume top as projected onto
the dark background. Only the highest spatial resolution images and
those that allowed us to monitor the plume as it rotates into view from
behind the terminator were considered for measurements. These were
twoseries(24 imagesintotal)from20and21Marchlasting50 minand
70 min, respectively. In Fig. 2 we show the projected altitude of the
plume top at terminator as a function of the terminator west longitude
atlatitude245u(increasinglongitudeswithtime).Measuredsinglemaxi-
mum altitudes on these two days were 200 6 25 km for 20 March and
2806 25 kmfor21March.Thefeature’sprojectedaltitudewasmeasured
over time as the planet rotated. Fitting these altitudes to a second-order
polynomial resulted in maximum plume top altitudes of 185 6 30 km
(20 March, west longitude at terminator 211.5u) and 260 6 30 km (21
March, west longitude at terminator 214.5u). We have compared this
fit to a model of the projected altitude that would result from a feature
approachingtheterminatorandrotatingintoviewfortheMartianview-
ing geometric conditions (see Methods and Extended Data Fig. 4). The
model fitting of the data results in a plume top altitude of 200 6 50 km
for20Marchand260 6 50 kmfor21March.Weproposethat the devi-
ations between model fit and data for 21 March could originate from
horizontal structure in the plume or from time variability over ,1 h.
This analysis shows the extreme altitude of the plume top to be above
1
Departamento de Fı´sica Aplicada I, ETS Ingenierı´a, Universidad del Paı´s Vasco, Alameda Urquijo s/n, 48013 Bilbao, Spain. 2
Unidad Asociada Grupo Ciencias Planetarias UPV/EHU-IAA (CSIC), Alameda
Urquijo s/n, 48013 Bilbao, Spain. 3
European Space Agency, ESTEC, 2201 AZ Noordwijk, The Netherlands. 4
Fundacio´ Observatori Esteve Duran, Montseny 46, 08553 Seva (Barcelona), Spain. 5
Commission
des Surfaces plane´taires, Socie´te´ Astronomique de France, 3, rue Beethoven, 75016 Paris, France. 6
Instituto de Astrofı´sica de Andalucı´a, CSIC, Glorieta de la Astronomia, 3, 18008 Granada, Spain.
7
Association of Lunar and Planetary Observers, 200 Lawrence Drive, West Chester, Pennsylvania 19380, USA. 8
Association of Lunar and Planetary Observers, 12911 Lerida Street, Coral Gables, Florida
33156, USA. 9
Association of Lunar and Planetary Observers, Charleston, 570 Long Point Road STE 230, Mount Pleasant, South Carolina 29464, USA. 10
British Astronomical Association, Burlington House,
Piccadilly, London W1J 0DU, UK.
0 0 M O N T H 2 0 1 5 | V O L 0 0 0 | N A T U R E | 1
Macmillan Publishers Limited. All rights reserved©2015
200 km, never before observed on Mars, and reaching the ionosphere
and exosphere.
We have used the set of unprocessed images from 20 and 21 March
to measure the plume’s average reflectivity (I/F) at the three available
wavelengths over a box of size ,200 km3 200 km in the vertical and
along-terminatordirections(I,reflectedradiationintensity;pF,incident
solar flux). In order to gain insight into the photometric behaviour of
the plume and have a comparison reference, we determined the reflec-
tivity from 255 to 1,042 nm wavelength of a plume captured in 1997 by
theHSTWideFieldPlanetaryCamera(ExtendedDataFig.5).The1997
plume occurred (with its base on the terminator) at equatorial latitude
22.9u6 0.7u,westlongitude99.1u6 4uandsolarlongitudeLs 5 119.5u.
Its plume-like shape, horizontal extent of 10u (,590 km) and morning
occurrencesuggestthatboththe1997and2012featuresarerelatedphe-
nomena.Theactualaltitude ofthe 1997HSTfeaturecannotbeprecisely
determined because of the lack of a rotation image sequence, but we
can constrain its altitude to be between 50 km (for the case of a large
horizontalfeatureilluminatedbyagrazingSun, thatis,close to0usolar
illumination) and 480 km (for the case of a thin vertical feature under
90u solar illumination). Figure 3 shows the measured reflectivity (I/F)
for both the 1997 and 2012 events. The spectra appear flat within the
quoted uncertainties.
To interpret this phenomenon we explore two scenarios. First, we
assume that the plume is a cloud formed by particles of H2O-ice, CO2-
ice or dust. We performed forward radiative transfer modelling of the
reflected intensity and compared it with the observations. The model
considers multiple scattering and curvature effects for grazing illumi-
nation and a slanted view (see Methods). For the optical properties, we
assumedMietheory15
andwavelength-dependentindicesofrefraction16,17
.
AsshowninFig.3,dustparticlescanberuledout forthe1997eventand
show only marginal agreement with the 2012 data (see also Extended
Data Fig. 6). Typically, the best fits occur for CO2 or H2O ice particles
with effective radiiof 0:1z0:1
{0:004 mm, whichis consistent withthe particle
size of mesospheric clouds observed at night4
. Comparably good fits
are obtained for a broad range of particle effective variances (0.1–2.0),
which means that the latter parameter cannot be constrained with the
available information. The best fit occurs for a layer of vertical thick-
ness 100 km and a nadir optical depth tN . 0.5 for both the 1997 and
192°, –44º
198°, –38º
b
185°, –42º
198°, –28º
c
195°, –47º
207°, –34º
d e
189°, –47º
201°, –33º
190°, –45º
202°, –32º
f
1
0.8
0.6
0.4
0.2
0
g400
300
200
100
0
Height(km)
–50° –45° –40° –35° –30°
Latitude at planetary terminator
0º
30º
50º
70º
–30º
–50º
a
Figure 1 | A high-altitude plume at the Martian terminator. a, Navigated
image (that is, observed planetary disk and fit to model: yellow line, disk; blue
line, equator) that shows the feature location (red circle) on March 21 03:21
(image, D. Parker). Dates and times are UTC; image in geographic orientation
(north, up; east, right). b–f, Plume images with west longitudes and latitudes at
terminator (inverted orientation to facilitate visibility) for dates as follows
(yellowline marks the terminator): b, March 20 02:45 (image W.J.); c, March 21
02:51 (W.J.); d, March 21 03:45 (J.P.); e, March 21 03:21, colour composite
(D. Parker); f, March 21 03:21, red filter (D. Parker). g, Plume relative
brightness map for March 21 03:21, red image (D. Parker). The white
doubled-ended vertical arrow in g indicates the estimated error for altitude
determination (650 km or 4 pixel size), which is on average 2 s.d. of the
individual point uncertainty.
350
300
250
200
150
100
50
0
200 205 210 215 220 225 230
West longitude at limb (degrees)
Projectedcloudtopaltitude(km)
200 km
280 km
250 km
–50°
–40°
Figure 2 | Plume top altitude and its rapid changes. Filled circles show the
plume’s altitude when rotating into view, as given by the west longitude at the
terminator (longitudes increasing with time) for March 20 02:02–02:51 UT,
blue, and March 21 02:40–03:50 UT, red. Error bars, s.d. for n 5 5–10
measurements. Solid curves, second degree polynomial fits to these two data
sets. Dashed lines, altitudes predicted by a geometric model for a feature placed
at the terminator with top altitude 250 or 280km (red) and 200km (blue) at
west longitude 216u. The single data points are individual measurements on
March dates as follows (error bars, 2 s.d., n 5 5): 12 (cross), 15 (rhomb),
17 (square), 19 (circle), 22 (triangle). Dashed lines show the projected altitude
of the Mars shadow (dotted area under these curves) at two latitudes.
RESEARCH LETTER
2 | N A T U R E | V O L 0 0 0 | 0 0 M O N T H 2 0 1 5
Macmillan Publishers Limited. All rights reserved©2015
2012 events, which implies number densities of 0.01 particles per cm3
(see Methods and Extended Data Figs 7 and 8). Vaporization of these
particles will produce an increase in the gas concentration by a factor
of ,1,000 for H2O and 5% for CO2 (see Methods).
According to a general circulation model (GCM)18,19
for conditions
specific to the observation dates, H2O condensation at the relevant alti-
tudesrequireseitheranomalouslycoldthermospherictemperatures(with
temperature drop .50 K) or an unusual increase in the H2O mixing
ratio from 1024
to complete saturation above 140 km (Fig. 4)20
. CO2
condensation would require an even larger temperature drop of 100 K
above 125 km. On the other hand, explaining the cloud as formed by
dustwouldrequirevigorousverticaltransportuptoatleast180 kmabove
the surface (but this is not predicted by GCMs) or by vigorous updrafts
due to dry convection under high insolation (dust heating follows from
the absorption of solar radiation)21,22
. Thus, upward motions are more
likely to occur at noon than in the morning; all of which, together with
the photometric data, makes the dust hypothesis difficult to support.
In the second scenario, we explored whether the 2012 plume might
beattributabletoanaurora.Marsauroraehavebeenobservednearwhere
theplumeoccurs, aregionwithalargeanomalyinthe crustalmagnetic
field (at 175u west)7
that can drive the precipitation of solar wind
particles into the atmosphere7,23
. The meridional extent of the plume
(,500 km, about consistent with aurorae7
) and its variability could
also support this hypothesis. Mars’ ultraviolet aurora is dominated by
the Cameron bands of carbon monoxide (CO), with limb intensities of
kilorayleighs (kR; refs 7, 24); visible counterpart emissions are also
expected. However, quantitative estimates of the aurora intensity defy
such a hypothesis.An I/F value of 0.04 at 550nm (Fig. 3) translatesinto
anaurorallimbintensityof3,600megarayleighs(MR),muchmorethan
the 1-MR nadir emission of strong terrestrial aurorae25
. Furthermore,
an auroral hypothesis requires an exceptional influx of energetic part-
iclesoverdays,althoughsolaractivityinMarch2012 wasnot unusually
high26
. Even accounting for deficiencies in the understanding of auroral
excitation27,28
,theextrapolationfromultravioletintensitiestothevisible
falls short of the reported plume brightness by orders of magnitude.
Confirmation or rejection of the auroral hypothesis is, however, feasi-
ble merely by extended monitoring from ground or space.
Online Content Methods, along with any additional Extended Data display items
andSource Data, are available in the onlineversion of the paper; references unique
to these sections appear only in the online paper.
Received 1 August; accepted 17 December 2014.
Published online 16 February 2015.
1. Ma¨a¨tta¨nen, A. et al. A complete climatology of the aerosol vertical distribution
on Mars from MEx/SPICAM UV solar occultations. Icarus 223, 892–941 (2013).
2. Heavens, N. G. et al. The vertical distribution of dust in the Martian atmosphere
during northern spring and summer: observations by the Mars Climate Sounder
and analysis of zonal average vertical dust profiles. J. Geophys. Res. Planets 116,
E04003 (2011).
3. Ma¨a¨tta¨nen, A. et al. Mapping the mesospheric CO2 clouds on Mars: MEx/OMEGA
and MEx/HRSC observations and challenges for atmospheric models. Icarus 209,
452–469 (2010).
4. Montmessin, F. et al. Hyperspectral imaging of convective CO2 ice clouds in the
equatorial mesosphere of Mars. J. Geophys. Res. 112, E11S90 (2007).
5. Montmessin, F. et al. Subvisible CO2 ice clouds detected in the mesosphere of
Mars. Icarus 183, 403–410 (2006).
6. Clancy, R. T. et al. CRISM limb observations of Mars mesospheric ice clouds: two
new results. Proc. Eighth Int. Conf. on Mars, abstr. 1006, http://www.hou.usra.edu/
meetings/8thmars2014/pdf/program.pdf (2014).
7. Bertaux, J. L. et al. Discovery of an aurora on Mars. Nature 435, 790–794 (2005).
8. Strobel, D. F. in Atmospheres in the Solar System: Comparative Aeronomy (eds
Mendillo, M., Nagy, A. & Waite, J. H.) 39–54, 191–202 (American Geophysical
Union, 2002).
9. Yagi, M. et al. Mars exospheric thermal and non-thermal components: seasonal
and local variations. Icarus 221, 682–693 (2012).
10. Bell, J. F., III et al. Mars Reconnaissance Orbiter Mars Color Imager (MARCI):
instrument description, calibration, and performance. J. Geophys. Res. 114,
E08S92 (2009).
11. Zuber, M. T. et al. The Mars Observer Laser Altimeter investigation. J. Geophys. Res.
97, 7781–7797 (1992).
12. Co´rdoba-Jabonero, C., Zorzano, M. P., Selsis, F., Patel, M. R. & Cockell, C. S.
Radiative habitable zones in Martian polar environments. Icarus 175, 360–371
(2005).
13. Minami, M. Communication in Mars Observations. No. 283 http://www.kwasan.
kyoto-u.ac.jp/,cmo/cmomn2/283OAA/index.htm (2003).
14. Pellier, C. Martian terminator projections observed by the HST. In Communications
in Mars Observations No. 400, http://www.kwasan.kyoto-u.ac.jp/,cmo/cmomn4/
CMO400.pdf (2012).
0.2 0.4 0.6 0.8 1.0 1.2
0
0.01
0.02
0.03
0.04
0.05
0.06
0.07
Wavelength (μm)
I/F
1997
2012
Figure 3 | Plume reflectivity and radiative transfer model comparison.
Spectral reflectivity of the 20–21 March 2012 event (triangles) and of the
17 May 1997 event (circles) from ground-based and HST observations,
respectively. The error bars represent the average quadratic deviation of the
measured reflectivity in the integration box. Observations are compared with
the best-fitting model for the case where the protrusion is assumed to be a cloud
formed by spherical particles: CO2-ice (blue solid line), H2O-ice (red dot-
dashed line) or Martian dust (green dashed line). Stars indicate the wavelength
grid used for radiative transfer computations.
60 80 100 120 140 160 180 200
Temperature (K)
50
100
150
200
Altitude(km)
Figure 4 | Atmospheric temperature profile, and water and carbon dioxide
condensation temperatures. These are calculated for the conditions of the
2012 event (latitude 240u, longitude 200u, Ls 5 90u, local time LT 5 6 h)
according to a general circulation model18,19
. Atmospheric temperature is
shown by the black line, with greyprofiles indicating values extending the range
by 610u for latitude, 10u in longitude and 2 h in LT. Condensation
temperatures for water (dashed green line) and carbon dioxide (dashed red
line) are obtained from the saturation vapour pressure curves of both
compounds20
.
LETTER RESEARCH
0 0 M O N T H 2 0 1 5 | V O L 0 0 0 | N A T U R E | 3
Macmillan Publishers Limited. All rights reserved©2015
15. Mishchenko, M. I., Travis, L. D. & Lacis, A. A. Scattering, Absorption and Emission of
Light by Small Particles (Cambridge Univ. Press, 2002).
16. Warren, S. G. Optical constants of carbon dioxide ice. Appl. Opt. 25, 2650–2674
(1986).
17. Fedorova, A. A. et al. Evidence for a bimodal size distribution for the suspended
aerosol particles on Mars. Icarus 231, 239–260 (2014).
18. Gonza´lez-Galindo, F., Ma¨a¨tta¨nen, A., Forget, F. & Spiga, A. The Martian mesosphere
as revealed by CO2 cloud observations and general circulation modeling. Icarus
216, 10–22 (2011).
19. Gonza´lez-Galindo, F. et al. Three-dimensional Martian ionosphere model: I. The
photochemical ionosphere below 180 km. J. Geophys. Res. 118, 2105–2123
(2013).
20. Sa´nchez-Lavega, A., Pe´rez-Hoyos, S. & Hueso, R. Condensate clouds in planetary
atmospheres: a usefulapplication of the Clausius-Clapeyron equation.Am. J. Phys.
72, 767–774 (2004).
21. Heavens, N. G. et al. Vertical distribution of dust in the Martian atmosphere
during northern spring and summer: High-altitude tropical dust maximum
at northern summer solstice. J. Geophys. Res. Planets 116, E01007
(2011).
22. Spiga, A., Faure, J., Madeleine, J. P., Ma¨a¨tta¨nen, A. & Forget, F. Rocket dust storms
and detached dust layers in the Martian atmosphere. J. Geophys. Res. Planets 118,
746–767 (2013).
23. Mitchell, D. L. et al. A global map of Mars’ crustal magnetic field based on electron
reflectometry. J. Geophys. Res. 112, E01002 (2007).
24. Leblanc, F. et al. Observations of aurorae by SPICAM ultraviolet spectrograph on
board Mars Express: simultaneous ASPERA-3 and MARSIS measurements.
J. Geophys. Res. 113, A08311 (2008).
25. Chamberlain, J. W. Physics of the Aurora and Airglow, Ch. 4, 5 (American
Geophysical Union, 2013).
26. SpaceWeatherLife.com http://www.spaceweatherlive.com/en/archive/2012/
03/12/rsga (2014).
27. Fox, J. The ionospheric source of the red and green lines of atomic oxygen in the
Venus nightglow. Icarus 221, 787–799 (2012).
28. Slanger, T. G. et al. Photoemission phenomena in the Solar System. Space Sci. Rev.
139, 267–310 (2008).
Acknowledgements This work was supported by the Spanish MINECO project
AYA2012-36666, FEDER, Grupos Gobierno Vasco IT765-13 and UPV/EHU UFI11/55.
The IAA(CSIC) teamwassupported by the Spanish MINECO through the CONSOLIDER
programme ASTROMOL CSD2009-00038 and AYA2011-30613-CO2-1. F.G.-G. is
funded by a CSIC JAE-Doc contract co-financed by the European Social Fund.
Author Contributions A.S.-L. coordinated the study and performed plume
measurements, photometric calibration and participated in the models study; A.G.M.
studied aurora and together with S.P.-H. performed radiative transfer modelling;
E.G.-M. performed with A.S.L. the geometric modelling; M.A.L.-V. and F.G.-G. performed
the GCM model calculations andaurorastudies, and F.G.-G.performedtheevaporation
calculations; J.M.G.-F., C.P. and M.D. performed plume measurements; W.J., D. Parker,
J.P. and D. Peach performed ground-based images. All authors discussed the results
and commented on the manuscript.
Author Information Reprints and permissions information is available at
www.nature.com/reprints. The authors declare no competing financial interests.
Readers are welcome to comment on the online version of the paper. Correspondence
and requests for materials should be addressed to A.S.-L. (agustin.sanchez@ehu.es).
RESEARCH LETTER
4 | N A T U R E | V O L 0 0 0 | 0 0 M O N T H 2 0 1 5
Macmillan Publishers Limited. All rights reserved©2015
METHODS
Image availability. Amateur images. Available at the following databases: Associ-
ation of Lunar and Planetary Observers-Japan, http://alpo-j.asahikawa-med.ac.jp/
Latest/Mars.htm (2012), and Socie´te´ Astronomique de France (Commission sur-
faces Planetaires), http://www.astrosurf.com/pellier/mars (2012).
Hubble Space Telescope images. Available at NASA Planetary Data System (PDS)
or at ESA HST archive, http://archives.esac.esa.int/hst/#Q-1R-S1D-1 (2012).
MRO MARCI Weather Reports. Malin Space Science Systems. Captioned Image
ReleaseNo.MSSS-216–21March2012http://www.msss.com/msss_images/2012/
03/21/ and Captioned Image Release No. MSSS-217 – 28 March 2012 http://www.
msss.com/msss_images/2012/03/28/.
MOLA maps. Available at http://mola.gsfc.nasa.gov/images/topo_labeled.jpg.
Image analysis and measurement. Most images were obtained with broadband
filters coveringthe blue (B, leff 5 4506 50 nm), green (G,leff 5 520650 nm) and
red (R, leff 5 6256 75 nm) spectral bands. Each image was constructed by sum-
ming, aligning and re-centring sequences of frames captured in video mode, and
application of the ‘lucky imaging’ method29–31
and the ‘wavelet’ as the main pro-
cessing technique30
. The Airy disk for a telescopeof 356mm in diameter (Fig. 1a,b,
d–g and photometric analysis) at a wavelength of 450nm is 0.317arcsec and the
plate scale employed was 0.045arcsec per pixel equivalent to an effective pixel size
of25 kmonMars, typicallyused in highresolution planetary imageswhererecord-
ing features depends, for excellent seeing conditions, on resolution and features
contrast32
.Thetotalspatialcoverageof theprojectedplumeis,850pixels(21March,
Fig. 1g). Image navigation, thatis, the determination of the planetary limb and ter-
minatorwasperformedusingtwowell-testedsoftwarepackages(LAIA,WinJupos;
ref. 33 and http://www.grischa-hahn.homepage.t-online.de/astro/index.htm). The
bright Martian limb was used as a reference but not the terminator whose defini-
tionisaffectedbythe presenceofthe darkand bright features. Navigation was accu-
ratelycontrolledbymeasuringthepositionofwell-knownsurfacefeatures(Olympus
Mons and Tharsis volcanoes). The projected plume top altitude on the sky plane
(definedastheborderbetweenthefeatureandthedarkbackground,contrastforced)
was simply determined from its distance to the Mars disk centreand subtraction of
the measured Martian radius (all in pixel units). Navigation and image measure-
ments were performed independently by four of us. From these multiple measure-
ments,we derivedthe meanvaluesofthe Marsradiusandtopaltitudeforeach image.
The uncertainties represent the root mean square (r.m.s.) values of the altitude
determinations. We estimate that the positioning error is 62 pixels and that, for
the above plate-scale, this corresponds to 650 km. Uncertainties in plume mea-
surements result from brightness diffusion at the top and sides of the plumes and
from the determination of the base location of the plume relative to the navigated
terminator, including its brightness irregularities.
As a further step in navigation control, we used the image series of 20 March by
W.J. to compare the results of the top altitude measurements by two different pro-
cedures: (1) through measurements on each image of the planet and plume top
radius to calculate the plume maximum altitude; (2) through determination of the
meanradiusforthewholeimageseries(anditsuncertainty)andthenusingthismean
value for each image to determine the top altitude. Both approaches yield consis-
tent results within the uncertainties indicated in the text.
Themeasuredtopaltitudevalues(H)andtheterminatorwestlongitudes(L,defined
asthecentralmeridianlongitudeforeachobservingtime170u)for20and21March,
fitted to a second order polynomial H 5 a0 1 a1L 1 a2L2
, gave the peak values
at Lmax 5 2a1/2a2, and then the corresponding Hmax. The retrieved coefficients
are, for 20 March, a0 5 215,233.8, a1 5 144.7, a2 5 20.3395, and for 21 March,
a0 5 243,164.8, a1 5 401.8, a2 5 20.929.
Plume altitude model. Angular distance between the plume’s base and the central
meridian. Our coordinate systemisplacedatthe centre ofMars: thex axiswillbeon
the observer’s visual and the y–z plane is coincident with the sky plane. Coordinate
systemgeometry is depicted in Extended Data Fig. 4, withthe cloudrisingnear the
west morning limb and the sub-Earth point on the equator. The longitude of the
Central Meridian (CM) is lCM, and the latitude and longitude of the plume are
respectively Qc and lc. The longitudinal angular distance of the plumeto the CM is
related to the angular distance b between the plume and the limb taking as a
reference the negative y axis, by:
900
{b~lc{lCM ð1Þ
where b is positive if the limb is behind the cloud, and negative if the cloud is
located behind the limb.
Limit altitude for plume visibility. Let z(b) be the visible projected plume altitude
above Mars’ limb not blocked by the planet’s disk when b , 0. When the plume is
behind the limb it protrudes from the planet’s limb only if its total projected length
on the y–z plane from the planet centre is larger than the planet’s radius RM. With
cy and cz being respectively the y and z coordinates of the cloud top, we have
c2
yzc2
z
n o1=2
~RMzz bð Þ. In terms of b and the real cloud altitude H, we get
cy~{ RMzHð Þ cos Qc cos b
cz~ RMzHð ÞsinQc
&
ð2Þ
The minimum height of the plume Hmin to protrude from the limb (z(b) 5 0) is
Hmin~
RM
1{ cos2 Qcsin2
bf g
1=2
{RM ð3Þ
Real plume altitude derived from its projected length. When b , 0, by expression
(2), z(b) must satisfy
z bð Þ~ RMzHð Þ cos2
Qc cos2
bzsin2
Qcf g
1=2
{RM ð4Þ
and the actual plume altitude is:
H~
z bð ÞzRM
1{ cos2 Qcsin2
bf g
1=2
{RM ð5Þ
If b . 0, the whole plume is visible (we see its projected total height). The cloud
height H is now given by:
H~
z bð Þ
1{ cos2 Qcsin2
bf g
1=2
ð6Þ
Correction when Mars has a declination DE as observed from Earth. By taking the
declination angle 1DE when the north pole is tilted towards Earth and 2DE when
the planet’s south pole is visible, the transformation matrix due to a rotation
around the y axis by an angle 1DE is
x0
y0
z0
2
6
4
3
7
5~
cos DE 0 sinDE
0 1 0
{sinDE 0 cos DE
2
6
4
3
7
5
x
y
z
2
6
4
3
7
5 ð7Þ
Therefore, expressions (5) and (6) must be corrected taking into account that:
y0
~y
z0
~{xsinDEzz cos DE
&
ð8Þ
In the rotated coordinate system, the projected plume altitude is z0
bð Þ~
c0
y
2
zc0
z
2
n o1=2
{RM, with c0
y and c0
z being thetransformed coordinatesof the plume
top, with the non-transformed coordinates of the plume top given by:
cx~(RMzH) cos Qc sin b
cy~{(RMzH) cos Qc cos b
cz~(RMzH)sinQc
ð9Þ
Expressing c0
y and c0
z in terms of cx, cy and cz when the plume is behind the limb
gives its real height
H~
z0
bð ÞzRM
cos2 Qc cos2 bz sinQc cos DE{ cos Qc sinb sinDEð Þ2È É1=2
{RM ð10Þ
Owing to the planet’s tilt, the plume will be on the limb not for b 5 0 but for a
different value blim. Therefore, for b 5 blim, z9(b) 5 0 if H 5 0. Applying this con-
dition to expression (10) and after some algebraic manipulations, we obtain:
blim~{sin{1
tan(Qc)|tan DEð Þ ð11Þ
When DE 5 0 we recover blim 5 0. Note that at the equator blim is always 0 regard-
less the value of DE. Expression (10) is valid for bƒblim (the plume is behind the
planet’s limb). When b§blim the plume is before the limb and is not blocked by
the planet and we have:
H~
z0
bð Þ
cos2 Qc cos2 bz sinQc cos DE{ cos Qc sinb sinDEð Þ2È É1=2
ð12Þ
Mars’ shadow projection on the plume. Given the coordinates of the subsolar point
on Mars (ls, Qs) and the plume coordinates (lc, Qc) we have both points separated
by an angle:
c~ cos{1
cos Qs cos Qc cos ls{lcð ÞzsinQssinQc½ Š ð13Þ
This expression is also valid when ls and lc are the respective distances to the CM.
In this case, lc 5 (p/2) 2 b when we are close to the morning limb and:
c~ cos{1
cos Qs cos Qcsin lszbð ÞzsinQs sinQc½ Š ð14Þ
LETTER RESEARCH
Macmillan Publishers Limited. All rights reserved©2015
Looking at Extended Data Fig. 5, the angle a 5 c 2 (p/2) and the height of the
planet’s shadow projected on the plume is:
SC~
RM
cos a
{RM ð15Þ
For b , 0, using equations (5) and (15), the visible projected length of the planet’s
shadow projected on the protruding plume is:
S bð Þ~
RM
cos a
cos2
Qc cos2
bzsin2
Qc
È É1=2
{RM ð16Þ
For b . 0 the planet’s shadow projected on the plume is completely visible, since
the planetary disk does not block it. The real height of the shadow will be SC again,
and according to equation (6) the projected shadow’s height will be:
S bð Þ~SC cos2
Qc cos2
bzsin2
Qc
È É1=2
~RM
1
cos a
{1
!
cos2
Qc cos2
bzsin2
Qc
È É1=2
ð17Þ
Again, if the planet’s rotation axis is tilted by 6 DE degrees, we obtain
S bð Þ~
RM
cos a
cos2
Qc cos2
bz sinQc cos DE{ cos Qc sinb sinDEð Þ2È É1=2
{RM ð18Þ
for bƒblim, and
S bð Þ~SC cos2
Qc cos2
bz sinQc cos DE{ cos Qc sinb sinDEð Þ2È É1=2
ð19Þ
for b§blim.
The model predictions are shown in Fig. 2. A x2
calculation between the mea-
sured top altitudes considering the individual error and the predictions from the
geometric model for a uniform plume shows that for 20 March x2
, 4 for top alti-
tudes 190–195 km (best fit), but for 21 March x2
(min) < 20 for top altitudes 240–
250km. Thelarge deviationsbetween themodelandtheobservationsfor 21March
data rule out a uniform structure for the plume.
Altitude of the 1997 HST feature. The 17 May1997 eventwas captured by HSTon a
single image at each specific wavelength, and thus they do not show the plume in
rotation at the limb/terminator. Therefore we can only constrain the maximum
and minimum altitudes for the feature as seen projected on the terminator. The
feature protrudes on the terminator by 10u (angle a in Extended Data Fig. 4). For
solar zenith angle SZA 5 90u (grazing illumination) the minimum altitude is given
by equation (15): Hmin 5 SC 5 53 km. On the other hand, the maximum altitude
Hmax will occur for a vertical feature whose projection L as seen on the terminator
from Earth (phase angle w 5 35.5u) is given by L~
ffiffiffiffiffiffiffiffiffiffiffiffiffiffiffiffiffiffiffiffiffiffiffiffiffiffiffiffiffiffiffiffiffi
(RMzSc)2
{RM
2
q
and then
Hmax 5 Ltanw 5 480km.
Photometric calibration. (1) Ground-based observations (20–21 March 2012).
Stacked and aligned unprocessed images were used for reflectivity measurements.
Because of their higher resolution, only the series B, G, R filtered images from W.J.
and D. Parker were used for that purpose. The photometry from the brightest part
ofthecloudwascomparedtodifferentbrightanddarkregionsofMarswhoseabso-
lute (I/F) reflectivity is known34
. The resulting I/F can be seen as an average for the
cloud at B, G and R, and from independent measurements by the team members of
the same images, we estimate an uncertainty of 20%.
(2) HST calibration (17 May 1997). Hubble Space Telescope observations acquired
in filters from the ultraviolet (F255W) to the near-infrared (F1042M) (Extended
Data Fig. 5) were photometrically calibrated following the WFPC2 handbook
instructions. Radiances were converted into absolute reflectivity I/F using the solar
spectrum35,36
. The resulting I/F as a function of planetary geographical coordinates
was confirmed against values given by other authors for selected locations of the
planet34
andwithglobalalbedovaluesoftheplanet37
.Theintensitycalibrationmethod
for ground-based images was validated with a similar procedure to that used in
HST images and comparison with the above procedure.
Radiative transfer model. We conducted radiative transfer calculations of the
reflectivity I/F with a backward Monte Carlo model designed for spherical-shell
atmospheres38
. The model produces as output the full Stokes vector of radiances,
but only the first vector element (intensity) was considered for comparison with the
observations. The model naturally accounts for curvature effects in the (nearly)
grazing illumination/viewing geometries of both the 1997 and 2012 events. In its
specific implementation here, the model assumes a uniform cloud of geometrical
thickness D that enshrouds the entire planet. The observer looks upon the planet
terminator with a line of sight that sequentially probes the full range of altitudes
where the cloud is present. For the 1997 event, plane psun (formed by the local ver-
tical direction at the planet’s terminator and the Sun illumination direction), and
plane psobs (formed by the same local vertical direction and the observer viewing
direction) are offset by an azimuth angle of 15u. The cosine of the polar angle
between the observer’s viewing direction and the local vertical at the terminator is
0.514 6 0.02, and is 0.404 6 0.03 for the farthest point of the plume from the
terminator. The phase angle (Sun–Mars–Earth) was 35.6u. Correspondingly, for
the 2012 event, the prescribed azimuth angle and the cosine of the polar angle are
0u and 0.01460.03, and the phase angle (Sun–Mars–Earth) was 7.15u. Solar photons
entertheatmospherefollowinggrazingtrajectories,andpenetratehalfwaythrough
the limb before beingscattered towards the observer atthe terminator. To compare
with the box-averaged I/Fs from observations, the model-calculated I/Fs were also
averaged over the cloud geometrical thickness D from the observer’s vantage point.
A number of photon realizations between 104
and 105
ensured accuracies typically
better than 5%, which is much less than the measured uncertainties. The atmo-
spheric inputs to the model include the cloud particles’ optical properties and the
cloud (vertical) optical thickness tN, in addition to the geometrical thickness of the
cloud D.
In the prescription of particle sizes, we used a power law distribution described
by the two moments reff (effective radius) and neff (effective variance)15
. Particle
candidates are CO2-ice, H2O-ice and dust, and we considered their wavelength-
dependent refractive indices13,14
.
The particles’ optical properties required in the radiative transfer calculations
are $, p(h) and s, which stand for the particles’ single scattering albedo, scattering
phase function and extinction cross-section, respectively. Each of these properties
is specified at the appropriate radiation wavelength l. For the determination of the
optical properties we used Mie theory, which applies to scattering by spherical par-
ticles. If the particlesare non-spherical, Mie theory may bias the properties of inferred
particles that fit best the measured I/F reflectivities. The differences in optical
properties between spherical and non-spherical particles depend on the particles’
shape and size distribution, as well as on their composition and on the radiation
wavelength.Numericalinvestigationshaveexploredthesedifferences overa limited
range of parameter space15
. Without additional information on the cloud particles,
it is difficult to assess the consistency in the treatment with Mie theory of the radi-
ative transfer problem. We can nevertheless tentatively quantify it by comparison
against specific solutions from the literature. For reff 5 0.1 mm and l 5 0.55 mm,
the effective size parameter xeff 5 2preff/l < 1. Focusing on the scattering phase
function, which is particularly sensitive to the particles’ shape, a few studies15
sug-
gest that for xeff < 1 the differences between spherical and non-spherical particles
are not usually more than a few tens of per cent. These differences are less than for
larger values of xeff.
Overall, each radiative transfer calculation requires user-inputted values for l,
particle composition (and therefore wavelength-dependent refractive indices), reff,
neff and tN (also dependent on wavelength). The problem of comparing reflectiv-
ities I/F from model calculations and observations is therefore multi-parametric.
Intheexplorationofthespaceofparameters,webuiltagridofsolutionstotheradi-
ative transfer problem for D (10, 50, 100, 200km), reff (0.01 to 2 mm; 20 values with
varying steps between 0.01 and 0.1 mm), neff (0.1, 0.2, 0.5, 1 and 2; range consistent
with values adopted in prior Mars investigations4,15,39
) and tn,502nm (5tn at 502nm;
from 16 to 1023
; 31 values in steps following a power law). The total number of
radiative transfer calculations for each of the 1997 and 2012 events exceeds 105
.
For each possible spectrum within the grid of calculations with identical particle
composition, reff, neff and tn,502nm, we calculated the average quadratic deviation of
the model from the observed data weighted by the observation errors (x2
). A subset
ofthefreeparameterspacewithbest-fittingvaluesisshowninExtendedDataFig.6
for the 1997 event and Extended Data Fig. 7 for the 2012 event. In the former case,
dust particles do not fit the data with x2
, 1.0. While a number ofsub-optimal solu-
tions for different combinations of the free parameters can be found, the highest
density of low x2
solutions can be interpreted as the most likely combination of
the free parameters. This happens for particles with effective radii of the order of
0.1 mm, depending on the particles’ effective variance and composition. In this
framework, there is no way to discriminate between the variances and this also
impedes making a choice between H2O and CO2 as the most likely particle type.
Similarly, the x2
results for the 2012 observations show a broad range of particle
sizes and optical thicknesses that provide x2
, 1.0. They include dust particles
that, in any case, result in fits that are worse than for the H2O and CO2 composi-
tions. Extended Data Fig. 8 shows how, given the narrow spectral range covered
duringthe 2012 event, itis possible to retrieve acceptablefits forparticle sizes rang-
ing from 0.1 to 1.0mm, provided that the rest of the free parameters are adequately
tuned. Observations at shorter/longer wavelengths might potentially break this
degeneracy.
All in all, the radiative transfer calculations for both the 1997 and 2012 events
constrain to some extent the effective particle radius reff, and the vertical extension
of the cloud D, andgive alowerlimit for the normal opticalthickness tn,502nm. Unfor-
tunately, additional data are required to constrain other parameters, such as neff or
the cloud particle composition. The optical thickness tn,502nm retrieved from the
model fit translates into particle density after dividing the optical thickness by the
particle cross-section at 502 nm and the cloud geometrical thickness.
RESEARCH LETTER
Macmillan Publishers Limited. All rights reserved©2015
Code availability. All radiative transport calculations were conducted with a
novel pre-conditioned backward Monte Carlo (PBMC) model38
. A plane-parallel
version of the model is freely available through: http://dx.doi.org/10.1051/0004-
6361/201424042. This version contains instructions to run the model, test cases
and model outputs that can be compared to calculations tabulated in ref. 38. In the
analysis of the Mars plume, we used a version of the PBMC suitable for spherical
shell atmospheres. The spherical-shell model is available on request from A.G.M.
(tonhingm@gmail.com).
Mars General Circulation Model. As supplied in the Mars Climate Database at
http://www-mars.lmd.jussieu.fr/.
Cloud evaporation. H2O-cloud. Taking water-ice density as 0.93 g cm23
(ref. 40),
the mass of a spherical particle with radius 0.1 mm is m 5 43 10215
g; the corres-
ponding number of molecules resultingfrom evaporationofthis particle is mNAvo/
m < 108
, taking NAvo 5 6.0233 1023
particles per mol and the molecular weight of
water is m 5 18 g mol21
. For the retrieved cloud density 0.01 cm23
, evaporation of
the cloud will produce ,106
particles per cm3
. On the other hand, the atmospheric
densityisr 5 53 10215
g cm23
atanaltitudeof200 km, atlatitude240u,Ls 5 90u,
210u W longitude and local time 6 h (ref. 18). The mean molecular weight of the
atmosphere at this altitude is now m 5 17 g mol21
because of oxygen dominance
with a volume mixing ratio vmr 5 0.6 and a 13% contribution from N2 and CO.
The vmr of H2O at this altitude is 4 3 1026
. The number density of molecules in
theatmosphereisN(H2O,atm:)~ rH2O|NAvo=m
À Á
|vmrH2O103
particlescm{3
.
Therefore, evaporation of the water ice will produce an enrichment of water by a
factor ,1,000 over normal conditions.
CO2-cloud. Taking CO2-ice density as 1.5 g cm23
, the mass of a spherical particle
withradius0.1mmwillbem 56310215
gandthecorrespondingnumberofmolec-
ules resulting from evaporation is mNAvo/m9  108
where m9 5 44 g mol21
is the
molecular weight of CO2. For the retrieved cloud particle density of 0.01 cm23
,
cloudevaporationwillproduce,106
particlespercm3
.Onthe otherhand,fromthe
aboveatmosphericconditions,andvmrCO2 50.09,thenumberdensityofmolecules
intheatmosphereisN(CO2,atm:)~ rCO2
|NAvo=m
À Á
|vmrCO2
107
particlescm{3
.
Therefore, CO2 ice evaporation will produce a 5% enrichment of CO2.
29. Law, N. M., Mackay, C. D.  Baldwin, J. E. Lucky imaging: high angular resolution
imaging in the visible from the ground. Astron. Astrophys. 446, 739–745 (2006).
30. Berrevoets, C. et al. RegiStax6. http://www.astronomie.be/registax/ (2011).
31. Kraaikamp, E. AustoStakkert!2. http://www.autostakkert.com/ (2012).
32. Peach, D. A. The 2010 perihelic opposition of Jupiter observed from Barbados.
J. Br. Astron. Assoc. 121, 337–340 (2011).
33. Cano, J. A. LAIA: Laboratorio de Ana´lisis de Ima´genes Astrono´micas (Grup d’Estudis
Astrono`mics, Barcelona, 1998).
34. Bell, J. F. III et al. Mars surface mineralogy from Hubble Space Telescope imaging
during 1994-1995: observations, calibration, and initial results. J. Geophys. Res.
102, 9109–9123 (1997).
35. de Pater, I. et al. A multi-wavelength study of the 2009 impact on Jupiter:
comparison of high-resolution images from Gemini, Keck and HST. Icarus 210,
722–741 (2010).
36. Colina, L., Bohlin, R. C.  Castelli, F. The 0.12–2.5 micron absolute flux distribution
of the Sun for comparison with solar analog stars. Astron. J. 112, 307–315 (1996).
37. Mallama, A. The magnitude and albedo of Mars. Icarus 192, 404–416 (2007).
38. Garcı´a Mun˜oz, A.  Mills, F. P. Pre-conditioned backward Monte Carlo solutions to
radiative transport in planetary atmospheres. Fundamentals: sampling of
propagation directions in polarising media. Astron. Astrophys. 573, A72 (2015).
39. Santer, R., Deschamps, M., Ksanfomaliti, L. V.  Dollfus, A. Photopolarimetry of
Martian aerosols. II. Limb and terminator measurements. Astron. Astrophys. 158,
247–258 (1986).
40. de Pater, I.  Lissauer, J. J. Planetary Sciences 2nd edn (Cambridge Univ. Press,
2010).
LETTER RESEARCH
Macmillan Publishers Limited. All rights reserved©2015
Extended Data Figure 1 | Images of the 2012 plume event (ringed) on
12–20 March. Dates in March (and authors) are as follows: a, 12 (M.D.);
b, 15 (D. Peach); c–f, 20, plume in rotation (W.J.). Time indicated at top left of
each panel is in UTC.
RESEARCH LETTER
Macmillan Publishers Limited. All rights reserved©2015
Extended Data Figure 2 | Images of the 2012 plume events (ringed) on 22 March and 13 April. a, First event on 22 March, 04:12 UTC (image by W.J.);
b, second event on 13 April, 20:03 UTC (image by D. Peach).
LETTER RESEARCH
Macmillan Publishers Limited. All rights reserved©2015
Extended Data Figure 3 | Images of the 2012 plume event (ringed) at different wavelengths on 21 March. a-c, Images by J.P., d–f, images by D. Parker, with
filters indicated: a, d, B (blue); b, e, G (green); c, f, R (red). Time indicated is in UTC.
RESEARCH LETTER
Macmillan Publishers Limited. All rights reserved©2015
Extended Data Figure 4 | Martian viewing geometry. a, Angle definitions
with the simulated protrusion of altitude H located at point c and out of the
illuminated part of the disk near the limb. b, Top view, taking as a reference the
planet’s terminator and definition of c and a angles when the cloud is on
the equator (but the latitude of the subsolar point is not zero). Green arrows
represent the projected cloud altitude as seen from Earth in the extreme
situations when the cloud is on the terminator and follows the grazing sunlight,
and when it follows the planet’s radius. To simplify the figure, and without
loss of generality, the sub-Earth point is placed on the arc linking the subsolar
point and the cloud base. c, General side view of the geometry of the planet’s
projected shadow.
LETTER RESEARCH
Macmillan Publishers Limited. All rights reserved©2015
Extended Data Figure 5 | Hubble Space Telescope images of the event on
May 17 1997. Wavelengths and times in UTC were: a, 255 nm (17:27);
b, 410nm (17:35); c, 502nm (17:38); d, 588nm (17:50); e, 673nm (17:41);
f, 1,042 nm (17:47); g, Colour composite. Plume ringed in a–f, arrowed in g.
Table at bottom identifies each image and its HST number, and also shows
filters used, giving their central wavelength and bandwidth (FWHM).
RESEARCH LETTER
Macmillan Publishers Limited. All rights reserved©2015
Extended Data Figure 6 | Radiative transfer model fit for the 2012 event.
This is an example of the degeneracy of the model solution due to the narrow
wavelength range covered in the 2012 event. Model fit as follows: solid
lines, CO2; dot-dashed lines, H2O particles; blue, data for an effective radius
reff 5 0.1 mm; red, data for reff 5 1.0mm; stars, wavelengths used in the
calculations. As in Fig. 3, open black triangles show the observed reflectivity of
the 2012 cloud. The error bars represent the average quadratic deviation of the
measured reflectivity in the integration box.
LETTER RESEARCH
Macmillan Publishers Limited. All rights reserved©2015
Extended Data Figure 7 | Assessment of the radiative transfer model fit for
the 1997 event. a–i, Colours show values of x2
(for measured I/F versus model
calculation, colour scale at right) for the effective radius (reff in mm) versus
optical depth (tN at 502 nm), and for different particle types and values of the
indicated particle variance (neff, shown in parentheses) as follows. a, CO2 (0.5);
b, CO2 (1.0); c, CO2 (2.0); d, DST (dust, 0.5); e, DST (dust, 1.0); f, DST
(dust, 2.0); g, H2O (0.5); h, H2O (1.0); and i, H2O (2.0). The calculations are for
a vertical extension of the cloud with D 5 100km, and they provide the
best-fitting values of the whole free parameter space.
RESEARCH LETTER
Macmillan Publishers Limited. All rights reserved©2015
Extended Data Figure 8 | Assessment of the radiative transfer model fit for the 2012 event. As Extended Data Fig. 7 in terms of variables plotted, particle types
and particle variance, but for the 2012 event.
LETTER RESEARCH
Macmillan Publishers Limited. All rights reserved©2015

Weitere ähnliche Inhalte

Was ist angesagt?

The nonmagnetic nucleus_of_comet_67_p_churyumov_gerasimenko
The nonmagnetic nucleus_of_comet_67_p_churyumov_gerasimenkoThe nonmagnetic nucleus_of_comet_67_p_churyumov_gerasimenko
The nonmagnetic nucleus_of_comet_67_p_churyumov_gerasimenkoSérgio Sacani
 
N15. Lucchesi- "fundamental physics with lageos satellites"
N15. Lucchesi- "fundamental physics with lageos satellites"N15. Lucchesi- "fundamental physics with lageos satellites"
N15. Lucchesi- "fundamental physics with lageos satellites"IAPS
 
Low altitude magnetic_field_measurements_by_messenger_reveal_mercury_ancient_...
Low altitude magnetic_field_measurements_by_messenger_reveal_mercury_ancient_...Low altitude magnetic_field_measurements_by_messenger_reveal_mercury_ancient_...
Low altitude magnetic_field_measurements_by_messenger_reveal_mercury_ancient_...Sérgio Sacani
 
Dark side of_comet_67_p_churyumov_gerasiemnko_in_august_october_2014
Dark side of_comet_67_p_churyumov_gerasiemnko_in_august_october_2014Dark side of_comet_67_p_churyumov_gerasiemnko_in_august_october_2014
Dark side of_comet_67_p_churyumov_gerasiemnko_in_august_october_2014Sérgio Sacani
 
A vast thin_plane_of_corotating_dwarf_galaxies_orbiting_the_andromeda_galaxy
A vast thin_plane_of_corotating_dwarf_galaxies_orbiting_the_andromeda_galaxyA vast thin_plane_of_corotating_dwarf_galaxies_orbiting_the_andromeda_galaxy
A vast thin_plane_of_corotating_dwarf_galaxies_orbiting_the_andromeda_galaxySérgio Sacani
 
The messenger mission_to_mercury
The messenger mission_to_mercuryThe messenger mission_to_mercury
The messenger mission_to_mercurySérgio Sacani
 
The independent pulsations of Jupiter’s northern and southern X-ray auroras
The independent pulsations of Jupiter’s northern and southern X-ray aurorasThe independent pulsations of Jupiter’s northern and southern X-ray auroras
The independent pulsations of Jupiter’s northern and southern X-ray aurorasSérgio Sacani
 
Andromeda extended disk_of_dwarfs
Andromeda extended disk_of_dwarfsAndromeda extended disk_of_dwarfs
Andromeda extended disk_of_dwarfsSérgio Sacani
 
Giant magnetized outflows_from_the_centre_of_the_milk_way
Giant magnetized outflows_from_the_centre_of_the_milk_wayGiant magnetized outflows_from_the_centre_of_the_milk_way
Giant magnetized outflows_from_the_centre_of_the_milk_waySérgio Sacani
 
Photometry of Giant Propellers in Saturn's Rings
Photometry of Giant Propellers in Saturn's RingsPhotometry of Giant Propellers in Saturn's Rings
Photometry of Giant Propellers in Saturn's RingsJakaylaRobinson
 
Low surface brightness_imaging_of_the_magellanic_system_imprints_of_tidal_int...
Low surface brightness_imaging_of_the_magellanic_system_imprints_of_tidal_int...Low surface brightness_imaging_of_the_magellanic_system_imprints_of_tidal_int...
Low surface brightness_imaging_of_the_magellanic_system_imprints_of_tidal_int...Sérgio Sacani
 
On the possibility of through passage of asteroid bodies across the Earth’s a...
On the possibility of through passage of asteroid bodies across the Earth’s a...On the possibility of through passage of asteroid bodies across the Earth’s a...
On the possibility of through passage of asteroid bodies across the Earth’s a...Sérgio Sacani
 
Pulsed accretion in_a_variable_protostar
Pulsed accretion in_a_variable_protostarPulsed accretion in_a_variable_protostar
Pulsed accretion in_a_variable_protostarSérgio Sacani
 
Laws of artificial satellites motion (Lecture 1)
Laws of artificial satellites motion (Lecture 1)Laws of artificial satellites motion (Lecture 1)
Laws of artificial satellites motion (Lecture 1)Olexiy Pogurelskiy
 
Jupiter’s interior and deep atmosphere: The initial pole-to-pole passes with ...
Jupiter’s interior and deep atmosphere: The initial pole-to-pole passes with ...Jupiter’s interior and deep atmosphere: The initial pole-to-pole passes with ...
Jupiter’s interior and deep atmosphere: The initial pole-to-pole passes with ...Sérgio Sacani
 
The closest known_flyby_of_a_star_to_the_solar_system
The closest known_flyby_of_a_star_to_the_solar_systemThe closest known_flyby_of_a_star_to_the_solar_system
The closest known_flyby_of_a_star_to_the_solar_systemSérgio Sacani
 
Fisica pau-cyl-2007-2019-gravitacion ordenado (1)
Fisica pau-cyl-2007-2019-gravitacion ordenado (1)Fisica pau-cyl-2007-2019-gravitacion ordenado (1)
Fisica pau-cyl-2007-2019-gravitacion ordenado (1)Inmaculada García Pérez
 
Detection of solar_like_oscillations_in_relies_of_the_milk_way_asteroseismolo...
Detection of solar_like_oscillations_in_relies_of_the_milk_way_asteroseismolo...Detection of solar_like_oscillations_in_relies_of_the_milk_way_asteroseismolo...
Detection of solar_like_oscillations_in_relies_of_the_milk_way_asteroseismolo...Sérgio Sacani
 
The parkes hi zone of avoidance survey
The parkes hi zone of avoidance surveyThe parkes hi zone of avoidance survey
The parkes hi zone of avoidance surveySérgio Sacani
 
The canarias einstein_ring_a_newly_discovered_optical_einstein_ring
The canarias einstein_ring_a_newly_discovered_optical_einstein_ringThe canarias einstein_ring_a_newly_discovered_optical_einstein_ring
The canarias einstein_ring_a_newly_discovered_optical_einstein_ringSérgio Sacani
 

Was ist angesagt? (20)

The nonmagnetic nucleus_of_comet_67_p_churyumov_gerasimenko
The nonmagnetic nucleus_of_comet_67_p_churyumov_gerasimenkoThe nonmagnetic nucleus_of_comet_67_p_churyumov_gerasimenko
The nonmagnetic nucleus_of_comet_67_p_churyumov_gerasimenko
 
N15. Lucchesi- "fundamental physics with lageos satellites"
N15. Lucchesi- "fundamental physics with lageos satellites"N15. Lucchesi- "fundamental physics with lageos satellites"
N15. Lucchesi- "fundamental physics with lageos satellites"
 
Low altitude magnetic_field_measurements_by_messenger_reveal_mercury_ancient_...
Low altitude magnetic_field_measurements_by_messenger_reveal_mercury_ancient_...Low altitude magnetic_field_measurements_by_messenger_reveal_mercury_ancient_...
Low altitude magnetic_field_measurements_by_messenger_reveal_mercury_ancient_...
 
Dark side of_comet_67_p_churyumov_gerasiemnko_in_august_october_2014
Dark side of_comet_67_p_churyumov_gerasiemnko_in_august_october_2014Dark side of_comet_67_p_churyumov_gerasiemnko_in_august_october_2014
Dark side of_comet_67_p_churyumov_gerasiemnko_in_august_october_2014
 
A vast thin_plane_of_corotating_dwarf_galaxies_orbiting_the_andromeda_galaxy
A vast thin_plane_of_corotating_dwarf_galaxies_orbiting_the_andromeda_galaxyA vast thin_plane_of_corotating_dwarf_galaxies_orbiting_the_andromeda_galaxy
A vast thin_plane_of_corotating_dwarf_galaxies_orbiting_the_andromeda_galaxy
 
The messenger mission_to_mercury
The messenger mission_to_mercuryThe messenger mission_to_mercury
The messenger mission_to_mercury
 
The independent pulsations of Jupiter’s northern and southern X-ray auroras
The independent pulsations of Jupiter’s northern and southern X-ray aurorasThe independent pulsations of Jupiter’s northern and southern X-ray auroras
The independent pulsations of Jupiter’s northern and southern X-ray auroras
 
Andromeda extended disk_of_dwarfs
Andromeda extended disk_of_dwarfsAndromeda extended disk_of_dwarfs
Andromeda extended disk_of_dwarfs
 
Giant magnetized outflows_from_the_centre_of_the_milk_way
Giant magnetized outflows_from_the_centre_of_the_milk_wayGiant magnetized outflows_from_the_centre_of_the_milk_way
Giant magnetized outflows_from_the_centre_of_the_milk_way
 
Photometry of Giant Propellers in Saturn's Rings
Photometry of Giant Propellers in Saturn's RingsPhotometry of Giant Propellers in Saturn's Rings
Photometry of Giant Propellers in Saturn's Rings
 
Low surface brightness_imaging_of_the_magellanic_system_imprints_of_tidal_int...
Low surface brightness_imaging_of_the_magellanic_system_imprints_of_tidal_int...Low surface brightness_imaging_of_the_magellanic_system_imprints_of_tidal_int...
Low surface brightness_imaging_of_the_magellanic_system_imprints_of_tidal_int...
 
On the possibility of through passage of asteroid bodies across the Earth’s a...
On the possibility of through passage of asteroid bodies across the Earth’s a...On the possibility of through passage of asteroid bodies across the Earth’s a...
On the possibility of through passage of asteroid bodies across the Earth’s a...
 
Pulsed accretion in_a_variable_protostar
Pulsed accretion in_a_variable_protostarPulsed accretion in_a_variable_protostar
Pulsed accretion in_a_variable_protostar
 
Laws of artificial satellites motion (Lecture 1)
Laws of artificial satellites motion (Lecture 1)Laws of artificial satellites motion (Lecture 1)
Laws of artificial satellites motion (Lecture 1)
 
Jupiter’s interior and deep atmosphere: The initial pole-to-pole passes with ...
Jupiter’s interior and deep atmosphere: The initial pole-to-pole passes with ...Jupiter’s interior and deep atmosphere: The initial pole-to-pole passes with ...
Jupiter’s interior and deep atmosphere: The initial pole-to-pole passes with ...
 
The closest known_flyby_of_a_star_to_the_solar_system
The closest known_flyby_of_a_star_to_the_solar_systemThe closest known_flyby_of_a_star_to_the_solar_system
The closest known_flyby_of_a_star_to_the_solar_system
 
Fisica pau-cyl-2007-2019-gravitacion ordenado (1)
Fisica pau-cyl-2007-2019-gravitacion ordenado (1)Fisica pau-cyl-2007-2019-gravitacion ordenado (1)
Fisica pau-cyl-2007-2019-gravitacion ordenado (1)
 
Detection of solar_like_oscillations_in_relies_of_the_milk_way_asteroseismolo...
Detection of solar_like_oscillations_in_relies_of_the_milk_way_asteroseismolo...Detection of solar_like_oscillations_in_relies_of_the_milk_way_asteroseismolo...
Detection of solar_like_oscillations_in_relies_of_the_milk_way_asteroseismolo...
 
The parkes hi zone of avoidance survey
The parkes hi zone of avoidance surveyThe parkes hi zone of avoidance survey
The parkes hi zone of avoidance survey
 
The canarias einstein_ring_a_newly_discovered_optical_einstein_ring
The canarias einstein_ring_a_newly_discovered_optical_einstein_ringThe canarias einstein_ring_a_newly_discovered_optical_einstein_ring
The canarias einstein_ring_a_newly_discovered_optical_einstein_ring
 

Andere mochten auch

Discovery two embedded_clusters_with_wise_in_the_galactic_latitude_cloud_hrk8...
Discovery two embedded_clusters_with_wise_in_the_galactic_latitude_cloud_hrk8...Discovery two embedded_clusters_with_wise_in_the_galactic_latitude_cloud_hrk8...
Discovery two embedded_clusters_with_wise_in_the_galactic_latitude_cloud_hrk8...Sérgio Sacani
 
Using the inclinations_of_kepler_systems_to_prioritize_new_titius_bode_based_...
Using the inclinations_of_kepler_systems_to_prioritize_new_titius_bode_based_...Using the inclinations_of_kepler_systems_to_prioritize_new_titius_bode_based_...
Using the inclinations_of_kepler_systems_to_prioritize_new_titius_bode_based_...Sérgio Sacani
 
Nasa fy 2016_budget_estimates
Nasa fy 2016_budget_estimatesNasa fy 2016_budget_estimates
Nasa fy 2016_budget_estimatesSérgio Sacani
 
Storm in teacup_a_radio_quiet_quasar_with_radio_emitting_bubbles
Storm in teacup_a_radio_quiet_quasar_with_radio_emitting_bubblesStorm in teacup_a_radio_quiet_quasar_with_radio_emitting_bubbles
Storm in teacup_a_radio_quiet_quasar_with_radio_emitting_bubblesSérgio Sacani
 
Kepler 432b a_massive_warm_jupiter_in_a_52days_eccentric_orbit_transiting_a_g...
Kepler 432b a_massive_warm_jupiter_in_a_52days_eccentric_orbit_transiting_a_g...Kepler 432b a_massive_warm_jupiter_in_a_52days_eccentric_orbit_transiting_a_g...
Kepler 432b a_massive_warm_jupiter_in_a_52days_eccentric_orbit_transiting_a_g...Sérgio Sacani
 
Sobre a entrada_do_brasil_no_eso
Sobre a entrada_do_brasil_no_esoSobre a entrada_do_brasil_no_eso
Sobre a entrada_do_brasil_no_esoSérgio Sacani
 
From globular clusters_to_tidal_dwarfs_structure_formation_in_the_tidal_tails...
From globular clusters_to_tidal_dwarfs_structure_formation_in_the_tidal_tails...From globular clusters_to_tidal_dwarfs_structure_formation_in_the_tidal_tails...
From globular clusters_to_tidal_dwarfs_structure_formation_in_the_tidal_tails...Sérgio Sacani
 
The muse 3_d_view_of_the_hubble_deep_field_south
The muse 3_d_view_of_the_hubble_deep_field_southThe muse 3_d_view_of_the_hubble_deep_field_south
The muse 3_d_view_of_the_hubble_deep_field_southSérgio Sacani
 
Disc dark matter_in_the_galaxy_and_potential_cycles_of_extraterrestrial_impac...
Disc dark matter_in_the_galaxy_and_potential_cycles_of_extraterrestrial_impac...Disc dark matter_in_the_galaxy_and_potential_cycles_of_extraterrestrial_impac...
Disc dark matter_in_the_galaxy_and_potential_cycles_of_extraterrestrial_impac...Sérgio Sacani
 
Remnants of the_sagittarius_dwarf_spheroidal_galaxy_around_the_young_globular...
Remnants of the_sagittarius_dwarf_spheroidal_galaxy_around_the_young_globular...Remnants of the_sagittarius_dwarf_spheroidal_galaxy_around_the_young_globular...
Remnants of the_sagittarius_dwarf_spheroidal_galaxy_around_the_young_globular...Sérgio Sacani
 
Kepler 432b a_massive_planet_in_a_highly_eccentric_orbit_transiting_a_red_giant
Kepler 432b a_massive_planet_in_a_highly_eccentric_orbit_transiting_a_red_giantKepler 432b a_massive_planet_in_a_highly_eccentric_orbit_transiting_a_red_giant
Kepler 432b a_massive_planet_in_a_highly_eccentric_orbit_transiting_a_red_giantSérgio Sacani
 
Black hole feedback_in_the_luminous_quasar_pds_456
Black hole feedback_in_the_luminous_quasar_pds_456Black hole feedback_in_the_luminous_quasar_pds_456
Black hole feedback_in_the_luminous_quasar_pds_456Sérgio Sacani
 
Alma multi line_imaging_of_the_nearby_starburst_ngc_253
Alma multi line_imaging_of_the_nearby_starburst_ngc_253Alma multi line_imaging_of_the_nearby_starburst_ngc_253
Alma multi line_imaging_of_the_nearby_starburst_ngc_253Sérgio Sacani
 
Gravitational lensing by_spinning_black_holes_in_astrophysics_and_in_the_movi...
Gravitational lensing by_spinning_black_holes_in_astrophysics_and_in_the_movi...Gravitational lensing by_spinning_black_holes_in_astrophysics_and_in_the_movi...
Gravitational lensing by_spinning_black_holes_in_astrophysics_and_in_the_movi...Sérgio Sacani
 
An ultraluminous quasar_with_a_twelve_billion_solar_mass_black_hole_at_redshi...
An ultraluminous quasar_with_a_twelve_billion_solar_mass_black_hole_at_redshi...An ultraluminous quasar_with_a_twelve_billion_solar_mass_black_hole_at_redshi...
An ultraluminous quasar_with_a_twelve_billion_solar_mass_black_hole_at_redshi...Sérgio Sacani
 
Cosmology from quantum_potential
Cosmology from quantum_potentialCosmology from quantum_potential
Cosmology from quantum_potentialSérgio Sacani
 
Possible existence of_wormholes_in_the_central_regions_of_halos
Possible existence of_wormholes_in_the_central_regions_of_halosPossible existence of_wormholes_in_the_central_regions_of_halos
Possible existence of_wormholes_in_the_central_regions_of_halosSérgio Sacani
 
An ancient extrasolar_system_with_five_sub_earth_size_planets
An ancient extrasolar_system_with_five_sub_earth_size_planetsAn ancient extrasolar_system_with_five_sub_earth_size_planets
An ancient extrasolar_system_with_five_sub_earth_size_planetsSérgio Sacani
 
Modleing giant extrasolar_ring_systems_in_eclipse_and_the_case_j1407_sculptin...
Modleing giant extrasolar_ring_systems_in_eclipse_and_the_case_j1407_sculptin...Modleing giant extrasolar_ring_systems_in_eclipse_and_the_case_j1407_sculptin...
Modleing giant extrasolar_ring_systems_in_eclipse_and_the_case_j1407_sculptin...Sérgio Sacani
 
The very young_type_ia_supernova_2012cg_discovery_and_early_time_follow_up_ob...
The very young_type_ia_supernova_2012cg_discovery_and_early_time_follow_up_ob...The very young_type_ia_supernova_2012cg_discovery_and_early_time_follow_up_ob...
The very young_type_ia_supernova_2012cg_discovery_and_early_time_follow_up_ob...Sérgio Sacani
 

Andere mochten auch (20)

Discovery two embedded_clusters_with_wise_in_the_galactic_latitude_cloud_hrk8...
Discovery two embedded_clusters_with_wise_in_the_galactic_latitude_cloud_hrk8...Discovery two embedded_clusters_with_wise_in_the_galactic_latitude_cloud_hrk8...
Discovery two embedded_clusters_with_wise_in_the_galactic_latitude_cloud_hrk8...
 
Using the inclinations_of_kepler_systems_to_prioritize_new_titius_bode_based_...
Using the inclinations_of_kepler_systems_to_prioritize_new_titius_bode_based_...Using the inclinations_of_kepler_systems_to_prioritize_new_titius_bode_based_...
Using the inclinations_of_kepler_systems_to_prioritize_new_titius_bode_based_...
 
Nasa fy 2016_budget_estimates
Nasa fy 2016_budget_estimatesNasa fy 2016_budget_estimates
Nasa fy 2016_budget_estimates
 
Storm in teacup_a_radio_quiet_quasar_with_radio_emitting_bubbles
Storm in teacup_a_radio_quiet_quasar_with_radio_emitting_bubblesStorm in teacup_a_radio_quiet_quasar_with_radio_emitting_bubbles
Storm in teacup_a_radio_quiet_quasar_with_radio_emitting_bubbles
 
Kepler 432b a_massive_warm_jupiter_in_a_52days_eccentric_orbit_transiting_a_g...
Kepler 432b a_massive_warm_jupiter_in_a_52days_eccentric_orbit_transiting_a_g...Kepler 432b a_massive_warm_jupiter_in_a_52days_eccentric_orbit_transiting_a_g...
Kepler 432b a_massive_warm_jupiter_in_a_52days_eccentric_orbit_transiting_a_g...
 
Sobre a entrada_do_brasil_no_eso
Sobre a entrada_do_brasil_no_esoSobre a entrada_do_brasil_no_eso
Sobre a entrada_do_brasil_no_eso
 
From globular clusters_to_tidal_dwarfs_structure_formation_in_the_tidal_tails...
From globular clusters_to_tidal_dwarfs_structure_formation_in_the_tidal_tails...From globular clusters_to_tidal_dwarfs_structure_formation_in_the_tidal_tails...
From globular clusters_to_tidal_dwarfs_structure_formation_in_the_tidal_tails...
 
The muse 3_d_view_of_the_hubble_deep_field_south
The muse 3_d_view_of_the_hubble_deep_field_southThe muse 3_d_view_of_the_hubble_deep_field_south
The muse 3_d_view_of_the_hubble_deep_field_south
 
Disc dark matter_in_the_galaxy_and_potential_cycles_of_extraterrestrial_impac...
Disc dark matter_in_the_galaxy_and_potential_cycles_of_extraterrestrial_impac...Disc dark matter_in_the_galaxy_and_potential_cycles_of_extraterrestrial_impac...
Disc dark matter_in_the_galaxy_and_potential_cycles_of_extraterrestrial_impac...
 
Remnants of the_sagittarius_dwarf_spheroidal_galaxy_around_the_young_globular...
Remnants of the_sagittarius_dwarf_spheroidal_galaxy_around_the_young_globular...Remnants of the_sagittarius_dwarf_spheroidal_galaxy_around_the_young_globular...
Remnants of the_sagittarius_dwarf_spheroidal_galaxy_around_the_young_globular...
 
Kepler 432b a_massive_planet_in_a_highly_eccentric_orbit_transiting_a_red_giant
Kepler 432b a_massive_planet_in_a_highly_eccentric_orbit_transiting_a_red_giantKepler 432b a_massive_planet_in_a_highly_eccentric_orbit_transiting_a_red_giant
Kepler 432b a_massive_planet_in_a_highly_eccentric_orbit_transiting_a_red_giant
 
Black hole feedback_in_the_luminous_quasar_pds_456
Black hole feedback_in_the_luminous_quasar_pds_456Black hole feedback_in_the_luminous_quasar_pds_456
Black hole feedback_in_the_luminous_quasar_pds_456
 
Alma multi line_imaging_of_the_nearby_starburst_ngc_253
Alma multi line_imaging_of_the_nearby_starburst_ngc_253Alma multi line_imaging_of_the_nearby_starburst_ngc_253
Alma multi line_imaging_of_the_nearby_starburst_ngc_253
 
Gravitational lensing by_spinning_black_holes_in_astrophysics_and_in_the_movi...
Gravitational lensing by_spinning_black_holes_in_astrophysics_and_in_the_movi...Gravitational lensing by_spinning_black_holes_in_astrophysics_and_in_the_movi...
Gravitational lensing by_spinning_black_holes_in_astrophysics_and_in_the_movi...
 
An ultraluminous quasar_with_a_twelve_billion_solar_mass_black_hole_at_redshi...
An ultraluminous quasar_with_a_twelve_billion_solar_mass_black_hole_at_redshi...An ultraluminous quasar_with_a_twelve_billion_solar_mass_black_hole_at_redshi...
An ultraluminous quasar_with_a_twelve_billion_solar_mass_black_hole_at_redshi...
 
Cosmology from quantum_potential
Cosmology from quantum_potentialCosmology from quantum_potential
Cosmology from quantum_potential
 
Possible existence of_wormholes_in_the_central_regions_of_halos
Possible existence of_wormholes_in_the_central_regions_of_halosPossible existence of_wormholes_in_the_central_regions_of_halos
Possible existence of_wormholes_in_the_central_regions_of_halos
 
An ancient extrasolar_system_with_five_sub_earth_size_planets
An ancient extrasolar_system_with_five_sub_earth_size_planetsAn ancient extrasolar_system_with_five_sub_earth_size_planets
An ancient extrasolar_system_with_five_sub_earth_size_planets
 
Modleing giant extrasolar_ring_systems_in_eclipse_and_the_case_j1407_sculptin...
Modleing giant extrasolar_ring_systems_in_eclipse_and_the_case_j1407_sculptin...Modleing giant extrasolar_ring_systems_in_eclipse_and_the_case_j1407_sculptin...
Modleing giant extrasolar_ring_systems_in_eclipse_and_the_case_j1407_sculptin...
 
The very young_type_ia_supernova_2012cg_discovery_and_early_time_follow_up_ob...
The very young_type_ia_supernova_2012cg_discovery_and_early_time_follow_up_ob...The very young_type_ia_supernova_2012cg_discovery_and_early_time_follow_up_ob...
The very young_type_ia_supernova_2012cg_discovery_and_early_time_follow_up_ob...
 

Ähnlich wie An extremely high_altitude_plume_seen_at_mars_morning_terminator

MONTHLY NOTICES OF THE ROYAL ASTRONOMICAL SOCIETY PUBLICA UN PROYECTO DE INVE...
MONTHLY NOTICES OF THE ROYAL ASTRONOMICAL SOCIETY PUBLICA UN PROYECTO DE INVE...MONTHLY NOTICES OF THE ROYAL ASTRONOMICAL SOCIETY PUBLICA UN PROYECTO DE INVE...
MONTHLY NOTICES OF THE ROYAL ASTRONOMICAL SOCIETY PUBLICA UN PROYECTO DE INVE...Ayuntamiento de Alcalá la Real (Jaén)
 
Uv lunar observatory ana gomez castro
Uv lunar observatory ana gomez castroUv lunar observatory ana gomez castro
Uv lunar observatory ana gomez castroILOAHawaii
 
Cassini vims hyperspectral_observations_of_the_huygens _landing_site_on_titan
Cassini vims hyperspectral_observations_of_the_huygens _landing_site_on_titanCassini vims hyperspectral_observations_of_the_huygens _landing_site_on_titan
Cassini vims hyperspectral_observations_of_the_huygens _landing_site_on_titanSérgio Sacani
 
Stationary waves and slowly moving features in the night upper clouds of Venus
Stationary waves and slowly moving features in the night upper clouds of VenusStationary waves and slowly moving features in the night upper clouds of Venus
Stationary waves and slowly moving features in the night upper clouds of VenusSérgio Sacani
 
Spirals and clumps in V960 Mon: signs of planet formation via gravitational i...
Spirals and clumps in V960 Mon: signs of planet formation via gravitational i...Spirals and clumps in V960 Mon: signs of planet formation via gravitational i...
Spirals and clumps in V960 Mon: signs of planet formation via gravitational i...Sérgio Sacani
 
Seven temperate terrestrial planets around the nearby ultracool dwarf star TR...
Seven temperate terrestrial planets around the nearby ultracool dwarf star TR...Seven temperate terrestrial planets around the nearby ultracool dwarf star TR...
Seven temperate terrestrial planets around the nearby ultracool dwarf star TR...Sérgio Sacani
 
Two super-Earths at the edge of the habitable zone of the nearby M dwarf TOI-...
Two super-Earths at the edge of the habitable zone of the nearby M dwarf TOI-...Two super-Earths at the edge of the habitable zone of the nearby M dwarf TOI-...
Two super-Earths at the edge of the habitable zone of the nearby M dwarf TOI-...Sérgio Sacani
 
A Tectonic Origin for the Largest Marsquake Observed by InSight
A Tectonic Origin for the Largest Marsquake Observed by InSightA Tectonic Origin for the Largest Marsquake Observed by InSight
A Tectonic Origin for the Largest Marsquake Observed by InSightSérgio Sacani
 
Measurements of the_near_nucleus_coma_of_comet_67_p_churyumov_gerasimenko_wit...
Measurements of the_near_nucleus_coma_of_comet_67_p_churyumov_gerasimenko_wit...Measurements of the_near_nucleus_coma_of_comet_67_p_churyumov_gerasimenko_wit...
Measurements of the_near_nucleus_coma_of_comet_67_p_churyumov_gerasimenko_wit...Sérgio Sacani
 
No global pluto_like_atmosphere_on_dwarf_planet_makemake_from_a_stellar_occul...
No global pluto_like_atmosphere_on_dwarf_planet_makemake_from_a_stellar_occul...No global pluto_like_atmosphere_on_dwarf_planet_makemake_from_a_stellar_occul...
No global pluto_like_atmosphere_on_dwarf_planet_makemake_from_a_stellar_occul...Sérgio Sacani
 
Venus cloud discontinuity in 2022 The first long-term study with uninterrupte...
Venus cloud discontinuity in 2022 The first long-term study with uninterrupte...Venus cloud discontinuity in 2022 The first long-term study with uninterrupte...
Venus cloud discontinuity in 2022 The first long-term study with uninterrupte...Sérgio Sacani
 
The operational environment and rotational acceleration of asteroid (101955) ...
The operational environment and rotational acceleration of asteroid (101955) ...The operational environment and rotational acceleration of asteroid (101955) ...
The operational environment and rotational acceleration of asteroid (101955) ...Sérgio Sacani
 
Daily variability of_ceres_albedo_detected_by_m_eans_of_radial_velocities_cha...
Daily variability of_ceres_albedo_detected_by_m_eans_of_radial_velocities_cha...Daily variability of_ceres_albedo_detected_by_m_eans_of_radial_velocities_cha...
Daily variability of_ceres_albedo_detected_by_m_eans_of_radial_velocities_cha...Sérgio Sacani
 
Dust production and_particle_acceleration_in_supernova_1987_a_revealed_with_alma
Dust production and_particle_acceleration_in_supernova_1987_a_revealed_with_almaDust production and_particle_acceleration_in_supernova_1987_a_revealed_with_alma
Dust production and_particle_acceleration_in_supernova_1987_a_revealed_with_almaSérgio Sacani
 
A permanent asymmetric_dust_cloud_around_the_moon
A permanent asymmetric_dust_cloud_around_the_moonA permanent asymmetric_dust_cloud_around_the_moon
A permanent asymmetric_dust_cloud_around_the_moonSérgio Sacani
 
PROBING FOR EVIDENCE OF PLUMES ON EUROPA WITH HST/STIS
PROBING FOR EVIDENCE OF PLUMES ON EUROPA WITH HST/STISPROBING FOR EVIDENCE OF PLUMES ON EUROPA WITH HST/STIS
PROBING FOR EVIDENCE OF PLUMES ON EUROPA WITH HST/STISSérgio Sacani
 
EUV fine structure and variability associated with coronal rain revealed by S...
EUV fine structure and variability associated with coronal rain revealed by S...EUV fine structure and variability associated with coronal rain revealed by S...
EUV fine structure and variability associated with coronal rain revealed by S...Sérgio Sacani
 
A dust obscured_massive_maximum_starburst_galaxy_at_a_redshift_634
A dust obscured_massive_maximum_starburst_galaxy_at_a_redshift_634A dust obscured_massive_maximum_starburst_galaxy_at_a_redshift_634
A dust obscured_massive_maximum_starburst_galaxy_at_a_redshift_634Sérgio Sacani
 
Eso1437a
Eso1437aEso1437a
Eso1437aGOASA
 

Ähnlich wie An extremely high_altitude_plume_seen_at_mars_morning_terminator (20)

MONTHLY NOTICES OF THE ROYAL ASTRONOMICAL SOCIETY PUBLICA UN PROYECTO DE INVE...
MONTHLY NOTICES OF THE ROYAL ASTRONOMICAL SOCIETY PUBLICA UN PROYECTO DE INVE...MONTHLY NOTICES OF THE ROYAL ASTRONOMICAL SOCIETY PUBLICA UN PROYECTO DE INVE...
MONTHLY NOTICES OF THE ROYAL ASTRONOMICAL SOCIETY PUBLICA UN PROYECTO DE INVE...
 
Uv lunar observatory ana gomez castro
Uv lunar observatory ana gomez castroUv lunar observatory ana gomez castro
Uv lunar observatory ana gomez castro
 
Cassini vims hyperspectral_observations_of_the_huygens _landing_site_on_titan
Cassini vims hyperspectral_observations_of_the_huygens _landing_site_on_titanCassini vims hyperspectral_observations_of_the_huygens _landing_site_on_titan
Cassini vims hyperspectral_observations_of_the_huygens _landing_site_on_titan
 
Stationary waves and slowly moving features in the night upper clouds of Venus
Stationary waves and slowly moving features in the night upper clouds of VenusStationary waves and slowly moving features in the night upper clouds of Venus
Stationary waves and slowly moving features in the night upper clouds of Venus
 
Spirals and clumps in V960 Mon: signs of planet formation via gravitational i...
Spirals and clumps in V960 Mon: signs of planet formation via gravitational i...Spirals and clumps in V960 Mon: signs of planet formation via gravitational i...
Spirals and clumps in V960 Mon: signs of planet formation via gravitational i...
 
planets like earth
planets like earthplanets like earth
planets like earth
 
Seven temperate terrestrial planets around the nearby ultracool dwarf star TR...
Seven temperate terrestrial planets around the nearby ultracool dwarf star TR...Seven temperate terrestrial planets around the nearby ultracool dwarf star TR...
Seven temperate terrestrial planets around the nearby ultracool dwarf star TR...
 
Two super-Earths at the edge of the habitable zone of the nearby M dwarf TOI-...
Two super-Earths at the edge of the habitable zone of the nearby M dwarf TOI-...Two super-Earths at the edge of the habitable zone of the nearby M dwarf TOI-...
Two super-Earths at the edge of the habitable zone of the nearby M dwarf TOI-...
 
A Tectonic Origin for the Largest Marsquake Observed by InSight
A Tectonic Origin for the Largest Marsquake Observed by InSightA Tectonic Origin for the Largest Marsquake Observed by InSight
A Tectonic Origin for the Largest Marsquake Observed by InSight
 
Measurements of the_near_nucleus_coma_of_comet_67_p_churyumov_gerasimenko_wit...
Measurements of the_near_nucleus_coma_of_comet_67_p_churyumov_gerasimenko_wit...Measurements of the_near_nucleus_coma_of_comet_67_p_churyumov_gerasimenko_wit...
Measurements of the_near_nucleus_coma_of_comet_67_p_churyumov_gerasimenko_wit...
 
No global pluto_like_atmosphere_on_dwarf_planet_makemake_from_a_stellar_occul...
No global pluto_like_atmosphere_on_dwarf_planet_makemake_from_a_stellar_occul...No global pluto_like_atmosphere_on_dwarf_planet_makemake_from_a_stellar_occul...
No global pluto_like_atmosphere_on_dwarf_planet_makemake_from_a_stellar_occul...
 
Venus cloud discontinuity in 2022 The first long-term study with uninterrupte...
Venus cloud discontinuity in 2022 The first long-term study with uninterrupte...Venus cloud discontinuity in 2022 The first long-term study with uninterrupte...
Venus cloud discontinuity in 2022 The first long-term study with uninterrupte...
 
The operational environment and rotational acceleration of asteroid (101955) ...
The operational environment and rotational acceleration of asteroid (101955) ...The operational environment and rotational acceleration of asteroid (101955) ...
The operational environment and rotational acceleration of asteroid (101955) ...
 
Daily variability of_ceres_albedo_detected_by_m_eans_of_radial_velocities_cha...
Daily variability of_ceres_albedo_detected_by_m_eans_of_radial_velocities_cha...Daily variability of_ceres_albedo_detected_by_m_eans_of_radial_velocities_cha...
Daily variability of_ceres_albedo_detected_by_m_eans_of_radial_velocities_cha...
 
Dust production and_particle_acceleration_in_supernova_1987_a_revealed_with_alma
Dust production and_particle_acceleration_in_supernova_1987_a_revealed_with_almaDust production and_particle_acceleration_in_supernova_1987_a_revealed_with_alma
Dust production and_particle_acceleration_in_supernova_1987_a_revealed_with_alma
 
A permanent asymmetric_dust_cloud_around_the_moon
A permanent asymmetric_dust_cloud_around_the_moonA permanent asymmetric_dust_cloud_around_the_moon
A permanent asymmetric_dust_cloud_around_the_moon
 
PROBING FOR EVIDENCE OF PLUMES ON EUROPA WITH HST/STIS
PROBING FOR EVIDENCE OF PLUMES ON EUROPA WITH HST/STISPROBING FOR EVIDENCE OF PLUMES ON EUROPA WITH HST/STIS
PROBING FOR EVIDENCE OF PLUMES ON EUROPA WITH HST/STIS
 
EUV fine structure and variability associated with coronal rain revealed by S...
EUV fine structure and variability associated with coronal rain revealed by S...EUV fine structure and variability associated with coronal rain revealed by S...
EUV fine structure and variability associated with coronal rain revealed by S...
 
A dust obscured_massive_maximum_starburst_galaxy_at_a_redshift_634
A dust obscured_massive_maximum_starburst_galaxy_at_a_redshift_634A dust obscured_massive_maximum_starburst_galaxy_at_a_redshift_634
A dust obscured_massive_maximum_starburst_galaxy_at_a_redshift_634
 
Eso1437a
Eso1437aEso1437a
Eso1437a
 

Mehr von Sérgio Sacani

Asymmetry in the atmosphere of the ultra-hot Jupiter WASP-76 b
Asymmetry in the atmosphere of the ultra-hot Jupiter WASP-76 bAsymmetry in the atmosphere of the ultra-hot Jupiter WASP-76 b
Asymmetry in the atmosphere of the ultra-hot Jupiter WASP-76 bSérgio Sacani
 
Formation of low mass protostars and their circumstellar disks
Formation of low mass protostars and their circumstellar disksFormation of low mass protostars and their circumstellar disks
Formation of low mass protostars and their circumstellar disksSérgio Sacani
 
Nightside clouds and disequilibrium chemistry on the hot Jupiter WASP-43b
Nightside clouds and disequilibrium chemistry on the hot Jupiter WASP-43bNightside clouds and disequilibrium chemistry on the hot Jupiter WASP-43b
Nightside clouds and disequilibrium chemistry on the hot Jupiter WASP-43bSérgio Sacani
 
Discovery of an Accretion Streamer and a Slow Wide-angle Outflow around FUOri...
Discovery of an Accretion Streamer and a Slow Wide-angle Outflow around FUOri...Discovery of an Accretion Streamer and a Slow Wide-angle Outflow around FUOri...
Discovery of an Accretion Streamer and a Slow Wide-angle Outflow around FUOri...Sérgio Sacani
 
Disentangling the origin of chemical differences using GHOST
Disentangling the origin of chemical differences using GHOSTDisentangling the origin of chemical differences using GHOST
Disentangling the origin of chemical differences using GHOSTSérgio Sacani
 
All-domain Anomaly Resolution Office U.S. Department of Defense (U) Case: “Eg...
All-domain Anomaly Resolution Office U.S. Department of Defense (U) Case: “Eg...All-domain Anomaly Resolution Office U.S. Department of Defense (U) Case: “Eg...
All-domain Anomaly Resolution Office U.S. Department of Defense (U) Case: “Eg...Sérgio Sacani
 
PossibleEoarcheanRecordsoftheGeomagneticFieldPreservedintheIsuaSupracrustalBe...
PossibleEoarcheanRecordsoftheGeomagneticFieldPreservedintheIsuaSupracrustalBe...PossibleEoarcheanRecordsoftheGeomagneticFieldPreservedintheIsuaSupracrustalBe...
PossibleEoarcheanRecordsoftheGeomagneticFieldPreservedintheIsuaSupracrustalBe...Sérgio Sacani
 
Isotopic evidence of long-lived volcanism on Io
Isotopic evidence of long-lived volcanism on IoIsotopic evidence of long-lived volcanism on Io
Isotopic evidence of long-lived volcanism on IoSérgio Sacani
 
Hubble Asteroid Hunter III. Physical properties of newly found asteroids
Hubble Asteroid Hunter III. Physical properties of newly found asteroidsHubble Asteroid Hunter III. Physical properties of newly found asteroids
Hubble Asteroid Hunter III. Physical properties of newly found asteroidsSérgio Sacani
 
Observational constraints on mergers creating magnetism in massive stars
Observational constraints on mergers creating magnetism in massive starsObservational constraints on mergers creating magnetism in massive stars
Observational constraints on mergers creating magnetism in massive starsSérgio Sacani
 
Observation of Gravitational Waves from the Coalescence of a 2.5–4.5 M⊙ Compa...
Observation of Gravitational Waves from the Coalescence of a 2.5–4.5 M⊙ Compa...Observation of Gravitational Waves from the Coalescence of a 2.5–4.5 M⊙ Compa...
Observation of Gravitational Waves from the Coalescence of a 2.5–4.5 M⊙ Compa...Sérgio Sacani
 
The SAMI Galaxy Sur v ey: galaxy spin is more strongly correlated with stella...
The SAMI Galaxy Sur v ey: galaxy spin is more strongly correlated with stella...The SAMI Galaxy Sur v ey: galaxy spin is more strongly correlated with stella...
The SAMI Galaxy Sur v ey: galaxy spin is more strongly correlated with stella...Sérgio Sacani
 
Is Betelgeuse Really Rotating? Synthetic ALMA Observations of Large-scale Con...
Is Betelgeuse Really Rotating? Synthetic ALMA Observations of Large-scale Con...Is Betelgeuse Really Rotating? Synthetic ALMA Observations of Large-scale Con...
Is Betelgeuse Really Rotating? Synthetic ALMA Observations of Large-scale Con...Sérgio Sacani
 
First Direct Imaging of a Kelvin–Helmholtz Instability by PSP/WISPR
First Direct Imaging of a Kelvin–Helmholtz Instability by PSP/WISPRFirst Direct Imaging of a Kelvin–Helmholtz Instability by PSP/WISPR
First Direct Imaging of a Kelvin–Helmholtz Instability by PSP/WISPRSérgio Sacani
 
The Sun’s differential rotation is controlled by high- latitude baroclinicall...
The Sun’s differential rotation is controlled by high- latitude baroclinicall...The Sun’s differential rotation is controlled by high- latitude baroclinicall...
The Sun’s differential rotation is controlled by high- latitude baroclinicall...Sérgio Sacani
 
Hydrogen Column Density Variability in a Sample of Local Compton-Thin AGN
Hydrogen Column Density Variability in a Sample of Local Compton-Thin AGNHydrogen Column Density Variability in a Sample of Local Compton-Thin AGN
Hydrogen Column Density Variability in a Sample of Local Compton-Thin AGNSérgio Sacani
 
Huygens - Exploring Titan A Mysterious World
Huygens - Exploring Titan A Mysterious WorldHuygens - Exploring Titan A Mysterious World
Huygens - Exploring Titan A Mysterious WorldSérgio Sacani
 
The Radcliffe Wave Of Milk Way is oscillating
The Radcliffe Wave Of Milk Way  is oscillatingThe Radcliffe Wave Of Milk Way  is oscillating
The Radcliffe Wave Of Milk Way is oscillatingSérgio Sacani
 
Thermonuclear explosions on neutron stars reveal the speed of their jets
Thermonuclear explosions on neutron stars reveal the speed of their jetsThermonuclear explosions on neutron stars reveal the speed of their jets
Thermonuclear explosions on neutron stars reveal the speed of their jetsSérgio Sacani
 
Identification of Superclusters and Their Properties in the Sloan Digital Sky...
Identification of Superclusters and Their Properties in the Sloan Digital Sky...Identification of Superclusters and Their Properties in the Sloan Digital Sky...
Identification of Superclusters and Their Properties in the Sloan Digital Sky...Sérgio Sacani
 

Mehr von Sérgio Sacani (20)

Asymmetry in the atmosphere of the ultra-hot Jupiter WASP-76 b
Asymmetry in the atmosphere of the ultra-hot Jupiter WASP-76 bAsymmetry in the atmosphere of the ultra-hot Jupiter WASP-76 b
Asymmetry in the atmosphere of the ultra-hot Jupiter WASP-76 b
 
Formation of low mass protostars and their circumstellar disks
Formation of low mass protostars and their circumstellar disksFormation of low mass protostars and their circumstellar disks
Formation of low mass protostars and their circumstellar disks
 
Nightside clouds and disequilibrium chemistry on the hot Jupiter WASP-43b
Nightside clouds and disequilibrium chemistry on the hot Jupiter WASP-43bNightside clouds and disequilibrium chemistry on the hot Jupiter WASP-43b
Nightside clouds and disequilibrium chemistry on the hot Jupiter WASP-43b
 
Discovery of an Accretion Streamer and a Slow Wide-angle Outflow around FUOri...
Discovery of an Accretion Streamer and a Slow Wide-angle Outflow around FUOri...Discovery of an Accretion Streamer and a Slow Wide-angle Outflow around FUOri...
Discovery of an Accretion Streamer and a Slow Wide-angle Outflow around FUOri...
 
Disentangling the origin of chemical differences using GHOST
Disentangling the origin of chemical differences using GHOSTDisentangling the origin of chemical differences using GHOST
Disentangling the origin of chemical differences using GHOST
 
All-domain Anomaly Resolution Office U.S. Department of Defense (U) Case: “Eg...
All-domain Anomaly Resolution Office U.S. Department of Defense (U) Case: “Eg...All-domain Anomaly Resolution Office U.S. Department of Defense (U) Case: “Eg...
All-domain Anomaly Resolution Office U.S. Department of Defense (U) Case: “Eg...
 
PossibleEoarcheanRecordsoftheGeomagneticFieldPreservedintheIsuaSupracrustalBe...
PossibleEoarcheanRecordsoftheGeomagneticFieldPreservedintheIsuaSupracrustalBe...PossibleEoarcheanRecordsoftheGeomagneticFieldPreservedintheIsuaSupracrustalBe...
PossibleEoarcheanRecordsoftheGeomagneticFieldPreservedintheIsuaSupracrustalBe...
 
Isotopic evidence of long-lived volcanism on Io
Isotopic evidence of long-lived volcanism on IoIsotopic evidence of long-lived volcanism on Io
Isotopic evidence of long-lived volcanism on Io
 
Hubble Asteroid Hunter III. Physical properties of newly found asteroids
Hubble Asteroid Hunter III. Physical properties of newly found asteroidsHubble Asteroid Hunter III. Physical properties of newly found asteroids
Hubble Asteroid Hunter III. Physical properties of newly found asteroids
 
Observational constraints on mergers creating magnetism in massive stars
Observational constraints on mergers creating magnetism in massive starsObservational constraints on mergers creating magnetism in massive stars
Observational constraints on mergers creating magnetism in massive stars
 
Observation of Gravitational Waves from the Coalescence of a 2.5–4.5 M⊙ Compa...
Observation of Gravitational Waves from the Coalescence of a 2.5–4.5 M⊙ Compa...Observation of Gravitational Waves from the Coalescence of a 2.5–4.5 M⊙ Compa...
Observation of Gravitational Waves from the Coalescence of a 2.5–4.5 M⊙ Compa...
 
The SAMI Galaxy Sur v ey: galaxy spin is more strongly correlated with stella...
The SAMI Galaxy Sur v ey: galaxy spin is more strongly correlated with stella...The SAMI Galaxy Sur v ey: galaxy spin is more strongly correlated with stella...
The SAMI Galaxy Sur v ey: galaxy spin is more strongly correlated with stella...
 
Is Betelgeuse Really Rotating? Synthetic ALMA Observations of Large-scale Con...
Is Betelgeuse Really Rotating? Synthetic ALMA Observations of Large-scale Con...Is Betelgeuse Really Rotating? Synthetic ALMA Observations of Large-scale Con...
Is Betelgeuse Really Rotating? Synthetic ALMA Observations of Large-scale Con...
 
First Direct Imaging of a Kelvin–Helmholtz Instability by PSP/WISPR
First Direct Imaging of a Kelvin–Helmholtz Instability by PSP/WISPRFirst Direct Imaging of a Kelvin–Helmholtz Instability by PSP/WISPR
First Direct Imaging of a Kelvin–Helmholtz Instability by PSP/WISPR
 
The Sun’s differential rotation is controlled by high- latitude baroclinicall...
The Sun’s differential rotation is controlled by high- latitude baroclinicall...The Sun’s differential rotation is controlled by high- latitude baroclinicall...
The Sun’s differential rotation is controlled by high- latitude baroclinicall...
 
Hydrogen Column Density Variability in a Sample of Local Compton-Thin AGN
Hydrogen Column Density Variability in a Sample of Local Compton-Thin AGNHydrogen Column Density Variability in a Sample of Local Compton-Thin AGN
Hydrogen Column Density Variability in a Sample of Local Compton-Thin AGN
 
Huygens - Exploring Titan A Mysterious World
Huygens - Exploring Titan A Mysterious WorldHuygens - Exploring Titan A Mysterious World
Huygens - Exploring Titan A Mysterious World
 
The Radcliffe Wave Of Milk Way is oscillating
The Radcliffe Wave Of Milk Way  is oscillatingThe Radcliffe Wave Of Milk Way  is oscillating
The Radcliffe Wave Of Milk Way is oscillating
 
Thermonuclear explosions on neutron stars reveal the speed of their jets
Thermonuclear explosions on neutron stars reveal the speed of their jetsThermonuclear explosions on neutron stars reveal the speed of their jets
Thermonuclear explosions on neutron stars reveal the speed of their jets
 
Identification of Superclusters and Their Properties in the Sloan Digital Sky...
Identification of Superclusters and Their Properties in the Sloan Digital Sky...Identification of Superclusters and Their Properties in the Sloan Digital Sky...
Identification of Superclusters and Their Properties in the Sloan Digital Sky...
 

Kürzlich hochgeladen

Recombinant DNA technology (Immunological screening)
Recombinant DNA technology (Immunological screening)Recombinant DNA technology (Immunological screening)
Recombinant DNA technology (Immunological screening)PraveenaKalaiselvan1
 
Presentation Vikram Lander by Vedansh Gupta.pptx
Presentation Vikram Lander by Vedansh Gupta.pptxPresentation Vikram Lander by Vedansh Gupta.pptx
Presentation Vikram Lander by Vedansh Gupta.pptxgindu3009
 
Recombination DNA Technology (Nucleic Acid Hybridization )
Recombination DNA Technology (Nucleic Acid Hybridization )Recombination DNA Technology (Nucleic Acid Hybridization )
Recombination DNA Technology (Nucleic Acid Hybridization )aarthirajkumar25
 
Pests of cotton_Borer_Pests_Binomics_Dr.UPR.pdf
Pests of cotton_Borer_Pests_Binomics_Dr.UPR.pdfPests of cotton_Borer_Pests_Binomics_Dr.UPR.pdf
Pests of cotton_Borer_Pests_Binomics_Dr.UPR.pdfPirithiRaju
 
GBSN - Biochemistry (Unit 1)
GBSN - Biochemistry (Unit 1)GBSN - Biochemistry (Unit 1)
GBSN - Biochemistry (Unit 1)Areesha Ahmad
 
Hire 💕 9907093804 Hooghly Call Girls Service Call Girls Agency
Hire 💕 9907093804 Hooghly Call Girls Service Call Girls AgencyHire 💕 9907093804 Hooghly Call Girls Service Call Girls Agency
Hire 💕 9907093804 Hooghly Call Girls Service Call Girls AgencySheetal Arora
 
Green chemistry and Sustainable development.pptx
Green chemistry  and Sustainable development.pptxGreen chemistry  and Sustainable development.pptx
Green chemistry and Sustainable development.pptxRajatChauhan518211
 
VIRUSES structure and classification ppt by Dr.Prince C P
VIRUSES structure and classification ppt by Dr.Prince C PVIRUSES structure and classification ppt by Dr.Prince C P
VIRUSES structure and classification ppt by Dr.Prince C PPRINCE C P
 
Natural Polymer Based Nanomaterials
Natural Polymer Based NanomaterialsNatural Polymer Based Nanomaterials
Natural Polymer Based NanomaterialsAArockiyaNisha
 
Cultivation of KODO MILLET . made by Ghanshyam pptx
Cultivation of KODO MILLET . made by Ghanshyam pptxCultivation of KODO MILLET . made by Ghanshyam pptx
Cultivation of KODO MILLET . made by Ghanshyam pptxpradhanghanshyam7136
 
Chromatin Structure | EUCHROMATIN | HETEROCHROMATIN
Chromatin Structure | EUCHROMATIN | HETEROCHROMATINChromatin Structure | EUCHROMATIN | HETEROCHROMATIN
Chromatin Structure | EUCHROMATIN | HETEROCHROMATINsankalpkumarsahoo174
 
STERILITY TESTING OF PHARMACEUTICALS ppt by DR.C.P.PRINCE
STERILITY TESTING OF PHARMACEUTICALS ppt by DR.C.P.PRINCESTERILITY TESTING OF PHARMACEUTICALS ppt by DR.C.P.PRINCE
STERILITY TESTING OF PHARMACEUTICALS ppt by DR.C.P.PRINCEPRINCE C P
 
Labelling Requirements and Label Claims for Dietary Supplements and Recommend...
Labelling Requirements and Label Claims for Dietary Supplements and Recommend...Labelling Requirements and Label Claims for Dietary Supplements and Recommend...
Labelling Requirements and Label Claims for Dietary Supplements and Recommend...Lokesh Kothari
 
Raman spectroscopy.pptx M Pharm, M Sc, Advanced Spectral Analysis
Raman spectroscopy.pptx M Pharm, M Sc, Advanced Spectral AnalysisRaman spectroscopy.pptx M Pharm, M Sc, Advanced Spectral Analysis
Raman spectroscopy.pptx M Pharm, M Sc, Advanced Spectral AnalysisDiwakar Mishra
 
Lucknow 💋 Russian Call Girls Lucknow Finest Escorts Service 8923113531 Availa...
Lucknow 💋 Russian Call Girls Lucknow Finest Escorts Service 8923113531 Availa...Lucknow 💋 Russian Call Girls Lucknow Finest Escorts Service 8923113531 Availa...
Lucknow 💋 Russian Call Girls Lucknow Finest Escorts Service 8923113531 Availa...anilsa9823
 
Stunning ➥8448380779▻ Call Girls In Panchshil Enclave Delhi NCR
Stunning ➥8448380779▻ Call Girls In Panchshil Enclave Delhi NCRStunning ➥8448380779▻ Call Girls In Panchshil Enclave Delhi NCR
Stunning ➥8448380779▻ Call Girls In Panchshil Enclave Delhi NCRDelhi Call girls
 
Biopesticide (2).pptx .This slides helps to know the different types of biop...
Biopesticide (2).pptx  .This slides helps to know the different types of biop...Biopesticide (2).pptx  .This slides helps to know the different types of biop...
Biopesticide (2).pptx .This slides helps to know the different types of biop...RohitNehra6
 
Nanoparticles synthesis and characterization​ ​
Nanoparticles synthesis and characterization​  ​Nanoparticles synthesis and characterization​  ​
Nanoparticles synthesis and characterization​ ​kaibalyasahoo82800
 
Unlocking the Potential: Deep dive into ocean of Ceramic Magnets.pptx
Unlocking  the Potential: Deep dive into ocean of Ceramic Magnets.pptxUnlocking  the Potential: Deep dive into ocean of Ceramic Magnets.pptx
Unlocking the Potential: Deep dive into ocean of Ceramic Magnets.pptxanandsmhk
 

Kürzlich hochgeladen (20)

Recombinant DNA technology (Immunological screening)
Recombinant DNA technology (Immunological screening)Recombinant DNA technology (Immunological screening)
Recombinant DNA technology (Immunological screening)
 
Presentation Vikram Lander by Vedansh Gupta.pptx
Presentation Vikram Lander by Vedansh Gupta.pptxPresentation Vikram Lander by Vedansh Gupta.pptx
Presentation Vikram Lander by Vedansh Gupta.pptx
 
Recombination DNA Technology (Nucleic Acid Hybridization )
Recombination DNA Technology (Nucleic Acid Hybridization )Recombination DNA Technology (Nucleic Acid Hybridization )
Recombination DNA Technology (Nucleic Acid Hybridization )
 
Pests of cotton_Borer_Pests_Binomics_Dr.UPR.pdf
Pests of cotton_Borer_Pests_Binomics_Dr.UPR.pdfPests of cotton_Borer_Pests_Binomics_Dr.UPR.pdf
Pests of cotton_Borer_Pests_Binomics_Dr.UPR.pdf
 
GBSN - Biochemistry (Unit 1)
GBSN - Biochemistry (Unit 1)GBSN - Biochemistry (Unit 1)
GBSN - Biochemistry (Unit 1)
 
Hire 💕 9907093804 Hooghly Call Girls Service Call Girls Agency
Hire 💕 9907093804 Hooghly Call Girls Service Call Girls AgencyHire 💕 9907093804 Hooghly Call Girls Service Call Girls Agency
Hire 💕 9907093804 Hooghly Call Girls Service Call Girls Agency
 
Green chemistry and Sustainable development.pptx
Green chemistry  and Sustainable development.pptxGreen chemistry  and Sustainable development.pptx
Green chemistry and Sustainable development.pptx
 
VIRUSES structure and classification ppt by Dr.Prince C P
VIRUSES structure and classification ppt by Dr.Prince C PVIRUSES structure and classification ppt by Dr.Prince C P
VIRUSES structure and classification ppt by Dr.Prince C P
 
Natural Polymer Based Nanomaterials
Natural Polymer Based NanomaterialsNatural Polymer Based Nanomaterials
Natural Polymer Based Nanomaterials
 
Cultivation of KODO MILLET . made by Ghanshyam pptx
Cultivation of KODO MILLET . made by Ghanshyam pptxCultivation of KODO MILLET . made by Ghanshyam pptx
Cultivation of KODO MILLET . made by Ghanshyam pptx
 
Chromatin Structure | EUCHROMATIN | HETEROCHROMATIN
Chromatin Structure | EUCHROMATIN | HETEROCHROMATINChromatin Structure | EUCHROMATIN | HETEROCHROMATIN
Chromatin Structure | EUCHROMATIN | HETEROCHROMATIN
 
STERILITY TESTING OF PHARMACEUTICALS ppt by DR.C.P.PRINCE
STERILITY TESTING OF PHARMACEUTICALS ppt by DR.C.P.PRINCESTERILITY TESTING OF PHARMACEUTICALS ppt by DR.C.P.PRINCE
STERILITY TESTING OF PHARMACEUTICALS ppt by DR.C.P.PRINCE
 
Labelling Requirements and Label Claims for Dietary Supplements and Recommend...
Labelling Requirements and Label Claims for Dietary Supplements and Recommend...Labelling Requirements and Label Claims for Dietary Supplements and Recommend...
Labelling Requirements and Label Claims for Dietary Supplements and Recommend...
 
Raman spectroscopy.pptx M Pharm, M Sc, Advanced Spectral Analysis
Raman spectroscopy.pptx M Pharm, M Sc, Advanced Spectral AnalysisRaman spectroscopy.pptx M Pharm, M Sc, Advanced Spectral Analysis
Raman spectroscopy.pptx M Pharm, M Sc, Advanced Spectral Analysis
 
Lucknow 💋 Russian Call Girls Lucknow Finest Escorts Service 8923113531 Availa...
Lucknow 💋 Russian Call Girls Lucknow Finest Escorts Service 8923113531 Availa...Lucknow 💋 Russian Call Girls Lucknow Finest Escorts Service 8923113531 Availa...
Lucknow 💋 Russian Call Girls Lucknow Finest Escorts Service 8923113531 Availa...
 
Stunning ➥8448380779▻ Call Girls In Panchshil Enclave Delhi NCR
Stunning ➥8448380779▻ Call Girls In Panchshil Enclave Delhi NCRStunning ➥8448380779▻ Call Girls In Panchshil Enclave Delhi NCR
Stunning ➥8448380779▻ Call Girls In Panchshil Enclave Delhi NCR
 
Biopesticide (2).pptx .This slides helps to know the different types of biop...
Biopesticide (2).pptx  .This slides helps to know the different types of biop...Biopesticide (2).pptx  .This slides helps to know the different types of biop...
Biopesticide (2).pptx .This slides helps to know the different types of biop...
 
Nanoparticles synthesis and characterization​ ​
Nanoparticles synthesis and characterization​  ​Nanoparticles synthesis and characterization​  ​
Nanoparticles synthesis and characterization​ ​
 
CELL -Structural and Functional unit of life.pdf
CELL -Structural and Functional unit of life.pdfCELL -Structural and Functional unit of life.pdf
CELL -Structural and Functional unit of life.pdf
 
Unlocking the Potential: Deep dive into ocean of Ceramic Magnets.pptx
Unlocking  the Potential: Deep dive into ocean of Ceramic Magnets.pptxUnlocking  the Potential: Deep dive into ocean of Ceramic Magnets.pptx
Unlocking the Potential: Deep dive into ocean of Ceramic Magnets.pptx
 

An extremely high_altitude_plume_seen_at_mars_morning_terminator

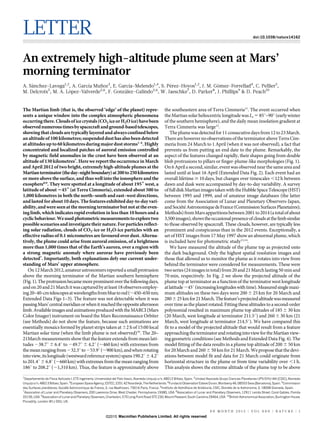
  • 1. LETTER doi:10.1038/nature14162 An extremely high-altitude plume seen at Mars’ morning terminator A. Sa´nchez-Lavega1,2 , A. Garcı´a Mun˜oz3 , E. Garcı´a-Melendo1,4 , S. Pe´rez-Hoyos1,2 , J. M. Go´mez-Forrellad4 , C. Pellier5 , M. Delcroix5 , M. A. Lo´pez-Valverde2,6 , F. Gonza´lez-Galindo2,6 , W. Jaeschke7 , D. Parker8 , J. Phillips9 & D. Peach10 The Martian limb (that is, the observed ‘edge’ of the planet) repre- sents a unique window into the complex atmospheric phenomena occurringthere.Cloudsoficecrystals(CO2 iceorH2Oice)havebeen observednumeroustimesbyspacecraftandground-basedtelescopes, showingthat clouds are typically layered and alwaysconfined below analtitudeof 100 kilometres;suspendeddusthasalso been detected at altitudes up to 60 kilometres duringmajor dust storms1–6 . Highly concentrated and localized patches of auroral emission controlled by magnetic field anomalies in the crust have been observed at an altitude of 130 kilometres7 . Here we report the occurrence in March and April 2012 of two bright, extremely high-altitude plumes at the Martianterminator(theday–nightboundary)at200to250kilometres or more above the surface, and thus well into the ionosphere and the exosphere8,9 . They were spotted at a longitude of about 1956 west, a latitude of about 2456 (at Terra Cimmeria), extended about 500 to 1,000 kilometres in both the north–south and east–west directions, and lasted for about 10 days. The features exhibited day-to-day vari- ability,andwereseenat the morningterminatorbutnotat the even- ing limb, which indicates rapid evolution in less than 10 hours and a cyclicbehaviour.Weusedphotometricmeasurementstoexploretwo possible scenarios and investigate their nature.For particles reflect- ing solar radiation, clouds of CO2-ice or H2O-ice particles with an effective radius of 0.1 micrometres are favoured over dust. Alterna- tively, the plume could arise from auroral emission, of a brightness more than 1,000 times that of the Earth’s aurora, over a region with a strong magnetic anomaly where aurorae have previously been detected7 . Importantly, both explanations defy our current under- standing of Mars’ upper atmosphere. On12March2012,amateurastronomersreportedasmallprotrusion above the morning terminator of the Martian southern hemisphere (Fig.1).Theprotrusionbecamemoreprominentoverthefollowingdays, andon20and21Marchitwascapturedbyatleast18observersemploy- ing20–40-cmtelescopesatwavelengthsfrombluetored(,450–650 nm; Extended Data Figs 1–3). The feature was not detectable when it was passingMars’centralmeridianorwhenitreachedtheoppositeafternoon limb.AvailableimagesandanimationsproducedwiththeMARCI(Mars Color Imager) instrument on board the Mars Reconnaissance Orbiter (see Methods) do not show the feature, because such animations are essentially mosaics formed by planet strips taken at 62 h of 15:00 local Martian solar time (when the limb plume is not observed)10 . The 20– 21March measurements show that the feature extends from mean lati- tudes 238.7u 6 6.4u to 249.7u 6 4.2u (,460 km) with extremes from themeanrangingfrom232.3uto253.9u(,900 km),andwhenrotating intoview,itslongitude(westwardreferencesystem)spans190.2u 64.2u to201.4u6 6.8u (,660 km) withextremes fromthe mean ranging from 186u to 208.2u (,1,310 km). Thus, the feature is approximately above the southeastern area of Terra Cimmeria11 . The event occurred when theMartiansolarheliocentriclongitudewas Ls 5 85u–90u(earlywinter of the southern hemisphere), and the daily mean insolation gradient at Terra Cimmeria was large12 . Theplumewasdetectedfor11consecutivedaysfrom12to23March. Therearehoweverno observations of the terminator aboveTerra Cim- meria from 24 March to 1 April (when it was not observed), a fact that prevents us from putting an end date to the plume. Remarkably, the aspect of the features changed rapidly, their shapes going from double blob protrusions to pillars or finger-plume-like morphologies (Fig. 1). On6 Aprilasecond,similar,eventwasobservednearthesameareaand lasted until at least 16 April (Extended Data Fig. 2). Each event had an overall lifetime $ 10 days, but changes over timescales ,12 h between dawn and dusk were accompanied by day-to-day variability. A survey offulldiskMartianimagestakenwiththeHubbleSpaceTelescope(HST) between 1995 and 1999, and of amateur image databases (the latter come from the Association of Lunar and Planetary Observers-Japan, andSocie´te´AstronomiquedeFrance(CommissionSurfacesPlanetaires); Methods)fromMarsapparitionsbetween2001to2014(atotalofabout 3,500images),showstheoccasionalpresenceofcloudsatthelimbsimilar to those observed by spacecraft. These clouds, however, are typically less prominent and conspicuous than in the 2012 events. Exceptionally, a set of HST images from 17 May 1997 show an abnormal plume, which is included here for photometric study13,14 . We have measured the altitude of the plume top as projected onto the dark background. Only the highest spatial resolution images and those that allowed us to monitor the plume as it rotates into view from behind the terminator were considered for measurements. These were twoseries(24 imagesintotal)from20and21Marchlasting50 minand 70 min, respectively. In Fig. 2 we show the projected altitude of the plume top at terminator as a function of the terminator west longitude atlatitude245u(increasinglongitudeswithtime).Measuredsinglemaxi- mum altitudes on these two days were 200 6 25 km for 20 March and 2806 25 kmfor21March.Thefeature’sprojectedaltitudewasmeasured over time as the planet rotated. Fitting these altitudes to a second-order polynomial resulted in maximum plume top altitudes of 185 6 30 km (20 March, west longitude at terminator 211.5u) and 260 6 30 km (21 March, west longitude at terminator 214.5u). We have compared this fit to a model of the projected altitude that would result from a feature approachingtheterminatorandrotatingintoviewfortheMartianview- ing geometric conditions (see Methods and Extended Data Fig. 4). The model fitting of the data results in a plume top altitude of 200 6 50 km for20Marchand260 6 50 kmfor21March.Weproposethat the devi- ations between model fit and data for 21 March could originate from horizontal structure in the plume or from time variability over ,1 h. This analysis shows the extreme altitude of the plume top to be above 1 Departamento de Fı´sica Aplicada I, ETS Ingenierı´a, Universidad del Paı´s Vasco, Alameda Urquijo s/n, 48013 Bilbao, Spain. 2 Unidad Asociada Grupo Ciencias Planetarias UPV/EHU-IAA (CSIC), Alameda Urquijo s/n, 48013 Bilbao, Spain. 3 European Space Agency, ESTEC, 2201 AZ Noordwijk, The Netherlands. 4 Fundacio´ Observatori Esteve Duran, Montseny 46, 08553 Seva (Barcelona), Spain. 5 Commission des Surfaces plane´taires, Socie´te´ Astronomique de France, 3, rue Beethoven, 75016 Paris, France. 6 Instituto de Astrofı´sica de Andalucı´a, CSIC, Glorieta de la Astronomia, 3, 18008 Granada, Spain. 7 Association of Lunar and Planetary Observers, 200 Lawrence Drive, West Chester, Pennsylvania 19380, USA. 8 Association of Lunar and Planetary Observers, 12911 Lerida Street, Coral Gables, Florida 33156, USA. 9 Association of Lunar and Planetary Observers, Charleston, 570 Long Point Road STE 230, Mount Pleasant, South Carolina 29464, USA. 10 British Astronomical Association, Burlington House, Piccadilly, London W1J 0DU, UK. 0 0 M O N T H 2 0 1 5 | V O L 0 0 0 | N A T U R E | 1 Macmillan Publishers Limited. All rights reserved©2015
  • 2. 200 km, never before observed on Mars, and reaching the ionosphere and exosphere. We have used the set of unprocessed images from 20 and 21 March to measure the plume’s average reflectivity (I/F) at the three available wavelengths over a box of size ,200 km3 200 km in the vertical and along-terminatordirections(I,reflectedradiationintensity;pF,incident solar flux). In order to gain insight into the photometric behaviour of the plume and have a comparison reference, we determined the reflec- tivity from 255 to 1,042 nm wavelength of a plume captured in 1997 by theHSTWideFieldPlanetaryCamera(ExtendedDataFig.5).The1997 plume occurred (with its base on the terminator) at equatorial latitude 22.9u6 0.7u,westlongitude99.1u6 4uandsolarlongitudeLs 5 119.5u. Its plume-like shape, horizontal extent of 10u (,590 km) and morning occurrencesuggestthatboththe1997and2012featuresarerelatedphe- nomena.Theactualaltitude ofthe 1997HSTfeaturecannotbeprecisely determined because of the lack of a rotation image sequence, but we can constrain its altitude to be between 50 km (for the case of a large horizontalfeatureilluminatedbyagrazingSun, thatis,close to0usolar illumination) and 480 km (for the case of a thin vertical feature under 90u solar illumination). Figure 3 shows the measured reflectivity (I/F) for both the 1997 and 2012 events. The spectra appear flat within the quoted uncertainties. To interpret this phenomenon we explore two scenarios. First, we assume that the plume is a cloud formed by particles of H2O-ice, CO2- ice or dust. We performed forward radiative transfer modelling of the reflected intensity and compared it with the observations. The model considers multiple scattering and curvature effects for grazing illumi- nation and a slanted view (see Methods). For the optical properties, we assumedMietheory15 andwavelength-dependentindicesofrefraction16,17 . AsshowninFig.3,dustparticlescanberuledout forthe1997eventand show only marginal agreement with the 2012 data (see also Extended Data Fig. 6). Typically, the best fits occur for CO2 or H2O ice particles with effective radiiof 0:1z0:1 {0:004 mm, whichis consistent withthe particle size of mesospheric clouds observed at night4 . Comparably good fits are obtained for a broad range of particle effective variances (0.1–2.0), which means that the latter parameter cannot be constrained with the available information. The best fit occurs for a layer of vertical thick- ness 100 km and a nadir optical depth tN . 0.5 for both the 1997 and 192°, –44º 198°, –38º b 185°, –42º 198°, –28º c 195°, –47º 207°, –34º d e 189°, –47º 201°, –33º 190°, –45º 202°, –32º f 1 0.8 0.6 0.4 0.2 0 g400 300 200 100 0 Height(km) –50° –45° –40° –35° –30° Latitude at planetary terminator 0º 30º 50º 70º –30º –50º a Figure 1 | A high-altitude plume at the Martian terminator. a, Navigated image (that is, observed planetary disk and fit to model: yellow line, disk; blue line, equator) that shows the feature location (red circle) on March 21 03:21 (image, D. Parker). Dates and times are UTC; image in geographic orientation (north, up; east, right). b–f, Plume images with west longitudes and latitudes at terminator (inverted orientation to facilitate visibility) for dates as follows (yellowline marks the terminator): b, March 20 02:45 (image W.J.); c, March 21 02:51 (W.J.); d, March 21 03:45 (J.P.); e, March 21 03:21, colour composite (D. Parker); f, March 21 03:21, red filter (D. Parker). g, Plume relative brightness map for March 21 03:21, red image (D. Parker). The white doubled-ended vertical arrow in g indicates the estimated error for altitude determination (650 km or 4 pixel size), which is on average 2 s.d. of the individual point uncertainty. 350 300 250 200 150 100 50 0 200 205 210 215 220 225 230 West longitude at limb (degrees) Projectedcloudtopaltitude(km) 200 km 280 km 250 km –50° –40° Figure 2 | Plume top altitude and its rapid changes. Filled circles show the plume’s altitude when rotating into view, as given by the west longitude at the terminator (longitudes increasing with time) for March 20 02:02–02:51 UT, blue, and March 21 02:40–03:50 UT, red. Error bars, s.d. for n 5 5–10 measurements. Solid curves, second degree polynomial fits to these two data sets. Dashed lines, altitudes predicted by a geometric model for a feature placed at the terminator with top altitude 250 or 280km (red) and 200km (blue) at west longitude 216u. The single data points are individual measurements on March dates as follows (error bars, 2 s.d., n 5 5): 12 (cross), 15 (rhomb), 17 (square), 19 (circle), 22 (triangle). Dashed lines show the projected altitude of the Mars shadow (dotted area under these curves) at two latitudes. RESEARCH LETTER 2 | N A T U R E | V O L 0 0 0 | 0 0 M O N T H 2 0 1 5 Macmillan Publishers Limited. All rights reserved©2015
  • 3. 2012 events, which implies number densities of 0.01 particles per cm3 (see Methods and Extended Data Figs 7 and 8). Vaporization of these particles will produce an increase in the gas concentration by a factor of ,1,000 for H2O and 5% for CO2 (see Methods). According to a general circulation model (GCM)18,19 for conditions specific to the observation dates, H2O condensation at the relevant alti- tudesrequireseitheranomalouslycoldthermospherictemperatures(with temperature drop .50 K) or an unusual increase in the H2O mixing ratio from 1024 to complete saturation above 140 km (Fig. 4)20 . CO2 condensation would require an even larger temperature drop of 100 K above 125 km. On the other hand, explaining the cloud as formed by dustwouldrequirevigorousverticaltransportuptoatleast180 kmabove the surface (but this is not predicted by GCMs) or by vigorous updrafts due to dry convection under high insolation (dust heating follows from the absorption of solar radiation)21,22 . Thus, upward motions are more likely to occur at noon than in the morning; all of which, together with the photometric data, makes the dust hypothesis difficult to support. In the second scenario, we explored whether the 2012 plume might beattributabletoanaurora.Marsauroraehavebeenobservednearwhere theplumeoccurs, aregionwithalargeanomalyinthe crustalmagnetic field (at 175u west)7 that can drive the precipitation of solar wind particles into the atmosphere7,23 . The meridional extent of the plume (,500 km, about consistent with aurorae7 ) and its variability could also support this hypothesis. Mars’ ultraviolet aurora is dominated by the Cameron bands of carbon monoxide (CO), with limb intensities of kilorayleighs (kR; refs 7, 24); visible counterpart emissions are also expected. However, quantitative estimates of the aurora intensity defy such a hypothesis.An I/F value of 0.04 at 550nm (Fig. 3) translatesinto anaurorallimbintensityof3,600megarayleighs(MR),muchmorethan the 1-MR nadir emission of strong terrestrial aurorae25 . Furthermore, an auroral hypothesis requires an exceptional influx of energetic part- iclesoverdays,althoughsolaractivityinMarch2012 wasnot unusually high26 . Even accounting for deficiencies in the understanding of auroral excitation27,28 ,theextrapolationfromultravioletintensitiestothevisible falls short of the reported plume brightness by orders of magnitude. Confirmation or rejection of the auroral hypothesis is, however, feasi- ble merely by extended monitoring from ground or space. Online Content Methods, along with any additional Extended Data display items andSource Data, are available in the onlineversion of the paper; references unique to these sections appear only in the online paper. Received 1 August; accepted 17 December 2014. Published online 16 February 2015. 1. Ma¨a¨tta¨nen, A. et al. A complete climatology of the aerosol vertical distribution on Mars from MEx/SPICAM UV solar occultations. Icarus 223, 892–941 (2013). 2. Heavens, N. G. et al. The vertical distribution of dust in the Martian atmosphere during northern spring and summer: observations by the Mars Climate Sounder and analysis of zonal average vertical dust profiles. J. Geophys. Res. Planets 116, E04003 (2011). 3. Ma¨a¨tta¨nen, A. et al. Mapping the mesospheric CO2 clouds on Mars: MEx/OMEGA and MEx/HRSC observations and challenges for atmospheric models. Icarus 209, 452–469 (2010). 4. Montmessin, F. et al. Hyperspectral imaging of convective CO2 ice clouds in the equatorial mesosphere of Mars. J. Geophys. Res. 112, E11S90 (2007). 5. Montmessin, F. et al. Subvisible CO2 ice clouds detected in the mesosphere of Mars. Icarus 183, 403–410 (2006). 6. Clancy, R. T. et al. CRISM limb observations of Mars mesospheric ice clouds: two new results. Proc. Eighth Int. Conf. on Mars, abstr. 1006, http://www.hou.usra.edu/ meetings/8thmars2014/pdf/program.pdf (2014). 7. Bertaux, J. L. et al. Discovery of an aurora on Mars. Nature 435, 790–794 (2005). 8. Strobel, D. F. in Atmospheres in the Solar System: Comparative Aeronomy (eds Mendillo, M., Nagy, A. & Waite, J. H.) 39–54, 191–202 (American Geophysical Union, 2002). 9. Yagi, M. et al. Mars exospheric thermal and non-thermal components: seasonal and local variations. Icarus 221, 682–693 (2012). 10. Bell, J. F., III et al. Mars Reconnaissance Orbiter Mars Color Imager (MARCI): instrument description, calibration, and performance. J. Geophys. Res. 114, E08S92 (2009). 11. Zuber, M. T. et al. The Mars Observer Laser Altimeter investigation. J. Geophys. Res. 97, 7781–7797 (1992). 12. Co´rdoba-Jabonero, C., Zorzano, M. P., Selsis, F., Patel, M. R. & Cockell, C. S. Radiative habitable zones in Martian polar environments. Icarus 175, 360–371 (2005). 13. Minami, M. Communication in Mars Observations. No. 283 http://www.kwasan. kyoto-u.ac.jp/,cmo/cmomn2/283OAA/index.htm (2003). 14. Pellier, C. Martian terminator projections observed by the HST. In Communications in Mars Observations No. 400, http://www.kwasan.kyoto-u.ac.jp/,cmo/cmomn4/ CMO400.pdf (2012). 0.2 0.4 0.6 0.8 1.0 1.2 0 0.01 0.02 0.03 0.04 0.05 0.06 0.07 Wavelength (μm) I/F 1997 2012 Figure 3 | Plume reflectivity and radiative transfer model comparison. Spectral reflectivity of the 20–21 March 2012 event (triangles) and of the 17 May 1997 event (circles) from ground-based and HST observations, respectively. The error bars represent the average quadratic deviation of the measured reflectivity in the integration box. Observations are compared with the best-fitting model for the case where the protrusion is assumed to be a cloud formed by spherical particles: CO2-ice (blue solid line), H2O-ice (red dot- dashed line) or Martian dust (green dashed line). Stars indicate the wavelength grid used for radiative transfer computations. 60 80 100 120 140 160 180 200 Temperature (K) 50 100 150 200 Altitude(km) Figure 4 | Atmospheric temperature profile, and water and carbon dioxide condensation temperatures. These are calculated for the conditions of the 2012 event (latitude 240u, longitude 200u, Ls 5 90u, local time LT 5 6 h) according to a general circulation model18,19 . Atmospheric temperature is shown by the black line, with greyprofiles indicating values extending the range by 610u for latitude, 10u in longitude and 2 h in LT. Condensation temperatures for water (dashed green line) and carbon dioxide (dashed red line) are obtained from the saturation vapour pressure curves of both compounds20 . LETTER RESEARCH 0 0 M O N T H 2 0 1 5 | V O L 0 0 0 | N A T U R E | 3 Macmillan Publishers Limited. All rights reserved©2015
  • 4. 15. Mishchenko, M. I., Travis, L. D. & Lacis, A. A. Scattering, Absorption and Emission of Light by Small Particles (Cambridge Univ. Press, 2002). 16. Warren, S. G. Optical constants of carbon dioxide ice. Appl. Opt. 25, 2650–2674 (1986). 17. Fedorova, A. A. et al. Evidence for a bimodal size distribution for the suspended aerosol particles on Mars. Icarus 231, 239–260 (2014). 18. Gonza´lez-Galindo, F., Ma¨a¨tta¨nen, A., Forget, F. & Spiga, A. The Martian mesosphere as revealed by CO2 cloud observations and general circulation modeling. Icarus 216, 10–22 (2011). 19. Gonza´lez-Galindo, F. et al. Three-dimensional Martian ionosphere model: I. The photochemical ionosphere below 180 km. J. Geophys. Res. 118, 2105–2123 (2013). 20. Sa´nchez-Lavega, A., Pe´rez-Hoyos, S. & Hueso, R. Condensate clouds in planetary atmospheres: a usefulapplication of the Clausius-Clapeyron equation.Am. J. Phys. 72, 767–774 (2004). 21. Heavens, N. G. et al. Vertical distribution of dust in the Martian atmosphere during northern spring and summer: High-altitude tropical dust maximum at northern summer solstice. J. Geophys. Res. Planets 116, E01007 (2011). 22. Spiga, A., Faure, J., Madeleine, J. P., Ma¨a¨tta¨nen, A. & Forget, F. Rocket dust storms and detached dust layers in the Martian atmosphere. J. Geophys. Res. Planets 118, 746–767 (2013). 23. Mitchell, D. L. et al. A global map of Mars’ crustal magnetic field based on electron reflectometry. J. Geophys. Res. 112, E01002 (2007). 24. Leblanc, F. et al. Observations of aurorae by SPICAM ultraviolet spectrograph on board Mars Express: simultaneous ASPERA-3 and MARSIS measurements. J. Geophys. Res. 113, A08311 (2008). 25. Chamberlain, J. W. Physics of the Aurora and Airglow, Ch. 4, 5 (American Geophysical Union, 2013). 26. SpaceWeatherLife.com http://www.spaceweatherlive.com/en/archive/2012/ 03/12/rsga (2014). 27. Fox, J. The ionospheric source of the red and green lines of atomic oxygen in the Venus nightglow. Icarus 221, 787–799 (2012). 28. Slanger, T. G. et al. Photoemission phenomena in the Solar System. Space Sci. Rev. 139, 267–310 (2008). Acknowledgements This work was supported by the Spanish MINECO project AYA2012-36666, FEDER, Grupos Gobierno Vasco IT765-13 and UPV/EHU UFI11/55. The IAA(CSIC) teamwassupported by the Spanish MINECO through the CONSOLIDER programme ASTROMOL CSD2009-00038 and AYA2011-30613-CO2-1. F.G.-G. is funded by a CSIC JAE-Doc contract co-financed by the European Social Fund. Author Contributions A.S.-L. coordinated the study and performed plume measurements, photometric calibration and participated in the models study; A.G.M. studied aurora and together with S.P.-H. performed radiative transfer modelling; E.G.-M. performed with A.S.L. the geometric modelling; M.A.L.-V. and F.G.-G. performed the GCM model calculations andaurorastudies, and F.G.-G.performedtheevaporation calculations; J.M.G.-F., C.P. and M.D. performed plume measurements; W.J., D. Parker, J.P. and D. Peach performed ground-based images. All authors discussed the results and commented on the manuscript. Author Information Reprints and permissions information is available at www.nature.com/reprints. The authors declare no competing financial interests. Readers are welcome to comment on the online version of the paper. Correspondence and requests for materials should be addressed to A.S.-L. (agustin.sanchez@ehu.es). RESEARCH LETTER 4 | N A T U R E | V O L 0 0 0 | 0 0 M O N T H 2 0 1 5 Macmillan Publishers Limited. All rights reserved©2015
  • 5. METHODS Image availability. Amateur images. Available at the following databases: Associ- ation of Lunar and Planetary Observers-Japan, http://alpo-j.asahikawa-med.ac.jp/ Latest/Mars.htm (2012), and Socie´te´ Astronomique de France (Commission sur- faces Planetaires), http://www.astrosurf.com/pellier/mars (2012). Hubble Space Telescope images. Available at NASA Planetary Data System (PDS) or at ESA HST archive, http://archives.esac.esa.int/hst/#Q-1R-S1D-1 (2012). MRO MARCI Weather Reports. Malin Space Science Systems. Captioned Image ReleaseNo.MSSS-216–21March2012http://www.msss.com/msss_images/2012/ 03/21/ and Captioned Image Release No. MSSS-217 – 28 March 2012 http://www. msss.com/msss_images/2012/03/28/. MOLA maps. Available at http://mola.gsfc.nasa.gov/images/topo_labeled.jpg. Image analysis and measurement. Most images were obtained with broadband filters coveringthe blue (B, leff 5 4506 50 nm), green (G,leff 5 520650 nm) and red (R, leff 5 6256 75 nm) spectral bands. Each image was constructed by sum- ming, aligning and re-centring sequences of frames captured in video mode, and application of the ‘lucky imaging’ method29–31 and the ‘wavelet’ as the main pro- cessing technique30 . The Airy disk for a telescopeof 356mm in diameter (Fig. 1a,b, d–g and photometric analysis) at a wavelength of 450nm is 0.317arcsec and the plate scale employed was 0.045arcsec per pixel equivalent to an effective pixel size of25 kmonMars, typicallyused in highresolution planetary imageswhererecord- ing features depends, for excellent seeing conditions, on resolution and features contrast32 .Thetotalspatialcoverageof theprojectedplumeis,850pixels(21March, Fig. 1g). Image navigation, thatis, the determination of the planetary limb and ter- minatorwasperformedusingtwowell-testedsoftwarepackages(LAIA,WinJupos; ref. 33 and http://www.grischa-hahn.homepage.t-online.de/astro/index.htm). The bright Martian limb was used as a reference but not the terminator whose defini- tionisaffectedbythe presenceofthe darkand bright features. Navigation was accu- ratelycontrolledbymeasuringthepositionofwell-knownsurfacefeatures(Olympus Mons and Tharsis volcanoes). The projected plume top altitude on the sky plane (definedastheborderbetweenthefeatureandthedarkbackground,contrastforced) was simply determined from its distance to the Mars disk centreand subtraction of the measured Martian radius (all in pixel units). Navigation and image measure- ments were performed independently by four of us. From these multiple measure- ments,we derivedthe meanvaluesofthe Marsradiusandtopaltitudeforeach image. The uncertainties represent the root mean square (r.m.s.) values of the altitude determinations. We estimate that the positioning error is 62 pixels and that, for the above plate-scale, this corresponds to 650 km. Uncertainties in plume mea- surements result from brightness diffusion at the top and sides of the plumes and from the determination of the base location of the plume relative to the navigated terminator, including its brightness irregularities. As a further step in navigation control, we used the image series of 20 March by W.J. to compare the results of the top altitude measurements by two different pro- cedures: (1) through measurements on each image of the planet and plume top radius to calculate the plume maximum altitude; (2) through determination of the meanradiusforthewholeimageseries(anditsuncertainty)andthenusingthismean value for each image to determine the top altitude. Both approaches yield consis- tent results within the uncertainties indicated in the text. Themeasuredtopaltitudevalues(H)andtheterminatorwestlongitudes(L,defined asthecentralmeridianlongitudeforeachobservingtime170u)for20and21March, fitted to a second order polynomial H 5 a0 1 a1L 1 a2L2 , gave the peak values at Lmax 5 2a1/2a2, and then the corresponding Hmax. The retrieved coefficients are, for 20 March, a0 5 215,233.8, a1 5 144.7, a2 5 20.3395, and for 21 March, a0 5 243,164.8, a1 5 401.8, a2 5 20.929. Plume altitude model. Angular distance between the plume’s base and the central meridian. Our coordinate systemisplacedatthe centre ofMars: thex axiswillbeon the observer’s visual and the y–z plane is coincident with the sky plane. Coordinate systemgeometry is depicted in Extended Data Fig. 4, withthe cloudrisingnear the west morning limb and the sub-Earth point on the equator. The longitude of the Central Meridian (CM) is lCM, and the latitude and longitude of the plume are respectively Qc and lc. The longitudinal angular distance of the plumeto the CM is related to the angular distance b between the plume and the limb taking as a reference the negative y axis, by: 900 {b~lc{lCM ð1Þ where b is positive if the limb is behind the cloud, and negative if the cloud is located behind the limb. Limit altitude for plume visibility. Let z(b) be the visible projected plume altitude above Mars’ limb not blocked by the planet’s disk when b , 0. When the plume is behind the limb it protrudes from the planet’s limb only if its total projected length on the y–z plane from the planet centre is larger than the planet’s radius RM. With cy and cz being respectively the y and z coordinates of the cloud top, we have c2 yzc2 z n o1=2 ~RMzz bð Þ. In terms of b and the real cloud altitude H, we get cy~{ RMzHð Þ cos Qc cos b cz~ RMzHð ÞsinQc & ð2Þ The minimum height of the plume Hmin to protrude from the limb (z(b) 5 0) is Hmin~ RM 1{ cos2 Qcsin2 bf g 1=2 {RM ð3Þ Real plume altitude derived from its projected length. When b , 0, by expression (2), z(b) must satisfy z bð Þ~ RMzHð Þ cos2 Qc cos2 bzsin2 Qcf g 1=2 {RM ð4Þ and the actual plume altitude is: H~ z bð ÞzRM 1{ cos2 Qcsin2 bf g 1=2 {RM ð5Þ If b . 0, the whole plume is visible (we see its projected total height). The cloud height H is now given by: H~ z bð Þ 1{ cos2 Qcsin2 bf g 1=2 ð6Þ Correction when Mars has a declination DE as observed from Earth. By taking the declination angle 1DE when the north pole is tilted towards Earth and 2DE when the planet’s south pole is visible, the transformation matrix due to a rotation around the y axis by an angle 1DE is x0 y0 z0 2 6 4 3 7 5~ cos DE 0 sinDE 0 1 0 {sinDE 0 cos DE 2 6 4 3 7 5 x y z 2 6 4 3 7 5 ð7Þ Therefore, expressions (5) and (6) must be corrected taking into account that: y0 ~y z0 ~{xsinDEzz cos DE & ð8Þ In the rotated coordinate system, the projected plume altitude is z0 bð Þ~ c0 y 2 zc0 z 2 n o1=2 {RM, with c0 y and c0 z being thetransformed coordinatesof the plume top, with the non-transformed coordinates of the plume top given by: cx~(RMzH) cos Qc sin b cy~{(RMzH) cos Qc cos b cz~(RMzH)sinQc ð9Þ Expressing c0 y and c0 z in terms of cx, cy and cz when the plume is behind the limb gives its real height H~ z0 bð ÞzRM cos2 Qc cos2 bz sinQc cos DE{ cos Qc sinb sinDEð Þ2È É1=2 {RM ð10Þ Owing to the planet’s tilt, the plume will be on the limb not for b 5 0 but for a different value blim. Therefore, for b 5 blim, z9(b) 5 0 if H 5 0. Applying this con- dition to expression (10) and after some algebraic manipulations, we obtain: blim~{sin{1 tan(Qc)|tan DEð Þ ð11Þ When DE 5 0 we recover blim 5 0. Note that at the equator blim is always 0 regard- less the value of DE. Expression (10) is valid for bƒblim (the plume is behind the planet’s limb). When b§blim the plume is before the limb and is not blocked by the planet and we have: H~ z0 bð Þ cos2 Qc cos2 bz sinQc cos DE{ cos Qc sinb sinDEð Þ2È É1=2 ð12Þ Mars’ shadow projection on the plume. Given the coordinates of the subsolar point on Mars (ls, Qs) and the plume coordinates (lc, Qc) we have both points separated by an angle: c~ cos{1 cos Qs cos Qc cos ls{lcð ÞzsinQssinQc½ Š ð13Þ This expression is also valid when ls and lc are the respective distances to the CM. In this case, lc 5 (p/2) 2 b when we are close to the morning limb and: c~ cos{1 cos Qs cos Qcsin lszbð ÞzsinQs sinQc½ Š ð14Þ LETTER RESEARCH Macmillan Publishers Limited. All rights reserved©2015
  • 6. Looking at Extended Data Fig. 5, the angle a 5 c 2 (p/2) and the height of the planet’s shadow projected on the plume is: SC~ RM cos a {RM ð15Þ For b , 0, using equations (5) and (15), the visible projected length of the planet’s shadow projected on the protruding plume is: S bð Þ~ RM cos a cos2 Qc cos2 bzsin2 Qc È É1=2 {RM ð16Þ For b . 0 the planet’s shadow projected on the plume is completely visible, since the planetary disk does not block it. The real height of the shadow will be SC again, and according to equation (6) the projected shadow’s height will be: S bð Þ~SC cos2 Qc cos2 bzsin2 Qc È É1=2 ~RM 1 cos a {1 ! cos2 Qc cos2 bzsin2 Qc È É1=2 ð17Þ Again, if the planet’s rotation axis is tilted by 6 DE degrees, we obtain S bð Þ~ RM cos a cos2 Qc cos2 bz sinQc cos DE{ cos Qc sinb sinDEð Þ2È É1=2 {RM ð18Þ for bƒblim, and S bð Þ~SC cos2 Qc cos2 bz sinQc cos DE{ cos Qc sinb sinDEð Þ2È É1=2 ð19Þ for b§blim. The model predictions are shown in Fig. 2. A x2 calculation between the mea- sured top altitudes considering the individual error and the predictions from the geometric model for a uniform plume shows that for 20 March x2 , 4 for top alti- tudes 190–195 km (best fit), but for 21 March x2 (min) < 20 for top altitudes 240– 250km. Thelarge deviationsbetween themodelandtheobservationsfor 21March data rule out a uniform structure for the plume. Altitude of the 1997 HST feature. The 17 May1997 eventwas captured by HSTon a single image at each specific wavelength, and thus they do not show the plume in rotation at the limb/terminator. Therefore we can only constrain the maximum and minimum altitudes for the feature as seen projected on the terminator. The feature protrudes on the terminator by 10u (angle a in Extended Data Fig. 4). For solar zenith angle SZA 5 90u (grazing illumination) the minimum altitude is given by equation (15): Hmin 5 SC 5 53 km. On the other hand, the maximum altitude Hmax will occur for a vertical feature whose projection L as seen on the terminator from Earth (phase angle w 5 35.5u) is given by L~ ffiffiffiffiffiffiffiffiffiffiffiffiffiffiffiffiffiffiffiffiffiffiffiffiffiffiffiffiffiffiffiffiffi (RMzSc)2 {RM 2 q and then Hmax 5 Ltanw 5 480km. Photometric calibration. (1) Ground-based observations (20–21 March 2012). Stacked and aligned unprocessed images were used for reflectivity measurements. Because of their higher resolution, only the series B, G, R filtered images from W.J. and D. Parker were used for that purpose. The photometry from the brightest part ofthecloudwascomparedtodifferentbrightanddarkregionsofMarswhoseabso- lute (I/F) reflectivity is known34 . The resulting I/F can be seen as an average for the cloud at B, G and R, and from independent measurements by the team members of the same images, we estimate an uncertainty of 20%. (2) HST calibration (17 May 1997). Hubble Space Telescope observations acquired in filters from the ultraviolet (F255W) to the near-infrared (F1042M) (Extended Data Fig. 5) were photometrically calibrated following the WFPC2 handbook instructions. Radiances were converted into absolute reflectivity I/F using the solar spectrum35,36 . The resulting I/F as a function of planetary geographical coordinates was confirmed against values given by other authors for selected locations of the planet34 andwithglobalalbedovaluesoftheplanet37 .Theintensitycalibrationmethod for ground-based images was validated with a similar procedure to that used in HST images and comparison with the above procedure. Radiative transfer model. We conducted radiative transfer calculations of the reflectivity I/F with a backward Monte Carlo model designed for spherical-shell atmospheres38 . The model produces as output the full Stokes vector of radiances, but only the first vector element (intensity) was considered for comparison with the observations. The model naturally accounts for curvature effects in the (nearly) grazing illumination/viewing geometries of both the 1997 and 2012 events. In its specific implementation here, the model assumes a uniform cloud of geometrical thickness D that enshrouds the entire planet. The observer looks upon the planet terminator with a line of sight that sequentially probes the full range of altitudes where the cloud is present. For the 1997 event, plane psun (formed by the local ver- tical direction at the planet’s terminator and the Sun illumination direction), and plane psobs (formed by the same local vertical direction and the observer viewing direction) are offset by an azimuth angle of 15u. The cosine of the polar angle between the observer’s viewing direction and the local vertical at the terminator is 0.514 6 0.02, and is 0.404 6 0.03 for the farthest point of the plume from the terminator. The phase angle (Sun–Mars–Earth) was 35.6u. Correspondingly, for the 2012 event, the prescribed azimuth angle and the cosine of the polar angle are 0u and 0.01460.03, and the phase angle (Sun–Mars–Earth) was 7.15u. Solar photons entertheatmospherefollowinggrazingtrajectories,andpenetratehalfwaythrough the limb before beingscattered towards the observer atthe terminator. To compare with the box-averaged I/Fs from observations, the model-calculated I/Fs were also averaged over the cloud geometrical thickness D from the observer’s vantage point. A number of photon realizations between 104 and 105 ensured accuracies typically better than 5%, which is much less than the measured uncertainties. The atmo- spheric inputs to the model include the cloud particles’ optical properties and the cloud (vertical) optical thickness tN, in addition to the geometrical thickness of the cloud D. In the prescription of particle sizes, we used a power law distribution described by the two moments reff (effective radius) and neff (effective variance)15 . Particle candidates are CO2-ice, H2O-ice and dust, and we considered their wavelength- dependent refractive indices13,14 . The particles’ optical properties required in the radiative transfer calculations are $, p(h) and s, which stand for the particles’ single scattering albedo, scattering phase function and extinction cross-section, respectively. Each of these properties is specified at the appropriate radiation wavelength l. For the determination of the optical properties we used Mie theory, which applies to scattering by spherical par- ticles. If the particlesare non-spherical, Mie theory may bias the properties of inferred particles that fit best the measured I/F reflectivities. The differences in optical properties between spherical and non-spherical particles depend on the particles’ shape and size distribution, as well as on their composition and on the radiation wavelength.Numericalinvestigationshaveexploredthesedifferences overa limited range of parameter space15 . Without additional information on the cloud particles, it is difficult to assess the consistency in the treatment with Mie theory of the radi- ative transfer problem. We can nevertheless tentatively quantify it by comparison against specific solutions from the literature. For reff 5 0.1 mm and l 5 0.55 mm, the effective size parameter xeff 5 2preff/l < 1. Focusing on the scattering phase function, which is particularly sensitive to the particles’ shape, a few studies15 sug- gest that for xeff < 1 the differences between spherical and non-spherical particles are not usually more than a few tens of per cent. These differences are less than for larger values of xeff. Overall, each radiative transfer calculation requires user-inputted values for l, particle composition (and therefore wavelength-dependent refractive indices), reff, neff and tN (also dependent on wavelength). The problem of comparing reflectiv- ities I/F from model calculations and observations is therefore multi-parametric. Intheexplorationofthespaceofparameters,webuiltagridofsolutionstotheradi- ative transfer problem for D (10, 50, 100, 200km), reff (0.01 to 2 mm; 20 values with varying steps between 0.01 and 0.1 mm), neff (0.1, 0.2, 0.5, 1 and 2; range consistent with values adopted in prior Mars investigations4,15,39 ) and tn,502nm (5tn at 502nm; from 16 to 1023 ; 31 values in steps following a power law). The total number of radiative transfer calculations for each of the 1997 and 2012 events exceeds 105 . For each possible spectrum within the grid of calculations with identical particle composition, reff, neff and tn,502nm, we calculated the average quadratic deviation of the model from the observed data weighted by the observation errors (x2 ). A subset ofthefreeparameterspacewithbest-fittingvaluesisshowninExtendedDataFig.6 for the 1997 event and Extended Data Fig. 7 for the 2012 event. In the former case, dust particles do not fit the data with x2 , 1.0. While a number ofsub-optimal solu- tions for different combinations of the free parameters can be found, the highest density of low x2 solutions can be interpreted as the most likely combination of the free parameters. This happens for particles with effective radii of the order of 0.1 mm, depending on the particles’ effective variance and composition. In this framework, there is no way to discriminate between the variances and this also impedes making a choice between H2O and CO2 as the most likely particle type. Similarly, the x2 results for the 2012 observations show a broad range of particle sizes and optical thicknesses that provide x2 , 1.0. They include dust particles that, in any case, result in fits that are worse than for the H2O and CO2 composi- tions. Extended Data Fig. 8 shows how, given the narrow spectral range covered duringthe 2012 event, itis possible to retrieve acceptablefits forparticle sizes rang- ing from 0.1 to 1.0mm, provided that the rest of the free parameters are adequately tuned. Observations at shorter/longer wavelengths might potentially break this degeneracy. All in all, the radiative transfer calculations for both the 1997 and 2012 events constrain to some extent the effective particle radius reff, and the vertical extension of the cloud D, andgive alowerlimit for the normal opticalthickness tn,502nm. Unfor- tunately, additional data are required to constrain other parameters, such as neff or the cloud particle composition. The optical thickness tn,502nm retrieved from the model fit translates into particle density after dividing the optical thickness by the particle cross-section at 502 nm and the cloud geometrical thickness. RESEARCH LETTER Macmillan Publishers Limited. All rights reserved©2015
  • 7. Code availability. All radiative transport calculations were conducted with a novel pre-conditioned backward Monte Carlo (PBMC) model38 . A plane-parallel version of the model is freely available through: http://dx.doi.org/10.1051/0004- 6361/201424042. This version contains instructions to run the model, test cases and model outputs that can be compared to calculations tabulated in ref. 38. In the analysis of the Mars plume, we used a version of the PBMC suitable for spherical shell atmospheres. The spherical-shell model is available on request from A.G.M. (tonhingm@gmail.com). Mars General Circulation Model. As supplied in the Mars Climate Database at http://www-mars.lmd.jussieu.fr/. Cloud evaporation. H2O-cloud. Taking water-ice density as 0.93 g cm23 (ref. 40), the mass of a spherical particle with radius 0.1 mm is m 5 43 10215 g; the corres- ponding number of molecules resultingfrom evaporationofthis particle is mNAvo/ m < 108 , taking NAvo 5 6.0233 1023 particles per mol and the molecular weight of water is m 5 18 g mol21 . For the retrieved cloud density 0.01 cm23 , evaporation of the cloud will produce ,106 particles per cm3 . On the other hand, the atmospheric densityisr 5 53 10215 g cm23 atanaltitudeof200 km, atlatitude240u,Ls 5 90u, 210u W longitude and local time 6 h (ref. 18). The mean molecular weight of the atmosphere at this altitude is now m 5 17 g mol21 because of oxygen dominance with a volume mixing ratio vmr 5 0.6 and a 13% contribution from N2 and CO. The vmr of H2O at this altitude is 4 3 1026 . The number density of molecules in theatmosphereisN(H2O,atm:)~ rH2O|NAvo=m À Á |vmrH2O103 particlescm{3 . Therefore, evaporation of the water ice will produce an enrichment of water by a factor ,1,000 over normal conditions. CO2-cloud. Taking CO2-ice density as 1.5 g cm23 , the mass of a spherical particle withradius0.1mmwillbem 56310215 gandthecorrespondingnumberofmolec- ules resulting from evaporation is mNAvo/m9 108 where m9 5 44 g mol21 is the molecular weight of CO2. For the retrieved cloud particle density of 0.01 cm23 , cloudevaporationwillproduce,106 particlespercm3 .Onthe otherhand,fromthe aboveatmosphericconditions,andvmrCO2 50.09,thenumberdensityofmolecules intheatmosphereisN(CO2,atm:)~ rCO2 |NAvo=m À Á |vmrCO2 107 particlescm{3 . Therefore, CO2 ice evaporation will produce a 5% enrichment of CO2. 29. Law, N. M., Mackay, C. D. Baldwin, J. E. Lucky imaging: high angular resolution imaging in the visible from the ground. Astron. Astrophys. 446, 739–745 (2006). 30. Berrevoets, C. et al. RegiStax6. http://www.astronomie.be/registax/ (2011). 31. Kraaikamp, E. AustoStakkert!2. http://www.autostakkert.com/ (2012). 32. Peach, D. A. The 2010 perihelic opposition of Jupiter observed from Barbados. J. Br. Astron. Assoc. 121, 337–340 (2011). 33. Cano, J. A. LAIA: Laboratorio de Ana´lisis de Ima´genes Astrono´micas (Grup d’Estudis Astrono`mics, Barcelona, 1998). 34. Bell, J. F. III et al. Mars surface mineralogy from Hubble Space Telescope imaging during 1994-1995: observations, calibration, and initial results. J. Geophys. Res. 102, 9109–9123 (1997). 35. de Pater, I. et al. A multi-wavelength study of the 2009 impact on Jupiter: comparison of high-resolution images from Gemini, Keck and HST. Icarus 210, 722–741 (2010). 36. Colina, L., Bohlin, R. C. Castelli, F. The 0.12–2.5 micron absolute flux distribution of the Sun for comparison with solar analog stars. Astron. J. 112, 307–315 (1996). 37. Mallama, A. The magnitude and albedo of Mars. Icarus 192, 404–416 (2007). 38. Garcı´a Mun˜oz, A. Mills, F. P. Pre-conditioned backward Monte Carlo solutions to radiative transport in planetary atmospheres. Fundamentals: sampling of propagation directions in polarising media. Astron. Astrophys. 573, A72 (2015). 39. Santer, R., Deschamps, M., Ksanfomaliti, L. V. Dollfus, A. Photopolarimetry of Martian aerosols. II. Limb and terminator measurements. Astron. Astrophys. 158, 247–258 (1986). 40. de Pater, I. Lissauer, J. J. Planetary Sciences 2nd edn (Cambridge Univ. Press, 2010). LETTER RESEARCH Macmillan Publishers Limited. All rights reserved©2015
  • 8. Extended Data Figure 1 | Images of the 2012 plume event (ringed) on 12–20 March. Dates in March (and authors) are as follows: a, 12 (M.D.); b, 15 (D. Peach); c–f, 20, plume in rotation (W.J.). Time indicated at top left of each panel is in UTC. RESEARCH LETTER Macmillan Publishers Limited. All rights reserved©2015
  • 9. Extended Data Figure 2 | Images of the 2012 plume events (ringed) on 22 March and 13 April. a, First event on 22 March, 04:12 UTC (image by W.J.); b, second event on 13 April, 20:03 UTC (image by D. Peach). LETTER RESEARCH Macmillan Publishers Limited. All rights reserved©2015
  • 10. Extended Data Figure 3 | Images of the 2012 plume event (ringed) at different wavelengths on 21 March. a-c, Images by J.P., d–f, images by D. Parker, with filters indicated: a, d, B (blue); b, e, G (green); c, f, R (red). Time indicated is in UTC. RESEARCH LETTER Macmillan Publishers Limited. All rights reserved©2015
  • 11. Extended Data Figure 4 | Martian viewing geometry. a, Angle definitions with the simulated protrusion of altitude H located at point c and out of the illuminated part of the disk near the limb. b, Top view, taking as a reference the planet’s terminator and definition of c and a angles when the cloud is on the equator (but the latitude of the subsolar point is not zero). Green arrows represent the projected cloud altitude as seen from Earth in the extreme situations when the cloud is on the terminator and follows the grazing sunlight, and when it follows the planet’s radius. To simplify the figure, and without loss of generality, the sub-Earth point is placed on the arc linking the subsolar point and the cloud base. c, General side view of the geometry of the planet’s projected shadow. LETTER RESEARCH Macmillan Publishers Limited. All rights reserved©2015
  • 12. Extended Data Figure 5 | Hubble Space Telescope images of the event on May 17 1997. Wavelengths and times in UTC were: a, 255 nm (17:27); b, 410nm (17:35); c, 502nm (17:38); d, 588nm (17:50); e, 673nm (17:41); f, 1,042 nm (17:47); g, Colour composite. Plume ringed in a–f, arrowed in g. Table at bottom identifies each image and its HST number, and also shows filters used, giving their central wavelength and bandwidth (FWHM). RESEARCH LETTER Macmillan Publishers Limited. All rights reserved©2015
  • 13. Extended Data Figure 6 | Radiative transfer model fit for the 2012 event. This is an example of the degeneracy of the model solution due to the narrow wavelength range covered in the 2012 event. Model fit as follows: solid lines, CO2; dot-dashed lines, H2O particles; blue, data for an effective radius reff 5 0.1 mm; red, data for reff 5 1.0mm; stars, wavelengths used in the calculations. As in Fig. 3, open black triangles show the observed reflectivity of the 2012 cloud. The error bars represent the average quadratic deviation of the measured reflectivity in the integration box. LETTER RESEARCH Macmillan Publishers Limited. All rights reserved©2015
  • 14. Extended Data Figure 7 | Assessment of the radiative transfer model fit for the 1997 event. a–i, Colours show values of x2 (for measured I/F versus model calculation, colour scale at right) for the effective radius (reff in mm) versus optical depth (tN at 502 nm), and for different particle types and values of the indicated particle variance (neff, shown in parentheses) as follows. a, CO2 (0.5); b, CO2 (1.0); c, CO2 (2.0); d, DST (dust, 0.5); e, DST (dust, 1.0); f, DST (dust, 2.0); g, H2O (0.5); h, H2O (1.0); and i, H2O (2.0). The calculations are for a vertical extension of the cloud with D 5 100km, and they provide the best-fitting values of the whole free parameter space. RESEARCH LETTER Macmillan Publishers Limited. All rights reserved©2015
  • 15. Extended Data Figure 8 | Assessment of the radiative transfer model fit for the 2012 event. As Extended Data Fig. 7 in terms of variables plotted, particle types and particle variance, but for the 2012 event. LETTER RESEARCH Macmillan Publishers Limited. All rights reserved©2015