

Empfohlen
Weitere ähnliche Inhalte
Was ist angesagt?
Was ist angesagt? (19)
Andere mochten auch
Ähnlich wie Ages and stratigraphy of lunar mare basalts a synthesis
Ähnlich wie Ages and stratigraphy of lunar mare basalts a synthesis (20)
Mehr von Sérgio Sacani
Mehr von Sérgio Sacani (20)
Kürzlich hochgeladen
Kürzlich hochgeladen (20)
Ages and stratigraphy of lunar mare basalts a synthesis
- 1. Downloaded from specialpapers.gsapubs.org on August 28, 2011 Geological Society of America Special Papers Ages and stratigraphy of lunar mare basalts: A synthesis H. Hiesinger, J.W. Head III, U. Wolf, R. Jaumann and G. Neukum Geological Society of America Special Papers 2011;477;1-51 doi: 10.1130/2011.2477(01) Email alerting services click www.gsapubs.org/cgi/alerts to receive free e-mail alerts when new articles cite this article Subscribe click www.gsapubs.org/subscriptions/ to subscribe to Geological Society of America Special Papers Permission request click http://www.geosociety.org/pubs/copyrt.htm#gsa to contact GSA Copyright not claimed on content prepared wholly by U.S. government employees within scope of their employment. Individual scientists are hereby granted permission, without fees or further requests to GSA, to use a single figure, a single table, and/or a brief paragraph of text in subsequent works and to make unlimited copies of items in GSA's journals for noncommercial use in classrooms to further education and science. This file may not be posted to any Web site, but authors may post the abstracts only of their articles on their own or their organization's Web site providing the posting includes a reference to the article's full citation. GSA provides this and other forums for the presentation of diverse opinions and positions by scientists worldwide, regardless of their race, citizenship, gender, religion, or political viewpoint. Opinions presented in this publication do not reflect official positions of the Society. Notes © 2011 Geological Society of America
- 2. Downloaded from specialpapers.gsapubs.org on August 28, 2011 The Geological Society of America Special Paper 477 2011 Ages and stratigraphy of lunar mare basalts: A synthesis H. Hiesinger* Institut für Planetologie, Westfälische Wilhelms-Universität, 48149 Münster, Germany, and Department of Geological Sciences, Brown University, Providence, Rhode Island 02912, USA J.W. Head III Department of Geological Sciences, Brown University, Providence, Rhode Island 02912, USA U. Wolf R. Jaumann Institute of Planetary Exploration, German Aerospace Center (DLR), 12489 Berlin, Germany G. Neukum Institut für Geologie, Geophysik, und Geoinformatik, Freie Universität Berlin, 12249 Berlin, Germany ABSTRACT The chronology of lunar volcanism is based on radiometric ages determined from Apollo and Luna landing site samples, regional stratigraphic relationships, and crater degradation and size-frequency distribution data for units largely defined prior to the end of the Apollo program. Accurate estimates of mare basalt ages are necessary to place constraints on the duration and the flux of lunar volcanism, as well as on the petrogenesis of lunar mare basalts and their relationship to the thermal evolution of the Moon. Here, we report on ages derived from crater size-frequency distribution measurements for exposed mare basalt units on the lunar nearside hemisphere. Cra- ter size-frequency distribution measurements provide a statistically robust and accu- rate method to derive absolute model ages of unsampled regions on the Moon and other planetary surfaces. This paper summarizes and synthesizes results from our crater-counting efforts over more than 10 yr. We have dated basalts in Oceanus Pro- cellarum, Imbrium, Serenitatis, Tranquillitatis, Humboldtianum, Australe, Humo- rum, Nubium, Cognitum, Nectaris, Frigoris, and numerous smaller occurrences like impact craters and sinus and lacus areas. Our investigations show that (1) in the inves- tigated basins, lunar volcanism was active for almost 3 b.y., starting at ~3.9–4.0 b.y. ago and ceasing at ~1.2 b.y. ago, (2) most basalts erupted during the late Imbrian Period at ~3.6–3.8 b.y. ago, (3) significantly fewer basalts were emplaced during the Eratosthenian Period, and (4) basalts of possible Copernican age have been found only in limited areas in Oceanus Procellarum. Our results confirm and extend the general distribution of ages of mare basalt volcanism and further underscore the *Hiesinger@uni-muenster.de Hiesinger, H., Head, J.W., III, Wolf, U., Jaumann, R., and Neukum, G., 2011, Ages and stratigraphy of lunar mare basalts: A synthesis, in Ambrose, W.A., and Williams, D.A., eds., Recent Advances and Current Research Issues in Lunar Stratigraphy: Geological Society of America Special Paper 477, p. 1–51, doi:10.1130/2011.2477(01). For permission to copy, contact editing@geosociety.org. © 2011 The Geological Society of America. All rights reserved. 1
- 3. Downloaded from specialpapers.gsapubs.org on August 28, 2011 2 Hiesinger et al. predominance of older mare basalt ages in the eastern and southern nearside and in patches of maria peripheral to the larger maria, in contrast to the younger basalt ages on the western nearside, i.e., in Oceanus Procellarum. New data from the recent international armada of lunar spacecraft will provide mineralogical, geochemical, morphological, topographic, and age data that will further refine our understanding of the flux of lunar mare basalts and their relation to petrogenetic trends and lunar thermal evolution. INTRODUCTION Hartmann, 1966; Greeley and Gault, 1970; Neukum et al., 1975a; Neukum and Horn, 1976; Boyce, 1976; Boyce and Johnson, One of the major goals of stratigraphic investigations is to 1978; Wilhelms, 1987; Neukum and Ivanov, 1994; Hiesinger date geologic units, integrate them into a stratigraphic column et al., 2000, 2001, 2002, 2003, 2010; Morota et al., 2008; Har- that is applicable over the whole planet, and to calibrate this uyama et al., 2009). column with absolute ages. In preparation for and following the The internal thermal history and evolution of a planetary American and Russian lunar missions, extensive work on the body are reflected in the timing and extent of volcanism on its lunar stratigraphy was conducted, for example, by Wilhelms surface (Head and Wilson, 1992). Thus, investigations of the ages (1970, 1987), Shoemaker and Hackman (1962), and Wilhelms and compositions of volcanic products on the surface provide and McCauley (1971). Based on this early work, we know that clues to the geologic and thermal evolution of a planet. Samples, the lunar highlands are generally older than the mare regions remote-sensing data, and lunar meteorites indicate that volcanism (e.g., Wilhelms, 1987), that mare volcanism did not occur within was active early in lunar history. For example, dark-halo craters a short time interval but instead shows a substantial range in ages have been interpreted as impacts into basaltic deposits that are (e.g., Shoemaker and Hackman, 1962; Carr, 1966), and that there now buried underneath a veneer of basin or crater ejecta (e.g., is significant variation in the mineralogy of basalts of different Schultz and Spudis, 1979; Hawke and Bell, 1981; Antonenko et ages (e.g., Soderblom et al., 1977; Pieters et al., 1980). Compared al., 1995). These underlying cryptomare basalts might be among to Earth, we only have a small number of samples of the Moon the oldest basalts on the Moon, implying that volcanism was that can help us to decipher its geologic history and evolution. For active prior to ~3.9 b.y. ago. Terada et al. (2007) argued that the example, accurate radiometric ages for lunar mare basalts, which lunar meteorite Kalahari 009 might represent a very low-Ti cryp- cover ~17% of the lunar surface (Head, 1976; Head and Wilson, tomare basalt. Radiometric U-Pb age dating of phosphate grains 1992), are available only for the spatially very limited regions associated with basaltic clasts in the lunar meteorite Kalahari 009 around the Apollo and Luna landing sites (e.g., BVSP, 1981; revealed that volcanism was already active at least 4.35 b.y. ago Stöffler and Ryder, 2001, and references therein). Because most (Terada et al., 2007). lunar mare basalts remain unsampled, even after the Apollo and On the basis of crater degradation stages, Boyce (1976) and Luna missions (e.g., Pieters, 1978; Giguere et al., 2000), absolute Boyce and Johnson (1978) derived absolute model ages that radiometric age data for the majority of basalts are still lacking. indicate volcanism might have lasted from 3.85 ± 0.05 b.y. until Consequently, on the basis of the samples alone, the onset and 2.5 ± 0.5 b.y. ago. Support for such young basalt ages comes extent of mare volcanism are not well understood (summarized from the lunar meteorite Northwest Africa (NWA) 032, which by Nyquist et al., 2001). The returned samples indicate that mare shows an Ar-Ar whole-rock age of ca. 2.8 Ga (Borg et al., 2007; volcanism was active at least between ca. 3.9 and 3.1 Ga (Head, Fagan et al., 2002). In addition, similar young ages for basal- 1976; Nyquist and Shih, 1992). Ages of some basaltic clasts in tic meteorites NWA 479 and several fragments of Lapaz Icefield older breccias point to an onset of mare volcanism prior to 3.9 Ga (LAP) (02205, 02224, 02226, 02436, 03632, 04841) have been (Ryder and Spudis, 1980), perhaps as early as 4.2–4.3 Ga in the reported by Fernandes and Burgess (2006) and Fernandes et al. Apollo 14 region (Nyquist et al., 2001; Taylor et al., 1983; Dasch (2003). The 40Ar-39Ar plateau dating for NWA 479 yielded ages et al., 1987). Fortunately, we can derive relative and absolute of 2.734 Ga (Fernandes and Burgess, 2006). Various techniques model ages for unsampled regions with remote-sensing tech- (Ar-Ar, Rb-Sr, Sm-Nd, U-Pb) applied to radiometrically date the niques. For example, inspection and interpretation of superposi- LAP meteorites have revealed ages of 2.915–3.02 Ga (Shih et tion of geologic units onto each other, embayment, and cross- al., 2005; Fernandes and Burgess, 2006; Anand et al., 2006; Ran- cutting relationships within high-resolution Apollo and Lunar kenburg et al., 2007), indicating that lunar volcanism was active Orbiter images have been used to obtain relative ages for lunar later in lunar history than is documented in the Apollo and Luna surface units (e.g., Shoemaker and Hackman, 1962). In addition, sample collection. it has been shown that crater degradation stages and crater size- Schultz and Spudis (1983) performed crater size-frequency frequency distribution measurements, calibrated to the landing distribution measurements for basalts embaying the Copernican sites, are useful to derive relative and absolute model ages (e.g., crater Lichtenberg and concluded that these basalts might even
- 4. Downloaded from specialpapers.gsapubs.org on August 28, 2011 Ages and stratigraphy of lunar mare basalts 3 be younger than 1 b.y. old. However, on the basis of crater counts basalts in Oceanus Procellarum, Imbrium, Serenitatis, Tranquilli- on Lunar Orbiter IV images, Hiesinger et al. (2003) derived older tatis, Humboldtianum, Australe, Humorum, Nubium, Cognitum, ages for the Lichtenberg basalts of 1.68 Ga, and even older ages Nectaris, Frigoris, and numerous smaller occurrences like impact of 2.20 Ga resulted from crater counts on SELENE Terrain Cam- craters and sinus and lacus areas (Fig. 1). Compared to previous era images (Morota et al., 2008). studies (e.g., Hartmann, 1966; Greeley and Gault, 1970; Neukum Crater size-frequency ages for mare basalts on the lunar far- et al., 1975a), we performed crater size-frequency distribution side were derived, for example, by Haruyama et al. (2009). Har- measurements for basalt units that are, to a first order, spectrally uyama et al. (2009) concluded that the majority of mare volca- homogeneous. A major goal of this study is to provide absolute nism on the lunar farside ceased ~3.0 b.y. ago. However, they also model ages of lunar nearside mare basalts in order to investigate identified mare deposits in several locations on the lunar farside their stratigraphy and to better understand the nature and evolu- (i.e., Antoniadi, Apollo N, Apollo S, Nishina, Mare Moscovi- tion of lunar mare basalt volcanism. ense) that show much younger ages, clustering at ca. 2.5 b.y. ago. On the basis of our crater size-frequency model ages, we Haruyama et al. (2009) argued that these young ages indicate that address the following questions: (1) What was the time period of mare volcanism on the lunar farside lasted longer than was previ- active lunar volcanism, i.e., when did volcanism start and when ously considered (e.g., Stuart-Alexander, 1978; Wilhelms et al., did it end? (2) Was lunar volcanism continuously active or are 1979; Walker and El-Baz, 1982; Wilhelms, 1987) and may have there distinctive periods of volcanic activity? (3) Is there a trend occurred episodically. in the spatial distribution of basalt ages on the lunar surface? Here, we summarize and synthesize our ages for the (4) What do the temporal distribution and abundance of mare majority of lunar nearside mare basalts exposed at the surface basalts tell us about the role of mare volcanism in the crustal and (Hiesinger et al., 2000, 2001, 2002, 2003, 2010). We have dated thermal evolution of the Moon? Figure 1. Map of the lunar surface showing the location of the investigated basins, the Apollo and Luna landing sites, and the location of selected features mentioned in the text. MV—Mare Vaporum, SM—Sinus Medii, PP—Palus Putredinis. Latitude, longitude grid is 30° × 30° wide; simple cylindrical projection. (from Hiesinger et al., 2010.)
- 5. Downloaded from specialpapers.gsapubs.org on August 28, 2011 4 Hiesinger et al. TECHNIQUE, APPROACH, AND THE DEFINITION cal unit, one has to (1) measure the surface area of the unit, and OF UNITS (2) measure the diameters of each primary impact crater within this unit. Obtained crater diameters are sorted into 18 bins per Four methods have been used to derive the ages of lunar diameter decade (i.e., in the interval 1 ≤ D ≤ 10, we have the steps mare basalts, (1) radiometric investigations of lunar samples 1.0, 1.1, 1.2, 1.3, 1.4, 1.5, 1.7, 2.0, 2.5, 3.0, 3.5, 4.0, 4.5, 5.0, 6.0, (e.g., Papanastassiou and Wasserburg, 1971; Tera and Wasser- 7.0, 8.0, 9.0, 10.0) and plotted as cumulative distributions (e.g., burg, 1974a, 1974b; Husain, 1974; Nunes et al., 1974; Schaefer Arvidson et al., 1979), which give the number of craters larger and Husain, 1974; Maurer et al., 1978; Guggisberg et al., 1979; than or equal to a certain diameter per area measured. Ryder and Spudis, 1980; BVSP, 1981; Taylor et al., 1983; Dasch It has been shown that lunar crater distributions measured on et al., 1987; Nyquist and Shih, 1992; Nyquist et al., 2001; Gaff- geologic units of different ages and in overlapping crater diam- ney et al., 2008), (2) studies of crater degradation stages (e.g., eter ranges can be aligned along a complex continuous curve, Soderblom, 1972; Boyce, 1976; Boyce and Johnson, 1978), the lunar production function (e.g., Neukum, 1983; Neukum and (3) stratigraphic approaches (e.g., Shoemaker and Hackman, Ivanov, 1994; Neukum et al., 2001). The lunar production func- 1962; Wilhelms, 1970; Wilhelms, 1987), and (4) crater size- tion is given by an eleventh-degree polynomial frequency distribution measurements (e.g., Hartmann, 1966; Greeley and Gault, 1970; Neukum et al., 1975b; Neukum, 1977; 11 k Hiesinger et al., 2000, 2003, 2010). log( Ncum ) = a0+ ∑ ak (log( D)) , (1) k =1 Radiometric investigations of lunar rocks in the laboratory are restricted to a relatively small number of returned samples and provide ages only for the close vicinity of the Luna and where a0 represents the amount of time over which the unit has Apollo landing sites. Data derived from crater degradation stages been exposed to the meteorite bombardment (Neukum, 1983; can give us ages for the entire lunar surface, but numerous endo- Neukum and Ivanov, 1994; Neukum et al., 2001). Compared to genic and exogenic processes can influence the appearance of the production function of Neukum (1983), which we used for lunar impact craters, decreasing the certainty of age assignments. our previous age determinations (Hiesinger et al., 2000, 2001, In addition, there are some discrepancies between crater degra- 2002, 2003), Neukum et al. (2001) slightly reworked their pro- dation ages and radiometric ages for specific landing sites. Bur- duction function for the larger-crater part. This resulted in a new gess and Turner (1998), for example, reported young radiometric set of coefficients for Equation 1, which are given in Table 1. 40 Ar -39Ar ages (3.2–3.3 Ga) for the Luna 24 landing site, which The cumulative crater density of a geologic unit taken at a fixed are in disagreement with ages derived from crater degradation reference diameter (usually 1 or 10 km) is directly related to the measurements (3.5 ± 0.1 Ga) by Boyce and Johnson (1978). For time the unit has been exposed to the meteorite flux and therefore the Luna 24 landing site, Burgess and Turner (1998) concluded gives a relative age of this unit. that crater degradation ages have to be reassessed in light of the One of the major geologic goals of the Apollo missions was new expanded radiometric age data. Using the ejecta blankets to return lunar samples that could be dated in the laboratory with of impact craters as a stratigraphic marker horizon, Wilhelms radiometric techniques (e.g., Rb-Sr, Sm-Nd, Ar-Ar). To obtain (1987) was able to construct a moonwide relative stratigraphy absolute model ages from crater size-frequency distribution mea- by investigating superposition of ejecta blankets on each other. surements, one has to link the radiometric ages from the returned Additional application of the superposition criteria to mare basalt Apollo and Luna samples to crater counts of these landing sites units (e.g., Head, 1976; Whitford-Stark, 1979; Whitford-Stark and Head, 1980) provided relative ages for the entire lunar sur- face and is one of the most important tools in geologic mapping TABLE 1. COEFFICIENTS IN EQUATION 1* and the interpretation of geologic processes on the Moon. Coefficient “Old” N(D) “New” N(D) Crater size-frequency distribution measurements are a pow- (Neukum, 1983) (Ivanov et al., 2001; Neukum et al., 2001) erful remote-sensing technique to derive relative and absolute model ages of unsampled planetary surfaces. Since this technique a0 – 3 .0 7 6 8 –3.0876 is described elsewhere (e.g., Neukum and Ivanov, 1994; Hiesinger a1 – 3 .6 2 6 9 –3.557528 a2 +0.4366 +0.781027 et al., 2000, 2003, 2010; Stöffler and Ryder, 2001; Neukum et al., a3 +0.7935 +1.021521 2001; Ivanov, 2001; Hartmann and Neukum, 2001; Stöffler et al., a4 +0.0865 –0.156012 2006; and references therein), we will only briefly outline how a5 –0.2649 –0.444058 crater size-frequency distribution measurements can be used to a6 –0.0664 +0.019977 a7 +0.0379 +0.086850 date surfaces. The technique of crater size-frequency distribution a8 +0.0106 –0.005874 measurements on spectrally homogeneous regions, including a a9 –0.0022 –0.006809 discussion of model assumptions, strengths, and shortcomings, a10 –5.18 × 10 –4 +8.25 × 10 –4 –5 –5 and an error analysis, has been described in detail by Hiesinger et a11 +3.97 × 10 +5.54 × 10 al. (2000). In short, in order to obtain the age of a photogeologi- *From Neukum et al. (2001).
- 6. Downloaded from specialpapers.gsapubs.org on August 28, 2011 Ages and stratigraphy of lunar mare basalts 5 in order to establish the lunar cratering chronology (e.g., BVSP, 1.5 b.y. ago (N[D = 1 km] = [1.3 ± 0.3] × 10−3), while radiomet- 1981; Neukum, 1983; Strom and Neukum, 1988; Neukum and ric dating of samples, which are thought to represent Copernicus Ivanov, 1994; Stöffler and Ryder, 2001). For this purpose, cra- ejecta, indicates an age of 0.85 ± 0.1 Ga (Silver, 1971) or even ter counts for the Apollo 11, 12, 14, 15, 16, 17, and the Luna 0.80 Ga (Eberhardt et al., 1973; Alexander et al., 1976) (Fig. 2). 16 and 24 landing sites were performed and correlated with the The linkage of lunar sample ages to discreet basin-forming corresponding radiometric ages of these sites (e.g., BVSP, 1981; events is still subject to discussion (e.g., Wilhelms, 1987; Spu- Neukum, 1983; Strom and Neukum, 1988; Neukum and Ivanov, dis, 1993; Neukum and Ivanov, 1994; Stöffler and Ryder, 2001). 1994; Stöffler and Ryder, 2001). However, this is not a trivial task For example, based on their reevaluation of lunar samples, Stöf- and has led to several more or less different chronologies (e.g., fler and Ryder (2001) concluded that the Nectaris basin is BVSP, 1981; Neukum, 1983; Neukum and Ivanov, 1994; Stöffler 3.92 ± 0.03 b.y. old, and hence younger than in the Neukum and and Ryder, 2001; Stöffler et al., 2006; and references therein). Ivanov (1994) chronology. This interpretation by Stöffler and Ryder It is well known that lunar samples of each landing site show a (2001) is consistent with the conclusions of Spudis (1993). For the range of radiometric ages, which is due to an unknown combina- Imbrium basin, Stöffler and Ryder (2001) discussed two ages, rang- tion of vertical and horizontal mixing (BVSP, 1981). For exam- ing from 3.85 ± 0.02 Ga to 3.77 ± 0.02 Ga, the latter age being ple, if the investigated sample is a breccia, the individual par- inconsistent with previously published ages of 3.80–3.85 Ga for ticles can reflect very different geologic histories and reset ages. the Orientale basin (e.g., Wilhelms, 1987; Schaefer and Husain, For breccia 73215, Jessberger et al. (1977) reported variations 1974). From this discussion, we conclude that the ages of indi- in the K-Ar ages of up to 300 m.y., and this raises the issue of vidual lunar impact basins are still under discussion (e.g., James, which radiometric age should be assigned to the corresponding 1981; Wetherill, 1981; Deutsch and Stöffler, 1987; Wilhelms, 1987; crater size-frequency distribution. In principle, there are two pos- Stadermann et al., 1991; Neukum and Ivanov, 1994; Stöffler and sibilities for correlating crater size-frequency distributions with Ryder, 2001; Stöffler et al., 2006). From a literature search for ages radiometric ages, i.e., the correlation with the most frequently of specific lunar basins, we conclude that the basin ages derived measured age (e.g., Neukum and Ivanov, 1994; Neukum, 1983; with the lunar chronology of Neukum (1983) and Neukum and Iva- Neukum et al., 1975a) or with the youngest age (e.g., Jessberger nov (1994) are well within the range of previously published ages et al., 1974; BVSP, 1981; Wilhelms, 1987). Neukum (1983) and (Table 2), and we adopt these ages for the present paper. Neukum and Ivanov (1994) argued that the “peak age” is the The empirically derived chronology of Neukum and Ivanov age that most likely reflects the major event/impact that reset the (1994) and Neukum et al. (2001), which we use for our studies, radiometric clocks of most samples, whereas the youngest age is given by might only represent smaller local impacts that occurred after the main impact. The reasoning for adopting the peak age is dis- Ncum(D ≥ 1 km) = 5.44 × 10⁻¹⁴ [exp(6.93 × t) – 1] (2) cussed in greater detail by Neukum and Ivanov (1994). + 8.38 × 10⁻⁴ t. For the discussion of the basalt stratigraphy, it is not crucial whether the peak age or the youngest radiometric age is used for A variety of techniques have been applied in order to correlate the correlation with the crater counts of the landing sites. To a first crater frequencies with radiometric ages. Neukum and Wise order, this will only result in a shift of all absolute model ages; (1976) and Neukum and Ivanov (1994) compared the impact the relative stratigraphy of the basalt units is not affected. How- chronologies of several authors (Baldwin, 1971, 1974, 1987; ever, the laterally extensive ejecta deposits of Nectaris, Imbrium, Soderblom and Boyce, 1972; Hartmann, 1972; Soderblom et al., Eratosthenes, and Copernicus have been used for the definition of 1974; Neukum, 1971, 1977, 1983; Neukum and Ivanov, 1994) the lunar stratigraphic systems (e.g., Wilhelms, 1987). Based on and found that the interpretations of these authors all coincide assumptions about the particular sample of a certain Apollo land- within a factor of 2–3. Once the lunar chronology is established, ing site that represents the ejecta material of these basins and cra- we can derive absolute model ages for the entire lunar surface ters, absolute ages have been assigned to the chronostratigraphic from crater size-frequency distribution measurements by solving systems (e.g., Wilhelms, 1987; Neukum, 1983; Neukum and Iva- Equation 2 for time t for Ncum(D ≥ 1 km) measured on the geo- nov, 1994). Therefore, for the discussion of absolute model ages logic unit to be dated. of basalt units and the application of terms like “Eratosthenian” or A crucial prerequisite for reliable age determinations using “Imbrian,” the reader must be aware of the differences in the defi- crater size-frequency distribution measurements is the mapping nition of the chronostratigraphic systems (e.g., Wilhelms, 1987; of homogeneous count areas. The mare regions of the Moon Neukum and Ivanov, 1994) (Fig. 2). In our papers (Hiesinger et have been previously geologically mapped by several authors al., 2000, 2003, 2010), we adopted the system of Neukum and (e.g., Wilhelms and McCauley, 1971; Wilhelms, 1968, 1987; Ivanov (1994), with Nectaris having an age of 4.1 ± 0.1 Ga (N[D = Wilhelms and El-Baz, 1977; Holt, 1974; McCauley, 1967, 1973; 1 km] = [1.2 ± 0.4] × 10−1), and the Imbrium basin being 3.91 ± Howard and Masursky, 1968; Schmitt et al., 1967; Eggleton, 0.1 b.y. old (N[D = 1 km] = [3.5 ± 0.5] × 10−2). According to 1965; Trask and Titley, 1966; Hackman, 1962, 1966; Marshall, Neukum (1983), the Eratosthenian System started ~3.2 b.y. ago 1963; Moore, 1965, 1967; M’Gonigle and Schleicher, 1972; (N[D = 1 km] = 3.0 × 10⁻³) and the Copernican System began at Wilshire, 1973; Scott et al., 1977; Titley, 1967; Schaber, 1969;
- 7. Downloaded from specialpapers.gsapubs.org on August 28, 2011 6 Hiesinger et al. Figure 2. Comparison of stratigraphies of Wilhelms (1987), Neukum and Iva- nov (1994), and Stöffler and Ryder (2001). Dashed lines in the stratigra- phies of Wilhelms (1987) and Neukum and Ivanov (1994) indicate radiometric ages, which these authors attribute to the formation of the crater Copernicus. In Stöffler and Ryder (2001), two for- mation ages for the Imbrium basin have been proposed, that is, 3.85 Ga and 3.77 Ga (dashed line). (from Hiesinger et al., 2010.) TABLE 2. ABSOLUTE MODEL AGES OF LUNAR IMPACT BASINS IN BILLION YEARS (Ga)* Basin Baldwin Baldwin Jessberger Maurer Schaefer Nunes et al. Wilhelms Neukum Stöffler and (1974) (1987) et al. (1974) et al. and Husain (1974) (1987) (1983) Ryder (1978) (1974) (2001) Orientale 3.80 3.82 – – 3.85 3.85 3.80 3.84 – Imbrium 3.95 3.85 3.87–3.90 3.88 4.00 3.99 3.85 3.92 3.85 (3.77) † Crisium 4.05 4.00 3.90 4.13 4.13 3.84 – 3.89 (3.84) Nectaris 4.21 4.07 3.98 3.98 4.20 4.2 3.92 4.10 3.92 (3.85) § Serenitatis 4.25 4.14 3.97 – 4.45? 3.87 3.98 3.89 (3.87) # Humorum 4.25 4.23 3.92–3.95 – 4.13–4.20 4.13–4.2 3.99 – *Modified from Baldwin (1987). † Between Imbrium and Nectaris. § Older than Nectaris. # Between Nubium and Imbrium.
- 8. Downloaded from specialpapers.gsapubs.org on August 28, 2011 Ages and stratigraphy of lunar mare basalts 7 Ulrich, 1969; Scott and Eggleton, 1973; Lucchitta, 1972, 1978; to measure the crater size-frequency distribution. This was neces- Karlstrom, 1974; Scott et al., 1977). However, because the defini- sary because Clementine images are not very well suited for cra- tion of geologic units in these maps was based mainly on albedo ter counts due to their high sun angles. Figure 4 is a comparison differences, morphology, and qualitative crater densities on tele- of a Lunar Orbiter image and a Clementine image, and it illus- scopic and Lunar Orbiter images, these maps are not detailed trates the differences in the ability to detect small craters in these enough to ensure homogeneity of the investigated basalts. It is two data sets. The detailed views show that some craters that are known that regional spectral differences of surface materials can clearly visible in the Lunar Orbiter image are barely detectable be mapped by using ratios of various spectral bands to bring out and certainly not countable in the Clementine image. Because diagnostic spectral features (e.g., Whitaker, 1972; McCord et al., miscounting certain craters has profound effects on the quality 1976; Johnson et al., 1977a, 1977b; Pieters, 1978; Head et al., of the crater size-frequency distribution measurement, and hence 1993). Regions where the spectral signature is homogeneous can the age of an investigated unit, we chose not to perform crater be interpreted as surface mare units that are relatively uniform counts on Clementine material. Despite their excellent quality, in surface composition, and thus may plausibly be interpreted we also chose not to count on Apollo metric camera or panoramic to represent single eruptive episodes. Thus, we used a multi- images because only Lunar Orbiter images provide a systematic spectral high-resolution Clementine color ratio composite (e.g., coverage of all investigated mare areas. Compared to previous 750/415 ratio as red, 750/950 ratio as green, and 415/750 ratio age determinations, our data fit spectral and lithological units and as blue) in order to map the distribution of distinctive basalt units represent a major improvement in accuracy. (Fig. 3A). In this color scheme, variations in the extended vis- The method of crater size-frequency measurements is gen- ible continuum slope are shown as red (high 750/415) to blue erally dependent on the quality, i.e., the spatial resolution and (high 415/750) variations. These ratios are interpreted to reflect the illumination conditions, of the images on which the crater variations in soil or surface material maturity (e.g., Pieters, 1993, counts are performed. Contrast, brightness, and resolution of the and references therein). Variations in the 1 µm region of the images used for crater counts are important parameters because electromagnetic spectrum add yellow and green hues for larger all can have influence on the detectability of craters, especially on 750/950 values. This implies stronger 1 µm absorptions, flatter dark mantle deposits. In our studies, we relied on high-resolution continuum slope, or both. The depth of the 1 µm absorption band imaging data provided by the Lunar Orbiter IV mission in 1967 is correlated with the Fe abundance (e.g., Pieters, 1993, and ref- to determine lunar surface ages. Even more than 40 years after erences therein). Thus, most of the spectral variation within an the Lunar Orbiter IV mission, its images, with a spatial resolu- image is captured by this color ratio composite (Pieters et al., tion of 60–150 m, an incidence angle of 10°–30°, and excellent 1994). Because this color ratio emphasizes subtle spectral dif- contrast, are still extremely well suited and useful for the acquisi- ferences, it was used to visually determine the boundaries of our tion of crater size-frequency distributions. However, new images spectrally homogeneous units. We did not apply stringent statisti- from the American Lunar Reconnaissance Orbiter, the Chinese cal techniques to ensure accurate outlines of these spectral units Chang’e, the Japanese SELENE/Kaguya, and the Indian Chan- because this is not too critical for our study since our count areas drayaan missions will soon supersede the Lunar Orbiter images are usually only subsets of each spectral unit, i.e., the count areas in spatial resolution, coverage, and illumination geometry, allow- are located somewhere within the spectral units. For our count ing us to globally perform highly accurate crater counts. areas, we selected only regions with visually homogeneous color. Potential errors in the determination of relative ages using For the definition of our spectral units, we also used the informa- crater size-frequency distribution measurements can be caused tion from U.S. Geological Survey (USGS) geologic maps (e.g., by several factors. Errors in the determination of the size of the Wilhelms and McCauley, 1971), as well as other previously pub- measured area, errors in the determination of crater diameters on lished maps (e.g., Schaber, 1973; Schaber et al., 1976; Pieters, monoscopic images, and errors caused by volcanic craters are 1978; Whitford-Stark and Head, 1980; Whitford-Stark, 1990), in negligible (Neukum et al., 1975b; Engel, 1986). Errors introduced order to incorporate all relevant information for our unit defini- by different crater sizes due to differences in target material are tion. Visually, these older morphologic and spectral maps cor- irrelevant because we dated only lunar mare basalts. Therefore, it relate well with our definition of spectral units. However, we is reasonable to assume that the physical properties (i.e., density) expanded on these previous studies by defining many more units that might influence the crater size are very similar for all these in previously uncharted regions. We assume that because of the basalts. Neukum et al. (1975b) discussed the influence of factors spectral homogeneity, each of our spectrally defined units repre- such as flooding, blanketing, secondary cratering, superposition, sents a single eruptive phase. We define “single eruptive phase” infilling, abrasion, mass wasting, and volcanic craters in great as consisting of all deposits that were emplaced within a rea- detail. Secondary craters form from ejected material of a primary sonably short period of time with similar composition. Such a crater and hence are not correlated to the impact rate. Most of single eruptive phase may consist of a single basalt flow or of those secondary craters can be readily identified and excluded several breakout flows forming during the same eruption. Having from crater counts by their appearance in clusters, crater chains, defined such units in Clementine images, we transferred the unit elongated or irregular outline, and the herringbone pattern of boundaries to high-resolution Lunar Orbiter IV images in order their ejecta (Oberbeck and Morrison, 1973; Pike, 1980; Melosh,
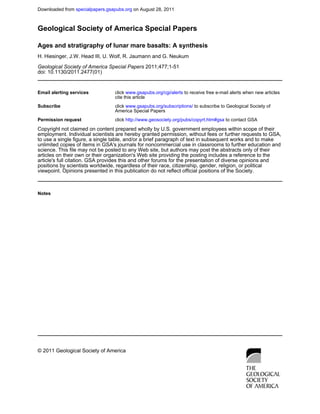
- 9. Downloaded from specialpapers.gsapubs.org on August 28, 2011 8 Hiesinger et al. Figure 3. (A) Color ratio composite image based on three spectral ratios of Clementine imaging data (750/415 on red, 750/950 on green, 415/750 on blue). Black lines define spectral units. We have performed crater size-frequency distribution measure- ments for most of these units. Map coverage: ~90°W–120°E, ~75°S–75°N; latitude, longitude grid is 15° × 15° wide. (B) Crater degradation ages of lunar nearside surface units (Boyce, 1976; Boyce and Johnson, 1978). Ages are in billion years. Black lines outline spectrally homogeneous units (also see part A). Map coverage: ~90°W–120°E, ~75°S–75°N; latitude, longitude grid is 15° × 15° wide. (from Hiesinger et al., 2010.)
- 10. Downloaded from specialpapers.gsapubs.org on August 28, 2011 Ages and stratigraphy of lunar mare basalts 9 Figure 4. Comparison between Lunar Orbiter IV 109H2 (A) and Clementine (B) image of the Rima Bode area for the purpose of crater size-frequency distribution measurements (Hiesinger et al., 2003). Two examples of craters clearly measurable in the lower-sun Lunar Orbiter image are either barely visible or saturated in the high-sun Clementine image. This would yield incorrect crater statistics and less reliable ages. The Lunar Orbiter image has been subjected to a Fast Fourier transformation in order to remove the stripes and has been map-projected. A detailed description of the image processing of the Lunar Orbiter data is given by Gaddis et al. (2001). 1989). However, Bierhaus et al. (2005) raised concerns about the will not re-impact the surface but will leave the body. In addition, influence of secondary craters on the dating of the surface of the observations of near-Earth asteroids (NEA) yield steep size dis- Jovian moon Europa, and based on findings for the Martian cra- tributions very similar to lunar crater size distributions (Werner ter Zunil, McEwen (2003) and McEwen et al. (2005) discussed et al., 2002). Finally, observations by Malin et al. (2006) indicate the effects of secondary cratering on crater size-frequency age that the number of newly formed Martian craters agrees within determinations. McEwen et al. (2005) and Preblich et al. (2007) a factor of 2–3 with the cratering rate of Hartmann and Neu- studied the 10-km-diameter Martian crater Zunil and found that kum (2001). Malin et al. (2006) reported on 20 Martian impacts this crater produced ~107 secondary craters in the size range of 2–150 m in diameter created between May 1999 and March 10–200 m that extend up to 1600 km away from crater. McEwen 2006. They concluded that the values predicted by models that et al. (2005) concluded that the production functions of Hart- scale the lunar cratering rate to Mars are close to the observed mann and Neukum (2001) overpredict primary craters smaller rate (Malin et al., 2006). Therefore, Hartmann (2007a) argued than a few hundred meters in diameter by a factor of 2000, simi- that the new observations of Malin et al. (2006), if correct, are lar to the conclusions of McEwen and Bierhaus (2006). McEwen inconsistent with suggestions by McEwen (2003), McEwen et al. et al. (2005) concluded that crater counts for craters <1 km in (2005), Bierhaus et al. (2005), and McEwen and Bierhaus (2006) diameter are dominated by secondary craters and therefore do not that small craters must be dominated by secondary craters by fac- yield reliable age determinations. tors of ~102–103. Werner et al. (2006) and Neukum et al. (2006) A solid argument that the observed steep −3 to −3.5 distribu- argued that less than 5% of craters smaller than 1 km in diam- tion of small craters results from small primary projectiles stems eter are secondary craters and hence do not have a significant from observations of the Main Belt asteroid 951 Gaspra, which effect on the ages derived with crater counts. König (1977), Hart- shows such a steep distribution down to the smallest measure- mann (2005), Werner (2006), Werner et al. (2006), Neukum et able crater diameters (Neukum and Ivanov, 1994; Chapman et al. (2006), Hartmann et al. (2008), and Wagner et al. (2010) dis- al., 1996a, 1996b). Secondary impact craters are less likely to cussed the issue of secondary cratering and its influence on crater occur on Gaspra because, due to its low gravity, ejected material size-frequency ages in more detail and came to the conclusion
- 11. Downloaded from specialpapers.gsapubs.org on August 28, 2011 10 Hiesinger et al. that secondary cratering does not pose a significant problem for been interpreted by Neukum and Horn (1976) to indicate resur- dating of planetary surfaces using crater size-frequency distribu- facing, i.e., flooding with subsequent lavas. tion measurements. While the effect of secondary impact cra- In Oceanus Procellarum, we dated 60 units. Using the chro- tering on the production function of small craters is a matter of nostratigraphic system of Neukum and Ivanov (1994), basalts ongoing debate (e.g., Hartmann, 2007a, 2007b), it is of lesser of 19 units are Imbrian in age. For three of these 19 units, we importance for our crater counts because the spatial resolution were able to detect late-stage flooding events during the Imbrian of the Lunar Orbiter IV images of 60–100 m (Wilhelms, 1987) Period. Thirty-six units in Oceanus Procellarum are Eratos- only allowed us to count craters larger than ~300–400 m, and thenian in age, and 13 of them also show older Imbrian ages. these smallest craters were not even used for the determination Finally, if we apply the chronostratigraphic system of Neukum of our ages. and Ivanov (1994), five basalt units are of Copernican age. If one The level of uncertainty of the crater retention age of a given uses the chronostratigraphic system of Wilhelms (1987) or Stöf- count is given by the following equation: fler and Ryder (2001), these basalts would be of Eratosthenian age (Fig. 2). ⎡ N (1) ± N (1) ⎤ Earlier attempts to measure the ages of surface units relied ±σ N = log ⎢ ⎥, (3) on crater degradation stages (e.g., Boyce, 1976; Boyce and John- ⎣ A ⎦ son, 1978). Crater degradation ages of Boyce (1976) and Boyce and Johnson (1978) were performed for 1/4° squares (~8 km), in which N(1) is the crater retention age calculated for craters were interpolated by spatial filtering into a continuous image, of 1 km diameter, and A is the size of the counted area. The and do not necessarily fit lithological or spectral units (Fig. 3B). ±σN value gives the upper and lower limits of the error bar While units P1, P18, P20, P21, P22, P23, P29, P30, P31, P32, of the crater retention age, which are used for estimating the P36, P38, P41, P44, P48, P50, and P59 exhibit a single degrada- uncertainty of the absolute crater model age from the cratering tion age, all other units show at least two, and some units (P10, chronology. We principally assumed that the cratering chronol- P13) show up to four different ages in the map of Boyce and ogy is free of errors. Therefore, errors in our absolute model Johnson (1978). The implication is that ages derived from the ages are only caused by errors in the determination of crater map of Boyce and Johnson (1978) can vary up to 1.25 b.y. for frequencies (Neukum, 1983). Neukum et al. (1975a) estimated a single spectral unit. In numerous cases (P2, P3, P4, P8, P9, the systematic uncertainty of the standard distribution curve or P11, P13, P14, P17, P24, P26, P27, P34, P35), the ages of Boyce the measurement to be <10% for 0.8 km ≤ D ≤ 3 km (this is the (1976) and Boyce and Johnson (1978) give us an upper and lower diameter range of most of our crater counts) and up to 25% for boundary, and our ages are either right in between or close to one 0.8 km ≤ D ≤ 10 km. or the other boundary (Table 3). In other cases (P1, P5, P7, P10, In order to facilitate the discussion of our model ages, we P15, P16, P19, P33), the spatially most abundant age of Boyce avoided assigning type locality names to each unit. Instead, we (1976) and Boyce and Johnson (1978) is similar to our age of a rely on a simple letter/number system. The letter indicates the particular unit. Generally, we find a good agreement of our ages basin (A—Australe, H—Humorum, Hu—Humboldtianum, I— with ages of Boyce (1976) and Boyce and Johnson (1978) for Imbrium, S—Serenitatis, T—Tranquillitatis, P—Oceanus Pro- units of Imbrian age. Only units P6 and P12 appear to be older cellarum, N—Mare Nubium, C—Mare Cognitum, IN—Mare than in the maps of Boyce (1976) and Boyce and Johnson (1978). Insularum, F—Mare Frigoris, V—Mare Vaporum, Ma—Mare Ages of units that are young according to our data are systemati- Marginis, Sy—Mare Smythii, SM—Sinus Medii, LT—Lacus cally overestimated in age (older) in the Boyce map (P25, P28, Temporis, LA—Lacus Aestatis, PP—Palus Putredinis, CGr— P39, P43, P46, P47, P49, P51, P55, P56, P57, P58, P60), and we Grimaldi, CCr—Crüger, CRo—Rocca A, CSc—Schickard, find less agreement for younger units, i.e., late Eratosthenian and CHu—Hubble, CJo—Joliot, CGo—Goddard), and the number Copernican units. Units P40, P45, P52, and P53 show evidence describes the unit within a basin. In a style similar to the geologic for resurfacing, with both ages bracketing or being similar to the maps of the Moon, lower numbers reflect older units, and higher Boyce ages. Finally, units P37, P42, and P54 are not covered in numbers indicate a younger age. the Boyce map. Units P1, P2, P3, P4, P5, and P7 were mapped as Imbrian RESULTS in age in the geologic maps of Wilhelms and McCauley (1971), Moore (1965), McCauley (1967), and Lucchitta (1978). Our data Oceanus Procellarum confirm an Imbrian age for these units and also confirm Wilhelms and McCauley’s Imbrian ages for units P10, P14, and P16. Luc- Based on our crater size-frequency distributions, we con- chitta (1978) mapped unit P6 as Eratosthenian, and Scott et al. clude that basalt model ages in Oceanus Procellarum range from (1977) mapped several units (P3, P9, P10, P12, P14, P15, P16, ca. 1.2 to ca. 3.93 Ga (Hiesinger et al., 2003) (Fig. 5; Table 3). P18, P19) as Imbrian and/or Eratosthenian in age. Our data only Sixteen units, that is ~25% of all dated units, show characteris- show Imbrian ages and no Eratosthenian ages for these units. For tic kinks in their crater size-frequency distributions, which have unit P8, P9, P11, P12, P14, P15, P17, P18, and P19, Eratosthenian
- 12. Downloaded from specialpapers.gsapubs.org on August 28, 2011 Ages and stratigraphy of lunar mare basalts Figure 5. Spatial distribution of model ages for spectrally defined units in Oceanus Procellarum (Hiesinger et al., 2003). (A) U.S. Geological Survey shaded relief map, simple cylin- drical map projection. Spectral units are outlined in black. (B) Sketch map of Oceanus Procellarum showing unit numbers and model ages in billion years (also see Table 3). Crater size-frequency distribution measurements were performed for the areas highlighted in dark gray. Black areas are non-mare materials or have been excluded from this investigation. 11
- 13. 12 TABLE 3. COMPARISON OF AGES FOR BASALTS IN OCEANUS PROCELLARUM* Unit Lunar Area Crater Error Model Error Boyce Wilhelms Moore Moore Marshall Hackman McCauley McCauley Wilshire Titley Scott Ulrich Scott Lucchitta Orbiter (km2) retention age (b.y.) (1976) and (1965) (1967) (1963) (1962) (1967) (1973) (1973) (1967) and (1969) et al. (1978) image age N(1) (Ga) McCauley Eggleton (1977) (1971) (1973) P60 IV157H3 1429 1.01E–03 +0.26E–03/ 1.2 +0.32/ 3.2, Im Ipm Ipm EIm –0.30E–03 –0.35 2.5, 3.5 P59 IV158H1 789 1.01E–03 +0.34E–03/ 1.21 +0.40/ 3.2 Im Ipm Ipm Im –0.35E–03 –0.42 P58 IV158H2 2551 1.11E–03 +0.17E–03/ 1.33 +0.19/ 3.2, Em, Im Em, Im EIm –0.21E–03 –0.25 3.5, 3.65 P57 IV150H1 2631 1.12E–03 +0.41E–03/ 1.33 +0.49/ 2.5, –0.08E–03 –0.08 3.2, 3.5 P56 IV170H3 1765 1.25E–03 +0.41E–03/ 1.49 +0.49/ 2.5, Em, Im EIm Em –0.46E–03 –0.55 3.2 P55 IV170H3 1057 1.40E–03 +0.44E–03/ 1.67 +0.52/ 3.2, –0.46E–03 –0.55 3.5 P54 IV149H2 1118 1.40E–03 +0.49E–03/ 1.67 +0.58/ no age Em Pm Em –0.50E–03 –0.59 P53 IV170H1 5886 1.40E–03/ +0.26E–03/ 1.68/ +0.30/ 2.5, Em, Im Cmd, Em, Im EIm 2.88E–03 –0.09E–03 3.18 –0.12 3.2 Ipm, +0.20E–03/ +0.08/ Ipmd –0.20E–03 –0.10 P52 IV150H2 4075 1.45E–03/ +0.23E–03/ 1.73/ +0.29/ 2.5, Em, Im Pm 1.17E–02 –0.26E–03 3.72 –0.31 3.2 +0.67E–03/ +0.08/ –2.57E–03 –0.05 P51 IV144H2 1357 1.55E–03 +0.31E–03/ 1.85 +0.37/ 3.2, Im, Em Ipm EIm –0.29E–03 –0.34 2.5 P50 IV133H1 2000 1.56E–03 +0.48E–03/ 1.87 +0.56/ 2.5 Em, Im Pm Downloaded from specialpapers.gsapubs.org on August 28, 2011 –0.20E–03 –0.25 Hiesinger et al. P49 IV157H2 4822 1.63E–03 +0.31E–03/ 2.01 +0.37/ 2.5, Im, Em Ipmd, EIm –0.36E–03 –0.43 3.2, Ipm 3.5 P48 IV144H3 1091 1.71E–03 +0.39E–03/ 2.04 +0.46/ 3.5 Im Ipm –0.45E–03 –0.54 P47 IV144H1 1665 1.74E–03 +0.55E–03/ 2.08 +0.65/ 2.5, Im Pm Pm –0.32E–03 –0.39 3.2 P46 IV132H3 1076 1.74E–03 +0.50E–03/ 2.08 +0.58/ 3.2, Im Pm –0.56E–03 –0.67 2.5 P45 IV137H3 5666 1.75E–03/ +0.24E–03/ 2.09/ +0.28/ 2.5, Im, Em Pm 1.03E–02 –0.11E–03 3.70 –0.14 3.2 +0.54 E–02/ +0.08/ –0.20E–02 –0.05 P44 IV156H3 3245 1.77E–03 +0.39E–03/ 2.11 +0.47/ 3.2 Im Ipm, Ipmd Im EIm –0.39E–03 –0.47 P43 IV138H2 1426 1.78E–03 +0.72E–03/ 2.12 +0.82/ 2.5, Im, Em Ipm –0.77E–03 –0.91 3.2, 3.5 P42 IV156H2 698 1.78E–03 +0.49E–03/ 2.12 +0.58/ no Em Em –0.53E–03 –0.63 age P41 IV138H1 1786 1.79E–03 +0.64E–03/ 2.13 +0.75/ 2.5 Im Pm –0.72E–03 –0.85 P40 IV158H1 3266 1.79E–03/ +0.48E–03/ 2.14/ +0.56/ 3.2, Im Ipm Im 3.80E–03 –0.50E–03 3.40 –0.60 2.5, +0.56E–03/ +0.07/ 3.5 –0.66E–03 –0.12 (Continued)
- 14. TABLE 3. COMPARISON OF AGES FOR BASALTS IN OCEANUS PROCELLARUM* (Continued) Unit Lunar Area Crater Error Model Error Boyce Wilhelms Moore Moore Marshall Hackman McCauley McCauley Wilshire Titley Scott Ulrich Scott Lucchitta Orbiter (km2) retention age (b.y.) (1976) and (1965) (1967) (1963) (1962) (1967) (1973) (1973) (1967) and (1969) et al. (1978) image age N(1) (Ga) McCauley Eggleton (1977) (1971) (1973) P39 IV163H2 2298 1.83E–03 +0.46E–03/ 2.19 +0.53/ 2.5, Em, Im Ipm Im, Em EIm –0.52E–03 –0.62 3.2, 3.5 P38 IV143H2 1127 1.93E–03 +0.47E–03/ 2.31 +0.53/ 3.2 Im, Em Pm –0.49E–03 –0.60 P37 IV183H1 1091 1.99E–03/ +0.30E–03/ 2.38/ +0.34/ no age EIm 5.82E–03 –0.25E–03 3.56 –0.31 +0.86E–03/ +0.04/ –0.75E–03 –0.04 P36 IV156H3 1082 2.02E–03/ +0.38E–03/ 2.41/ +0.43/ 3.2 Im Im EIm 2.54E–02 –0.39E–03 3.86 –0.46 +1.94E–02/ +0.09/ –0.47E–02 –0.04 P35 IV143H3 3441 2.13E–03 +0.26E–03/ 2.54 +0.29/ 3.2, Im, Em Pm Pm –0.14E–03 –0.17 2.5 P34 IV156H3 1118 2.17E–03 +0.69E–03/ 2.59 +0.59/ 3.2, Em Em EIm –0.71E–03 –0.85 2.5 P33 IV156H3 1855 2.18E–03/ +0.15E–03/ 2.59/ +0.18/ 2.5, Im Im EIm 7.51E–03 –0.15E–03 3.63 –0.17 3.2 +1.73E–03/ +0.04/ –1.40E–03 –0.06 P32 IV157H3 6475 2.32E–03 +0.33E–03/ 2.76 +0.30/ 2.5 Im Ipm, EIm IV162H3 –0.15E–03 –0.18 Ipmd P31 IV158H1 1719 2.44E–03/ +0.69E–03/ 2.88/ +0.39/ 3.2 Im Im 1.17E–02 –0.16E–03 3.72 –0.17 +0.58E–02/ +0.08/ –0.22E–02 –0.04 P30 IV169H3 583 2.46E–03 +0.36E–03/ 2.9 +0.26/ 2.5 Im Ipm EIm Downloaded from specialpapers.gsapubs.org on August 28, 2011 –0.32E–03 –0.35 P29 IV183H2 1546 2.49E–03 +0.37E–03/ 2.93 +0.25/ 3.2 EIm –0.32E–03 –0.34 P28 IV183H3 840 2.51E–03/ +0.66E–03/ 2.94/ +0.34/ 3.65, Im 1.14E–02 –0.33E–03 3.72 –0.34 3.5 +0.66E–02/ +0.08/ –0.21E–02 –0.05 P27 IV132H3 2135 2.52E–03 +0.88E–03/ 2.96 +0.38/ 3.2, Im, Em Pm Ages and stratigraphy of lunar mare basalts –0.17E–03 –0.17 2.5, 3.5 P26 IV158H1 2309 2.53E–03/ +0.61E–03/ 2.96/ +0.32/ 2.5, Im Ipm, EIm 4.62E–03 –0.33E–03 3.49 –0.34 3.2 Ipmd +1.06E–03/ +0.06/ –0.69E–03 –0.07 P25 IV156H3 2176 2.52E–03/ +0.77E–03/ 2.96/ +0.35/ 3.5, Im, Em Im, Em EIm 7.46E–03 –0.16E–03 3.62 –0.17 3.2 +1.11E–03/ +0.04/ –1.39E–03 –0.05 P24 IV150H1 6330 2.58E–03/ +0.58E–03/ 3.00/ +0.28/ 3.2, Im, Em Ipm, Ipmd Im 1.27E–02 –0.17E–03 3.74 –0.15 2.5; +0.84E–02/ +0.09/ 3.5 –0.18E–02 –0.04 P23 IV157H1 513 2.67E–03 +0.19E–03/ 3.07 +0.11/ 2.5 Em Em, Im EIm –0.18E–03 –0.14 P22 IV169H3 925 2.68E–03 +0.40E–03/ 3.08 +0.18/ 2.5 Ipmd, EIm –0.18E–03 –0.14 Ipm P21 IV183H2 2725 2.75E–03 +0.40E–03/ 3.12 +0.16/ 3.5 EIm –0.19E–03 –0.13 (Continued) 13
- 15. TABLE 3. COMPARISON OF AGES FOR BASALTS IN OCEANUS PROCELLARUM* (Continued) 14 Unit Lunar Area Crater Error Model Error Boyce Wilhelms Moore Moore Marshall Hackman McCauley McCauley Wilshire Titley Scott Ulrich Scott Lucchitta Orbiter (km2) retention age (b.y.) (1976) and (1965) (1967) (1963) (1962) (1967) (1973) (1973) (1967) and (1969) et al. (1978) image age N(1) (Ga) McCauley Eggleton (1977) (1971) (1973) P20 IV157H1 1702 2.74E–03/ +0.50E–03/ 3.12/ +0.18/ 3.2 Em, Im Ipm, Ipmd EIm 3.94E–02 –0.50E–03 3.93 –0.45 +2.61E–02/ +0.08/ –0.74E–02 –0.03 P19 IV162H2 8051 3.27E–03 +0.23E–03/ 3.31 +0.05/ 3.2, Em, Im Ipmd, EIm IV169H2 –0.22E–03 –0.06 3.5, Ipm, Cca 2.5 P18 IV162H1 1874 3.31E–03 +0.49E–03/ 3.32 +0.08/ 2.5 Em Ipmd, Cca Em, Im EIm –0.23E–03 –0.06 P17 IV132H2 2909 3.30E–03 +0.79E–03/ 3.32 +0.08/ 3.5, Em Pm Ipm3, –0.42E–03 –0.14 3.2 Ipm4 P16 IV157H1 1108 3.36E–03 +0.60E–03/ 3.33 +0.08/ 3.2, Im Ipm, Cre EIm –0.13E–03 –0.05 3.5, 2.5 P15 IV156H3 1662 3.43E–03/ +0.51E–03/ 3.34/ +0.08/ 3.2, Em, Im Ipm, Ipmd Im EIm 2.75E–02 –0.44E–03 3.87 –0.11 3.5 +0.41E–02/ +0.02/ –0.51E–02 –0.03 P14 IV162H3 7939 3.50E–03/ +0.37E–03/ 3.36/ +0.05/ 2.5, Em, Im Ipmd, EIm IV169H2 7.35E–03 –0.39E–03 3.62 –0.09 3.2, Ipm IV169H3 +2.85E–03/ +0.07/ 3.5 –1.38E–03 –0.05 P13 IV163H2 1120 3.76E–03 +1.19E–03/ 3.4 +0.11/ 3.65, Im Im Im –0.70E–03 –0.15 3.5, 3.2, 3.75 P12 IV157H1 1807 3.97E–03 +1.09E–03/ 3.42 +0.10/ 2.5, Em Ipmd, EIm –0.51E–03 –0.07 3.2 Ipm, Cca P11 IV143H2 2383 4.00E–03 +1.12E–03/ 3.43 +0.09/ 3.2, Im, Em Pm –0.52E–03 –0.08 3.5 Downloaded from specialpapers.gsapubs.org on August 28, 2011 Hiesinger et al. P10 IV175H3 8419 4.08E–03 +0.83E–03/ 3.44 +0.07/ 3.5, Im Im EIm Im –0.52E–03 –0.07 3.2, 3.65, 2.5 P9 IV170H2 3808 4.45E–03 +0.71E–03/ 3.47 +0.08/ 3.2, Em, Im Em, Im EIm –0.56E–03 –0.06 3.5 P8 IV132H3 2525 4.44E–03 +1.32E–03/ 3.47 +0.08/ 2.5, Em Pm –0.83E–03 –0.09 3.5, 3.2 P7 IV144H3 1774 4.48E–03 +1.20E–03/ 3.48 +0.07/ 3.5, Im Ipm –1.08E–03 –0.14 3.2 P6 IV144H1 884 4.52E–03 +1.68E–03/ 3.48 +0.10/ 3.2, Im Pm Em –1.09E–03 –0.14 2.5 P5 IV138H2 1792 4.57E–03 +1.30E–03/ 3.48 +0.08/ 3.5, Im Ipm Pm –0.67E–03 –0.06 3.2, 2.5 P4 IV151H1 1327 4.49E–03/ +1.19E–03/ 3.48/ +0.07/ 3.65, Im Ipm 1.29E–02 –0.84E–03 3.74 –0.10 3.5, +0.67E–02/ +0.07/ 3.2 –0.39E–02 –0.07 P3 IV149H3 718 5.26E–03 +1.97E–03/ 3.53 +0.09/ 3.2, Im Im EIm –0.98E–03 –0.07 3.5, 2.5 P2 IV144H1 862 6.10E–03 +2.10E–03/ 3.57 +0.08/ 3.2, Im Pm –1.47E–03 –0.08 3.5, 2.5 P1 IV183H3 2269 6.47E–03 +1.53E–03/ 3.59 +0.05/ 3.5 Im –1.62E–03 –0.09 *See text for details. Read 2.68E–03 as 2.68 × 10⁻³.
- 16. Downloaded from specialpapers.gsapubs.org on August 28, 2011 Ages and stratigraphy of lunar mare basalts 15 or Eratosthenian/Imbrian ages are shown in the map of Wilhelms were mapped partially as Eratosthenian and Imbrian (P56, P58) and McCauley (1971). However, our data indicate that these units or as Imbrian (P59, P60) by Wilhelms and McCauley (1971). are Imbrian in age, consistent with the mapping of McCauley Imbrian ages for units P59 and P60 are also shown in the maps (1967, 1973), Moore (1967), Titley (1967), Scott and Eggleton of Moore (1965, 1967) and for units P58 and P59 in the map of (1973), and Lucchitta (1978). Our crater counts do not confirm Scott and Eggleton (1973). This map also shows an Eratosthe- an Eratosthenian age for parts of unit P9, as shown in the map of nian age for unit P58. Ulrich (1969) and Lucchitta (1978) found Scott and Eggleton (1973). Our data do not agree with the map of Eratosthenian ages for unit P56, and Scott et al. (1977) mapped McCauley (1967) that units P12, P16, P18, and P19 are partially units P58 and P60 as Eratosthenian and/or Imbrian in age. A of Copernican age, nor with the map of McCauley (1973), which summary of this discussion of our units in the context of the geo- shows that unit P18 is partially of Eratosthenian age. logical maps of the U.S. Geological Survey and the Boyce ages Several units for which we determined an Eratosthenian age is given in Table 3. (P23, P34, P42, P54) are also mapped as Eratosthenian in age in the map of Wilhelms and McCauley (1971). Numerous units Mare Imbrium exhibit Eratosthenian and Imbrian ages in this map, and using our crater size-frequency distribution measurements, we obtained In the Imbrium basin (1160 km in diameter; Spudis, Eratosthenian ages for all these units (P20, P24, P25, P27, P35, 1993), we dated 30 spectrally defined units showing basalt ages P38, P39, P43, P45, P49, P50, P51, P52, P53). Wilhelms and between 2.01 and 3.57 Ga (Hiesinger et al., 2000). In our data, McCauley (1971) mapped 12 units as Imbrian in age, but our we observed a trend showing western basalts in Mare Imbrium data indicate an Eratosthenian age for these units (P26, P30, P31, slightly younger than eastern basalts. As in Mare Serenitatis, we P32, P33, P36, P40, P41, P44, P46, P47, P48). The geologic map observed a broad range of ages varying at least 1.5 Ga, which of Scott et al. (1977) attributes Eratosthenian and/or Imbrian ages indicates an extremely long period of volcanic activity in these to units that we found to be of Eratosthenian age (P20, P21, P22, two basins (Fig. 6). On the basis of their crater size-frequency P23, P25, P26, P29, P30, P32, P33, P34, P36, P37, P39, P44, P49, counts (for diameters >500 m), Bugiolacchi and Guest (2008) P51, P53). Several other geologic maps show Imbrian ages for reported that for most of their mare basalts, crater count ages the units that, according to our crater counts, are Eratosthenian range between 3.5 and 5.5 × 10⁻² per km2, or 2.3–3.3 Ga. in age, i.e., units P20–P55. For example, Moore (1965) found In our data, ~52% of all units in Mare Imbrium exhibit Imbrian ages for units P40, P43, P48, and P51, and in the map ages of 3.3–3.6 Ga, with all other units younger than 3.3 Ga but of Moore (1967), six units (P22, P26, P30, P32, P39, P49) show older than 2.6 Ga, except unit I29, which is 2.26 Ga, and unit Imbrian ages, and one unit (P53) is partially Imbrian and Coper- I30, which is 2.01 Ga. We conclude that the largest number of nican in age. Imbrian ages are also indicated for units P20, P24, basalts erupted in the period 3.3–3.6 b.y. ago and that volcanism and P44 in the map of McCauley (1967), and for unit P28 (Luc- went on with a significantly lower intensity until ca. 2.6 Ga. We chitta, 1978), as well as for units P31, P39, P40, and P53 (Scott observed a weak bimodal distribution of basalt ages with peaks and Eggleton, 1973). However, significant parts of units P39 and at 3.3–3.4 Ga and 3.5–3.6 Ga, thus indicating that volcanism was P53 were also mapped as Eratosthenian in age, consistent with not continuously active with equal intensity over longer periods our dating. Finally, in the map of McCauley (1973), units P24, of time but shows phases with higher and lower levels of activity. P33, P36, and P44 are Imbrian and units P23 and P25 are Imbrian During each of those periods with intensified volcanic activity, and Eratosthenian in age. Our crater counts confirm an Eratosthe- 20% of the dated basalt units were emplaced. nian age for unit P34 and unit P54. The map of Wilshire (1973) Young lava flows, originating near Euler β and flowing indicates an Eratosthenian age for unit P42, consistent with our northward across the Imbrium basin for 1200 km, were studied age for this unit. by Schaber (1973). These youngest lava flows in central Imbrium As mentioned earlier, for the application of terms like consist of three distinctive phases and were previously mapped “Copernican” or “Eratosthenian” in an absolute sense, the reader as Eratosthenian in age by Schaber (1973). However, our data must be aware that there is no formal definition of the Coper- show that at least one of those basalts (unit I7) is of Imbrian age, nican system (Wilhelms, 1987) and that the chronostratigraphic consistent with observations of Wilhelms (1987). systems of different authors vary in the beginning of the Coper- Table 4 shows that for a single spectrally defined unit, a nican system (e.g., Wilhelms, 1987; Neukum and Ivanov, 1994; broad variety of crater degradation ages (Boyce, 1976; Boyce Stöffler and Ryder, 2001; Hawke et al., 2004). These differences and Johnson, 1978) can be extracted. Only three units (I23, I24, are reviewed elsewhere (e.g., Hiesinger et al., 2000; Stöffler I27) exhibit only one age in the Boyce data, whereas all other and Ryder, 2001). For our studies, we adopted the chronostrati- units are characterized by two or more ages. In four units (I5, graphic system of Neukum and Ivanov (1994). According to this I6, I8, I17), our data match the most abundant Boyce ages. In chronostratigraphic system, our crater counts revealed Coperni- 12 other units (I3, I7, I9, I10, I11, I12, I13, I15, I19, I20, I26, can ages for five units (P56, P57, P58, P59, P60). Application of I28), the crater degradation ages of Boyce and Johnson (1978) the Wilhelms (1987) and the Stöffler and Ryder (2001) models mark an upper and lower boundary, with our data in between. would indicate Eratosthenian ages for these units. These units Unit I28, mapped by Schaber (1969), and units I19, I20, I29, and
- 17. 16 Downloaded from specialpapers.gsapubs.org on August 28, 2011 Hiesinger et al. Figure 6. Spatial distribution of model ages for spectrally defined units in Mare Imbrium (Hiesinger et al., 2000). (A) Telescopic view (detail of Mount Wilson Observatory photo- graph 257). Spectral units are outlined in white. (B) Sketch map of Mare Imbrium showing unit numbers and model ages in billion years (also see Table 4). Crater size-frequency distribution measurements were performed for the areas highlighted in dark gray.
- 18. TABLE 4. COMPARISON OF AGES FOR BASALTS IN MARE IMBRIUM* Unit Lunar Orbiter Area Crater Error Model Error Boyce M’Gonigle and Schaber Carr Moore Hackman Page image (km2) retention age age (b.y.) (1976) Schleicher (1969) (1965) (1965) (1966) (1970) N(1) (Ga) (1972) I30 IV-134H1 3108 1.68E–03 +0.12E–03/ 2.01 +0.14/ 2.5/3.2 Ipm –0.11E–03 –0.14 I29 IV-134H1 5093 1.89E–03 +0.14E–03/ 2.26 +0.16/ 2.5/3.2 Ipm –0.12E–03 –0.15 I28 IV-127H2 11,035 2.20E–03 +0.15E–03/ 2.62 +0.17/ 3.2/2.5/3.5 Im2 IV-134H1 –0.15E–03 –0.17 Im3 IV-145H1 I27 IV-134H3 1127 2.22E–03 +0.16E–03/ 2.64 +0.18/ 3.5 EIm –0.15E–03 –0.17 I26 IV-122H1 7837 2.27E–03 +0.16E–03/ 2.70 +0.17/ 3.2/2.5 EIm –0.15E–03 –0.17 I25 IV-127H3 3132 2.37E–03 +0.17E–03/ 2.81 +0.16/ n.d. EIm –0.16E–03 –0.17 I24 IV-127H3 2978 2.39E–03 +0.16E–03/ 2.83 +0.15/ 3.2 EIm –0.17E–03 –0.18 I23 IV-134H3 3470 2.48E–03 +0.18E–03/ 2.92 +0.15/ 3.5 Im, EIm –0.16E–03 –0.16 I22 IV-127H2 8117 2.52E–03 +0.18E–03/ 2.96 +0.13/ 3.2/3.5/2.5 EIm IV-134H2 –0.17E–03 –0.17 I21 IV-145H2 2323 2.58E–03 +0.19E–03/ 3.01 +0.12/ 3.2/3.5 Im1, Im2 –0.17E–03 –0.16 I20 IV-126H3 13,948 2.58E–03 +0.19E–03/ 3.01 +0.12/ 3.2/2.5/3.5 EIm Ipm IV-127H1 –0.17E–03 –0.16 IV-127H2 Downloaded from specialpapers.gsapubs.org on August 28, 2011 IV-133H3 IV-134H1 I19 IV-133H3 2723 2.71E–03 +0.19E–03/ 3.10 +0.09/ 3.2/2.5 Ipm –0.18E–03 –0.14 I18 IV-122H2 5604 2.74E–03 +0.19E–03/ 3.11 +0.10/ 3.2/3.5/3.65 Im –0.19E–03 –0.13 I17 IV-139H2 1463 3.09E–03 +0.22E–03/ 3.26 +0.08/ 3.2/3.5/3.65 Im1 Ages and stratigraphy of lunar mare basalts –0.21E–03 –0.07 I16 IV-139H1 3108 3.24E–03 +0.23E–03/ 3.30 +0.05/ 3.2/2.5 Im2, Im3 Ipm –0.22E–03 –0.06 I15 IV-121H3 4422 3.28E–03 +0.24E–03/ 3.31 +0.05/ 3.5/3.2/2.5 Ipm IV-127H1 –0.22E–03 –0.06 I14 IV-122H3 1855 3.36E–03 +0.24E–03/ 3.33 +0.04/ 3.5/3.65/3.2 Im, –0.22E–03 –0.05 EIm I13 IV-114H3 1962 3.38E–03 +0.24E–03/ 3.33 +0.05/ 3.2/3.5 Ipm –0.22E–03 –0.05 I12 IV-139H1 2618 3.47E–03 +0.51E–03/ 3.35 +0.08/ 3.5/3.2 Im2 –0.23E–03 –0.05 I11 IV-139H2 1820 3.74E–03 +0.56E–03/ 3.39 +0.07/ 3.5/3.2 Im1, Im2 –0.48E–03 –0.08 I10 IV-122H1 4792 3.77E–03 +0.56E–03/ 3.40 +0.06/ 3.2/3.5/2.5 Im1 Im IV-127H2 –0.25E–03 –0.04 (Continued) 17