Weitere ähnliche Inhalte Kürzlich hochgeladen (20) 1. DJIAExpendituresSpending CalPERS
Retirement Benefit –
Growth in Fees
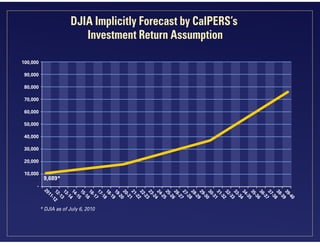
DJIA Implicitly Forecast byand Benefits
GF CalPERS Cost(Before Offsets)
Implicitlyin GFProjections
State Costs for CalPERS
Growth Forecast byCalPERS’s
Growth in in StudentSpending Cost
Increase Compensation Costs
Retirement Benefit
UC From 2000-012039-40 2010-11
Spending Return to2010-11
from 2000-01toRevenues
Investment as2000-012010-11
and CSU, toinof Assumption
ProjectionFunds and
2011-12 %vs. Actual
All
Dollars Millions
Dollars inin Millions
Dollars Billions
Millions
35,000
7,000
$11,000
$4,000 28,000,000
25%
$14 24%
100,000
28,000,000
Parks and
Environmental 3,769 Health
4% 3,769
Recreation -86%
Protection -87%
10,000
26,000,000
3,500
90,000
Agency
30,000
6,000
12
CSU
24,000,000
9,000 -14%
20%
80,000
Parks and -40%
22,000,000
3,000
Recreation
8,000
25,000
10UC
5,000 -11%
20,000,000
70,000 17%
2,500
18,000,000
7,000 24,317
UC HHS
& CSU
60,000 2% 58%
15%
20,000
8
16,000,000
4,000
6,000
2,000
Total
50,000
14,000,000 Human
Retirement 337% * 12% Services
5,000
6 HHS
12,000,000 11% 35%
50%
15,000
Benefits
3,000
1,500
40,000 16,322 11%
CDCR
10,000,000
10%
4,000 33%
STRS
30,000
4 8%
Retiree
8,000,000
1,000
10,000
2,000
3,000 232% 7% UC/CSU
Health
Retiree 7%
6,000,000 241% 648
20,000
Health 648
2,000
2500
4,000,000 5% PERS/STRS/
5%
5,000 220 220 379 379
1,000
10,000 220
PERS 145 Retirement
2883%
2499%
PERS 145
2,000,000 9,689* 103 Health Benefits
1,000 10,259
145
103 17,432 35,974 85,816
$0 2%
$0 - - 2000-01 2001-02 % 2002-03% 2003-04 2004-05 2005-06 2006-07 1500% % 2008-09% 2009-10 2010-11
2007-08
-500% 0% 750% 1000% 1250% 1500% 1750% 2000 2010-112000%Estimate % 2500%
500% 1000%
$00 -250%
0 0.3% 0% 250 2000-01
500 2250 2500% 2750 3000%
20
20 01-1
201
20 13 2
20 -14
20 -1
20 8
20 -19
20 - 1
20 -22
20 -2
20 -26
20 - 7
20 - 9
20 -31
20 -3
20 -34
20 -35
20 -
20 -39
20 -
0.1%
1211 -12
12 1
1311
13 1315
14-14
14
15115
15
16 6
16216
17-1725
17
1821
18-1930
19-
1932
20-203
2132
20
22-2240
21-21
23423
22
25-2 - 0
23-24 5
2652
244255
27-2
28-286
25 5
2962
26-2755
30-3 5
3163 -
2752
32
28
33-3 -75
29-306
3473
35-3
30 0
36-368
31-32 0
3783
32733
38-3890
3993 -
33 3
34-3580
3584
36-37 5
37-37
38 8
39-4095
4- 4
Estimate
940
2000-01 2001-02 2002-03 2003-04 2004-05 2005-06 2006-07 2007-08 2010-11
2000-01 Parks
-- 0
-
- 4-
- 9-
-1520
-4
-17
-9
-20 5
- 4-4
-28 0
-4
- 42
-9
-9
-4
0% 2000-01
2000-01 2010-11 2009-10 2010-11
2010-11
2008-09
9
4-
9-
9
9-
49
9-
9-
8
3
6
17
4
6
9
-
-
-
-
-
-
21
2000-01 2001-02 2002-03 2003-04 2004-05 2005-06 2006-07 As of May Revision2009-10
2007-08 2008-09
Estimate Estimate
00
* DJIA as of July 6, 2010 to 2007-08 is discounted at 6%
Active Healthcare prior Actual Cost
per annum back to 00-01 Salary PERS CalPERS 1999 Projection
Retiree Health
UC PERS fees
Student Retiree Health Student fees
CSU STRS
** Direct expenditures only SB 400
Active Health STRS
2. DJIAExpendituresSpending CalPERS
Growth in in StudentSpending Benefits
Implicitlyin GFProjections
Growth Forecast byOffsets)
Retirement Benefit –
Growth in Fees
GF CalPERS Cost(Before Costs
State Costs for CalPERS
Increase Compensation and Cost
Retirement Benefit
UC From 2000-012042-43 2010-11
Projection vs.to2010-11
from 2000-01toAssumption
Investment as2000-012010-11
Spending Return2010-11
2011-12 toto Revenues
CSU, % of Actual
and 2000-01Funds and
All
Dollars inin Millions
Dollars Billions
Millions
35,000
7,000
$11,000
$4,000 28,000,000
25%
$14 24%
Environmental
100,000
28,000,000
Parks and 4% 3,769 Health
3,769
Recreation -86%
Protection
10,000
26,000,000
Agency
3,500
90,000
30,000
6,000
12
CSU
24,000,000
9,000 -14%
Parks and -40%
20%
80,000
22,000,000
3,000
Recreation *
8,000
25,000
UC
5,000
10
20,000,000 -11%
70,000 17%
2,500 * ∴
24,317
18,000,000
7,000 *
UC60,000
& CSU 2%
58% ∴
HHS
15%
20,000
8
16,000,000 *
4,000 *
6,000
2,000 *
Total
50,000
14,000,000 Human
Retirement * 337% 12%
HHS 11%
5,000 35% Services
6
12,000,000
15,000
Benefits
16,322
3,000
1,500
40,000 11%
CDCR
10,000,000
10%
4,000 33%
STRS
Retiree 8%
30,000
4
8,000,000
1,000
10,000
2,000 232%
Health
3,000
Retiree 7% 7% UC/CSU
6,000,000
20,000 241% 648
Health 648
2,000
2500
4,000,000 5% PERS/STRS/
5%
5,000 220 220 379 379
PERS
1,000
10,000 2883%
Retirement
2,000,000 220
PERS 145 103 145 2499%
Health Benefits
1,000 10,259
145
103 17,432 35,974 85,816
$0 2%
$0 - -
0-2502000-01 % 2001-02 % 2002-03
-500% % 0 0% 500%
250 2000-01 750% 1000% 2250% 2009-10 2010-11
2003-04 1000% 1250% 15002006-07 % 2007-08 % 2008-09 2000%% 2750% 2500%
500% 2004-05 2005-06 % 17501500% 2000 2010-11 2500 3000%
$00
20
210 01-1
0.3% Estimate
201
20 -1 2
20 -
20 7
20 -18
20 -2
20 -
20 -24
20 -2
20 -2
20 -
20 1
20 -3
20 -3
20 -
20 8
20 -40
20 -41
20 43 5
0.1%
39-
4089
42- 429
37- 780
388
39
41-
40 4190
4194
42 2
35- 457
36
36 36
37
38 3985
32-
33693
34-
34734
35 36 5
29
30- 060
316
31 3265
32
33 3470
26496
27-
28- 485
28 29 5
29 39
30
23- - 0
244
25-
26 2750
27527
24 2545
25
18-
19299
20-
21- 413
21 22
22 234
23 3
15
16- 620
172
18
19 2030
20320
16
17 1825
13-
12
14- 441
13113
14 15
15 15
232
21-1 -12
Estimate
11
52
73
94
2000-01 2001-02 2002-03 2003-04 2004-05 2005-06 2006-07 2007-08 2010-11
2000-01 Parks
-40
-4
-37
-38
- -
-9
-35
-9
-4
-33
-31
- -
-28
-9
-30
-4
-26
-24
- -
-21 5
- 92
-4
-19
-16
-17
- -
-14 5
-9
-4
0% 2000-01 2010-11 2009-10 2010-11
2008-09
39
3
32
3
25
2
1
1-31 0
1
9
32
-
-
-
-
-
-
-
-
-
-
-
-
-
10
2000-01 2001-02 2002-03 2003-04 2004-05 2005-06 2006-07 As of May Revision2009-10
2007-08 2008-09 Estimate
0
* Active Healthcare prior to 2007-08 is discounted at 6% per Actual Cost
annum back to 00-01 Salary PERS CalPERS 1999 Projection
Retiree Health
UC PERS fees
Student Retiree Health Student fees
CSU STRS
∴Salaries are affected by the furlough program that was SB 400
Active Health STRS
implemented from February 2009 to June 2010
3. DJIAExpendituresSpending CalPERS
Retirement Benefit –
Growth in Fees
GF CalPERS Cost(Before Costs
Implicitlyin GFProjections
State Costs for CalPERS
Growth Forecast byOffsets)
Growth in in StudentSpending Benefits
Increase Compensation and Cost
Retirement Benefit
UC From 2000-012039-40 2010-11
Spending Return to2010-11
from 2000-01toActual
Investment as2000-012010-11
and CSU, tovs. Assumption
Projectionand Revenues
2011-12 % of 2010-11
2000-01 Funds and
All
Dollars inin Millions
Dollars Billions
Millions
35,000
7,000
$11,000
$4,000 28,000,000
25%
$14 24%
100,000
28,000,000
Parks and
Environmental 3,769 Health
4% 3,769
Recreation -86%
Protection -87%
10,000
26,000,000
3,500
90,000
Agency
30,000
6,000
12
CSU
24,000,000
9,000 -14%
20%
80,000
Parks and -40%
22,000,000
3,000
Recreation
8,000
25,000
10UC
5,000 -11%
20,000,000
70,000 17%
2,500
18,000,000
7,000 24,317
UC HHS
& CSU
60,000 2% 58%
15%
20,000
8
16,000,000
4,000
6,000
2,000
Total
50,000
14,000,000 Human
Retirement 337% * 12% Services
5,000
6 HHS
12,000,000 11% 35%
50%
15,000
Benefits
3,000
1,500
40,000 16,322 11%
CDCR
10,000,000
10%
4,000 33%
STRS
30,000
4 8%
Retiree
8,000,000
1,000
10,000
2,000
3,000 232% 7% UC/CSU
Health
Retiree 7%
6,000,000 241% 648
20,000
Health 648
4,000,000 9,689*
2,000
2500
5%
5% PERS/STRS/
5,000 220 220 379 379
1,000
10,000
PERS Retirement
2883%
2,000,000 220
PERS 145 103 145 2499%
Health Benefits
1,000 10,259
145
103 17,432 35,974 85,816
$0 2%
$0 - - 2000-01 2001-02 % 2002-03% 2003-04 2004-05 2005-06 2006-07 1500% % 2008-09% 2009-10 2010-11
2007-08
-500% 0% 750% 1000% 1250% 1500% 1750% 2000 2010-112000%Estimate % 2500%
500% 1000%
$00 -250%
0 0.3% 0% 250 2000-01
500 2250 2500% 2750 3000%
20
20 01-1
201
20 13 2
20 -14
20 -1
20 8
20 -19
20 - 1
20 -22
20 -2
20 -26
20 - 7
20 - 9
20 -31
20 -3
20 -34
20 -35
20 -
20 -39
20 -
0.1%
1211 -12
12 1
1311
13 1315
14-14
14
15115
15
16 6
16216
17-1725
17
1821
18-1930
19-
1932
20-203
2132
20
22-2240
21-21
23423
22
25-2 - 0
23-24 5
2652
244255
27-2
28-286
25 5
2962
26-2755
30-3 5
3163 -
2752
32
28
33-3 -75
29-306
3473
35-3
30 0
36-368
31-32 0
3783
32733
38-3890
3993 -
33 3
34-3580
3584
36-37 5
37-37
38 8
39-4095
4- 4
Estimate
940
2000-01 2001-02 2002-03 2003-04 2004-05 2005-06 2006-07 2007-08 2010-11
2000-01 Parks
-- 0
-
- 4-
- 9-
-1520
-4
-17
-9
-20 5
- 4-4
-28 0
-4
- 42
-9
-9
-4
0% 2000-01
2000-01 2010-11 2009-10 2010-11
2010-11
2008-09
9
4-
9-
9
9-
49
9-
9-
8
3
6
17
4
6
9
-
-
-
-
-
-
21
2000-01 2001-02 2002-03 2003-04 2004-05 2005-06 2006-07 As of May Revision2009-10
2007-08 2008-09
Estimate Estimate
00
* DJIA as of July 6, 2010 to 2007-08 is discounted at 6%
Active Healthcare prior Actual Cost
per annum back to 00-01 Salary PERS CalPERS 1999 Projection
Retiree Health
UC PERS fees
Student Retiree Health Student fees
CSU STRS
** Direct expenditures only SB 400
Active Health STRS
4. DJIAExpendituresSpending CalPERS
Retirement Benefit –
Growth in Fees
GF CalPERS Cost(Before Costs
Implicitlyin GFProjections
State Costs for CalPERS
Growth Forecast byOffsets)
Growth in in StudentSpending Benefits
Increase Compensation and Cost
Retirement Benefit
UC From 2000-012042-43 2010-11
Projection vs.to2010-11
from 2000-01toAssumption
Investment as2000-012010-11
Spending Return2010-11
2011-12 toto Revenues
CSU, % of Actual
and 2000-01Funds and
All
Dollars inin Millions
Dollars Billions
Millions
35,000
7,000
$11,000
$4,000 28,000,000
25%
$14 24%
100,000
28,000,000
Parks and
Environmental 3,769 Health
4% 3,769
Recreation -86%
Protection -87%
10,000
26,000,000
3,500
90,000
Agency
30,000
6,000
12
CSU
24,000,000
9,000 -14%
20%
80,000
Parks and -40%
22,000,000
3,000 *
Recreation
8,000
25,000
10UC
5,000 -11%
20,000,000
70,000 17%
2,500 * ∴
24,317
18,000,000
7,000 *
UC HHS
& CSU
60,000 2% 58% ∴
15%
20,000
8
16,000,000
4,000 *
6,000 *
2,000 *
Total
50,000
14,000,000 Human
Retirement * 337% 12%
5,000 Services
6 HHS
12,000,000 11%
15,000
Benefits 35%
50%
16,322
3,000
1,500
40,000 11%
CDCR
10,000,000
10%
4,000 33%
STRS
30,000
4 8%
Retiree
8,000,000
1,000
10,000
2,000
3,000 232% 7% UC/CSU
Health
Retiree 7%
6,000,000 241% 648
20,000
Health 648
2,000
2500
4,000,000 5% PERS/STRS/
5%
5,000 220 220 379 379
1,000
10,000
PERS Retirement
2883%
2,000,000 220
PERS 145 103 145 2499%
Health Benefits
1,000 10,259
145
103 17,432 35,974 85,816
$0 2%
$0 - -2000-01 2001-02 % 2002-03% 2003-04 2004-05 2005-06 2006-07 1500% % 2008-09% 2009-10 2010-11
2007-08
-500% % 0% 750% 1000% 1250% 1500% 1750% 2000 2010-112000%Estimate % 2500%
500% 1000%
$00 -250
0 0.3% 0%
250 2000-01
500 2250 2500% 2750 3000%
20
210 01-1
201
20 -1 2
20 -
20 7
20 -18
20 -2
20 -
20 -24
20 -2
20 -2
20 -
20 1
20 -3
20 -3
20 -
20 8
20 -40
20 -41
20 43 5
0.1%
39-
4089
42- 429
36
37- 780
388
41-
40 4190
38 3985
39
4194
42 2
34-
35- 457
36 36
37
32-
33693
34734
35 36 5
29
30- 060
316
31 3265
32
33 3470
26496
27-
28- 485
28 29 5
29 39
30
23- - 0
244
25-
26 2750
27527
24 2545
25
18-
19299
20-
21- 413
21 22
22 234
23 3
15
16- 620
172
18
19 2030
20320
16
17 1825
13-
12
14- 441
13113
14 15
15 15
232
21-1 -12
Estimate
11
52
73
94
2000-01 2001-02 2002-03 2003-04 2004-05 2005-06 2006-07 2007-08 2010-11
2000-01 Parks
-40
-4
-37
-38
- -
-9
-35
-9
-4
-33
-31
- -
-28
-9
-30
-4
-26
-24
- -
-21 5
- 92
-4
-19
-16
-17
- -
-14 5
-9
-4
0% 2000-01 2010-11 2009-10 2010-11
2008-09
39
3
32
3
25
2
1
1-31 0
1
9
32
-
-
-
-
-
-
-
-
-
-
-
-
-
10
2000-01 2001-02 2002-03 2003-04 2004-05 2005-06 2006-07 As of May Revision2009-10
2007-08 2008-09 Estimate
0
* Active Healthcare prior to 2007-08 is discounted at 6% per Actual Cost
annum back to 00-01 Salary PERS CalPERS 1999 Projection
Retiree Health
UC PERS fees
Student Retiree Health Student fees
CSU STRS
∴Salaries are affected by the furlough program that was SB 400
Active Health STRS
implemented from February 2009 to June 2010
5. DJIAExpendituresSpending CalPERS
Retirement Benefit –
Growth in Fees
GF CalPERS Cost(Before Costs
Implicitlyin GFProjections
State Costs for CalPERS
Growth Forecast byOffsets)
Growth in in StudentSpending Benefits
Increase Compensation and Cost
Retirement Benefit
UC From 2000-012039-40 2010-11
Spending Return to2010-11
from 2000-01toActual
Investment as2000-012010-11
and CSU, tovs. Assumption
Projectionand Revenues
2011-12 % of 2010-11
2000-01 Funds and
All
Dollars inin Millions
Dollars Billions
Millions
35,000
7,000
$11,000
$4,000 28,000,000
25%
$14 24%
100,000
28,000,000
Parks and
Environmental 3,769 Health
4% 3,769
Recreation -86%
Protection -87%
10,000
26,000,000
3,500
90,000
Agency
30,000
6,000
12
CSU
24,000,000
9,000 -14%
20%
80,000
Parks and -40%
22,000,000
3,000
Recreation
8,000
25,000
10UC
5,000 -11%
20,000,000
70,000 17%
2,500
18,000,000
7,000 24,317
UC HHS
& CSU
60,000 2% 58%
15%
20,000
8
16,000,000
4,000
6,000
2,000
Total
50,000
14,000,000 Human
Retirement 337% * 12% Services
5,000
6 HHS
12,000,000 11% 35%
50%
15,000
Benefits
3,000
1,500
40,000 16,322 11%
CDCR
10,000,000
10%
4,000 33%
STRS
30,000
4 8%
Retiree
8,000,000
1,000
10,000
2,000
3,000 232% 7% UC/CSU
Health
Retiree 7%
6,000,000 241% 648
20,000
Health 648
4,000,000 9,689*
2,000
2500
5%
5% PERS/STRS/
5,000 220 220 379 379
1,000
10,000
PERS Retirement
2883%
2,000,000 220
PERS 145 103 145 2499%
Health Benefits
1,000 10,259
145
103 17,432 35,974 85,816
$0 2%
$0 - - 2000-01 2001-02 % 2002-03% 2003-04 2004-05 2005-06 2006-07 1500% % 2008-09% 2009-10 2010-11
2007-08
-500% 0% 750% 1000% 1250% 1500% 1750% 2000 2010-112000%Estimate % 2500%
500% 1000%
$00 -250%
0 0.3% 0% 250 2000-01
500 2250 2500% 2750 3000%
20
20 01-1
201
20 13 2
20 -14
20 -1
20 8
20 -19
20 - 1
20 -22
20 -2
20 -26
20 - 7
20 - 9
20 -31
20 -3
20 -34
20 -35
20 -
20 -39
20 -
0.1%
1211 -12
12 1
1311
13 1315
14-14
14
15115
15
16 6
16216
17-1725
17
1821
18-1930
19-
1932
20-203
2132
20
22-2240
21-21
23423
22
25-2 - 0
23-24 5
2652
244255
27-2
28-286
25 5
2962
26-2755
30-3 5
3163 -
2752
32
28
33-3 -75
29-306
3473
35-3
30 0
36-368
31-32 0
3783
32733
38-3890
3993 -
33 3
34-3580
3584
36-37 5
37-37
38 8
39-4095
4- 4
Estimate
940
2000-01 2001-02 2002-03 2003-04 2004-05 2005-06 2006-07 2007-08 2010-11
2000-01 Parks
-- 0
-
- 4-
- 9-
-1520
-4
-17
-9
-20 5
- 4-4
-28 0
-4
- 42
-9
-9
-4
0% 2000-01
2000-01 2010-11 2009-10 2010-11
2010-11
2008-09
9
4-
9-
9
9-
49
9-
9-
8
3
6
17
4
6
9
-
-
-
-
-
-
21
2000-01 2001-02 2002-03 2003-04 2004-05 2005-06 2006-07 As of May Revision2009-10
2007-08 2008-09
Estimate Estimate
00
* DJIA as of July 6, 2010 to 2007-08 is discounted at 6%
* Active Healthcare prior Actual Cost
Salary PERS CalPERS 1999 Projection
Retiree Health
per annum back to 00-01 UC PERS fees
Student Retiree Health Student fees
CSU STRS
SB 400
Active Health STRS
6. The Public Employee Pension Crisis
in the U.S. and California
Josh Rauh
Kellogg School of Management
Pension Roundtable, Sacramento, California
July 8, 2010
7. Benefits: Current Plan Members in 50 States
600
$ billion Plans Frozen Today (ABO)
Common State Accounting (EAN)
Actual Expected Benefits (PVB)
500
400
300
200
100
0
2006 2010 2015 2020 2025 2030 2035 2040 2045 2050 2055 2060 2065 2070 2075 2080
Estimates by Robert Novy-Marx and Joshua Rauh © 2010 2
8. Benefits: CalPERS and CalSTRS
90
$ billion Plans Frozen Today (ABO)
Common State Accounting (EAN)
80
Actual Expected Benefits (PVB)
70
60
50
40
30
20
10
0
2006 2010 2015 2020 2025 2030 2035 2040 2045 2050 2055 2060 2065 2070 2075 2080
Estimates by Robert Novy-Marx and Joshua Rauh © 2010 3
9. Liabilities: CalPERS and CalSTRS
Our valuations as of June 2009, $ billions
Discount Rate Frozen Common Expected
(ABO) (EAN) (PVB)
Total Liabilities
System Chosen* $400.3 $473.0 $587.4
CA Taxable Muni $389.9 $450.4 $537.5
Treasury $639.7 $793.5 $1,080.3
Total Assets = $297.3
* 7.75% for CalPERS, 8.00% for CalSTRS
Comparisons to Reported Liabilities (EAN):
Total System-Reported 2008 EAN AAL was $446.1 (= $268.3 + $177.7)
Total System-Reported AAL grew 7-10% annually during 2006-2007
Estimates by Robert Novy-Marx and Joshua Rauh © 2010 4
10. Net Liabilities: CalPERS/CalSTRS
Our valuations as of June 2009, $ billions
Discount Rate Frozen Common Expected
(ABO) (EAN) (PVB)
Liabilities Net of $297.3B Assets
System Chosen* $103.0 $175.7 $290.1
CA Taxable Muni $92.6 $153.1 $240.2
Treasury $342.4 $496.2 $783.0
* 7.75% for CalPERS, 8.00% for CalSTRS
Estimates by Robert Novy-Marx and Joshua Rauh © 2010 5
11. Run-Out Dates
Current PVB, Annual PVB, Double
Assets and Contributions Employee
ABO at Current Contributions
Level (*)
8% Returns
CalPERS 2027 2041 —
CalSTRS 2026 2030 2034
6% Returns
CalPERS 2024 2032 2039
CalSTRS 2023 2026 2029
* Assumes workers receive no compensating changes
Estimates by Joshua Rauh © 2010 6