SlideShare ist ein Scribd-Unternehmen logo
1 von 18
Real Estate & Construction


Sector Review                                                                                                                    January 14, 2008

Working Capital Management is King
We took the time to review our valuation models in Brazil’s real estate
                                                                                                   Table 1 – Target Prices
sector and start the year with an update on target prices as well as on the
                                                                                                                         Last             TP     USD
strategy to play the sector going forward. We believe 2008 will be deeper                                                                                 Rating
                                                                                                                         Price           YE08   Upside
in terms of how the market analyses Brazilian homebuilders and would                                                   R$33.90       R$54.00    51.0%   BUY
                                                                                                   Company
                                                                                                                       R$23.93       R$29.00    14.9% NEUTRAL
                                                                                                   Cyrela
like to present our views on how to look beyond growth guidance.                                                       R$30.10       R$37.00    16.5% NEUTRAL
                                                                                                   Gafisa
                                                                                                                       R$12.39       R$33.50    156.3%  BUY
                                                                                                   Klabin Segall
                                                                                                                       R$34.50       R$55.00    51.1%   BUY
                                                                                                   MRV
          Cash is king: deeper into Brazil’s real estate sector cash
     •                                                                                                                 R$42.29       R$65.00    45.7%   BUY
                                                                                                   Rossi Res.
          flows. Since we started to follow the real estate sector in Brazil,                                          R$9.50        R$20.00    99.6%   BUY
                                                                                                   Tecnisa
          our main concern has neither been demand nor believing that
          companies could launch, and sell, planned projects. Our actual
                                                                                                   Table 2 – Price-Earnings Ratios
          concern has always been working capital management and its                                                         PER08E                 PER09E
          older brother, cash flow. The main challenge for companies is not                                                    9.9x                  7.8x
                                                                                                   Company
                                                                                                                              19.7x                  10.7x
                                                                                                   Cyrela
          growing, but managing growth and the consequent capital needs.                                                      17.3x                  10.6x
                                                                                                   Gafisa
                                                                                                                              11.1x                  5.7x
                                                                                                   Klabin Segall
                                                                                                                              15.7x                  8.9x
                                                                                                   MRV
          Sky remains blue; now it is leveraging time. We are now
     •                                                                                                                        14.3x                  10.3x
                                                                                                   Rossi Res.
          including construction financing for estimated launchings in order                                                   9.4x                  5.2x
                                                                                                   Tecnisa
                                                                                                   Average                    15.6x                  9.2x
          to get a better feeling on which companies will need further
          funding to accomplish growth plans.
                                                                                                   Table 3 – Launchings and Sales – R$MM
                                                                                                                       Launchings 08E              Sales 08E
          Back to fundamentals: growth stories at value prices. On a
     •                                                                                                                     1,500                     1,149
                                                                                                   Company
          different exercise, in order to try to find deep value in real estate                                            6,000                     4,400
                                                                                                   Cyrela*
                                                                                                                           3,000                     2,627
                                                                                                   Gafisa
          companies, instead of looking into the future, we decided to look                                                1,812                     1,706
                                                                                                   Klabin Segall*
          at what companies have accomplished so far and include in our                                                    2,100                     1,707
                                                                                                   MRV
                                                                                                                           2,500                     2,218
                                                                                                   Rossi Res.
          analysis a multiple which we consider almost a safety net when                                                   1,778                     1,387
                                                                                                   Tecnisa*
          choosing companies to invest on: Price-to-Adjusted Book Value.                           * Includes partners in developments


          There is a clear liquidity premium out there. Although we
     •
          could argue this premium in unwarranted, as the concerns about
          the global economy escalate, this aspect should be even more
          relevant going forward. In that sense, we are increasing our cost
          of equity for less liquid names by 100 bps.

          We are placing Rossi and MRV as our top picks in the
     •
          sector. We are reiterating our BUY rating for both stocks and
          placing them as our top picks based on: (i) both stories present
          better-than-average cash flow outlooks, being MRV’s free cash
          flow positive already from 2009 despite its aggressive growth
          plan; (ii) clear “under-promise-to-over-deliver” strategy in place;
          (iii) recent corrections on both stocks seem exaggerated,
          therefore,    creating a buying opportunity and; (iv) both are
          among the most liquid names in the sector.

          In addition, Klabin Segall and Tecnisa are our suggested
     •
          deep value plays. Based on high DCF-based upsides and both
          forward PE ratio as well as price-to-adjusted book value analysis,
          we see value in Klabin Segall and Tecnisa. Both stocks suffered
          from fears of frustrating growth expectations which should
          dissipate going forward.

                                                                                                                                     Rafael C. de Pinho
                                                                                                                                                  55 11 3089-8748
                                                                                                                                                rpinho@bulltick.com


                                          See appendix B for Important Disclosures
This report has been prepared by Bulltick Brasil Consultoria e Assessoria Empresarial Ltda. which is not an FINRA member, it’s not registered under the
US Securities and exchange commission, and its not regulated by any US Securities or commodities exchange. Non-US research analysts who have
prepared this report are not registered/ qualified as research analysts with the FINRA or any other US securities exchange or regulatory body
Cash is king: deeper into Brazil’s real estate sector cash flows

                               Since we started to follow the real estate sector in Brazil, our main concern has neither
Our main concern regarding
                               been demand nor believing that companies could launch, and sell, planned projects. Our
the real estate sector has
always been working capital    actual concern has always been working capital management and its older brother, cash
management.                    flow. The main challenge for companies is not growing, but managing growth and the
                               consequent capital needs.

                               As shown on Exhibit 1, typical working capital exposure to an average project should
                               hover between 20-30% of a project’s potential sales value (PSV). This is only possible
                               due to the use of construction financing, which allows companies to finance on average
                               70% of the cost of the building. So far, the return on newly developed projects has been
                               quite high on an IRR or NPV perspective. However, this return is only assured by the
                               project delivery, which is tied to managing correctly the cash flow.

                               Exhibit 1:                                     Typical project cash exposure with SFH financing

Considering construction       Potential Sales Value (PSV)                                                          100,000
financing, typical cash flow   Gross Margin                                                                             40%
exposure should hover          Total Cost                                                                           (60,000)
between 20-30% of a
project’s PSV.                 Land Cost (15% of PSV)                                                    (A)         (15,000)

                               Building Costs                                                                        (45,000)
                               SFH Financing = 70% of Building Costs                                                  31,500
                               Building Cash Exposure                                                    (B)         (13,500)

                               Total Cash Exposure (A) + (B)                                                        (28,500)
                               Source: Bulltick


                               Our cash flow exposure exercise depends on the companies being able to get financing to
                               reduce their own cash exposure to projects. A substantial stake of the capital Brazilian
                               banks are obliged to invest in real estate projects goes in the form of construction
                               financing. On Exhibit 2, we show the difference between a typical project cash flow
                               leveraged by construction financing and another one without the line.

                               Exhibit 2:                                     Typical project cash flows, SFH financing impact
                                                                               45%
                                                  Cash Exposure as % of PSV


                                                                               30%

                                                                               15%

                                                                                0%
                                                                                     1Q


                                                                                          2Q


                                                                                               3Q

                                                                                                    4Q


                                                                                                               5Q


                                                                                                                     6Q


                                                                                                                           7Q


                                                                                                                                8Q


                                                                                                                                     9Q


                                                                                                                                           10Q


                                                                                                                                                 11Q

                                                                                                                                                       12Q


                                                                              -15%

                                                                              -30%

                                                                              -45%

                                                                              -60%

                                                                                           With SFH leverage              Without SFH leverage

                               Source: Bulltick


                               Until now, the outlook for the Brazilian macroeconomic scenario suggests that the growth
As we assume the growth
cycle for homebuilders is      cycle for homebuilders is sustainable. This opinion seems to be shared by the companies
sustainable, we included       in the sector: the average growth in launchings estimates by company managements is
construction financing in
                               around 30% per year for the 2009-07 period.
our models…


                                                                                                                                                             2
Given this scenario, we have decided to include in our models the construction financing
…allowing us to better
evaluate those companies in    for projects within the SFH scope in order to better evaluate those companies in which
which extra funding should     extra cash will be needed to meet guidance going forward. If the financing conditions for
be needed, given current
                               real estate projects are unchanged, some of these companies may attempt to raise cash
market conditions.
                               either through debt or equity issues. In the case of equity issues, the potential EPS
                               dilution for shareholders is a concern.

                               Exhibit 3:            Free cash flow-to-equity, 2008-2012
                                                      Cash Position                     Free Cash Flows-to-Equity
                                    Company
                                                        (R$ MM)               2008        2009       2010      2011                2012
                               Cyrela                     800                  (68)     (1,225)    (2,174)   (2,678)                843
                               Tecnisa                    156                 (237)       (419)      (420)     (237)                319
                               Klabin Segall*             238                   37        (209)      (222)       83                 195
                               Rossi Residencial          377                 (221)         74        (88)     (161)                210
                               Company                    128                 (196)       (379)      (231)     (234)                  4
                               MRV                        882                 (164)         69        345       565                 720
                               Gafisa                     372                 (447)       (264)       309       327                 410
                               Source: Bulltick
                               * Cash adjusted for recently issued debentures


                               Back to fundamentals: growth stories at value prices

                               On a different exercise,                in order to try to find deep value in real estate companies,
We included Price-to-
                               instead of looking into                  the future, we decided to look at what companies have
Adjusted Book Value
                               accomplished so far and                 include in our analysis a multiple which we consider almost a
multiples to our analysis in
                               safety net when choosing                companies to invest on: Price-to-Adjusted Book Value.
order to find deep value
plays.
                               As the accounting for homebuilders does not help much our analysis, distorting financial
                               statements, especially given the high growth experienced over the last 2 years, we have
                               decided to make a simple adjustment to reported book value for the companies: we
                               added the backlog profits. The recognition of such profits is dependable only on building
                               and delivery. At this point, we think it is fair to assume sold apartments will be delivered.

                               Below, we present a table including the price-to-adjusted book value multiples for
                               companies under our coverage.

                               Exhibit 4:            Adjusted price-to-book values
                                      R$ Millions, unless noted            Company    Cyrela    Gafisa   Klabin    MRV     Rossi   Tecnisa   Average/Sum
                               Market Cap                                   1,221     8,511     3,867      731    4,666   3,335     1,381       23,710
                               3Q07 Reported Book Value                      328      1,994     1,493      400    1,339   1,177      735        7,466
                               Price / Book                                 3.73x     4.27x      2.59x    1.83x   3.49x    2.83x    1.88x        3.18x
                               Premium / Discount to Average                17.3%     34.4%     -18.5%   -42.5%    9.7%   -10.8%   -40.8%

                               Backlog
                               Revenues to recognize                         337       2,099    1,209    386       327    853       150        5,361
                               Cost to recognize                            (206)     (1,202)   (744)    (257)    (145)   (546)     (92)       (3,192)
                               Gross Profit to recognize                    131         897      466     128      181     307       58         2,169
                               Net Profits to recognize                     101         698      356      89      144     247       46         1,680

                                                                             428      2,692     1,850     489     1,483   1,424     781         9,146
                               Adjusted Book Value - Backlog Profits

                               Price / Adj. Book Value                      2.85x     3.16x     2.09x    1.50x    3.15x   2.34x     1.77x       2.59x
                               Source: Bulltick


                               As with PE ratios, Price-to-Book value analysis in real estate also shows some
                               inconsistency. First, we assume that the average project return between different
                               companies is similar. In addition, we remind investors that entry barriers in real estate
                               are relatively low, thus, exaggerated premiums are not sustainable in the long run, even
                               when a liquidity premium/discount is considered.

                               For investors looking to buy value in the sector, departing from price-to-adjusted book
Departing from this simple
                               value, companies like Klabin Segall and Tecnisa call our attention, especially when this
metric, Klabin Segall and
                               analysis is coupled with SFH financing analysis and with forward PE multiples.
Tecnisa call our attention.


                                                                                                                                                         3
Exhibit 5:       Price-to-Earnings 2009E


                                             12.0x
Even when considering a                                                                                                  10.7x
                                                                                                                10.6x
liquidity premium/discount,                                                                            10.3x
if the average project return                10.0x
                                                                                               9.2x
is similar and entry barriers                                                        8.9x
are inexistent, a 105% gap
between the extremes in                                                    7.8x
                                              8.0x
our PER09E multiples range
seem exaggerated to us.
                                                                  5.7x
                                              6.0x
                                                       5.2x


                                              4.0x
                                                     Tecnisa     Klabin   Company    MRV     Average   Rossi   Gafisa    Cyrela


                                              Source: Bulltick


                                Exhibit 6:       PE-to-growth multiples – 2009E


                                             0.30x
                                                                                                                         0.26x
                                                                                                                0.25x
                                             0.25x
                                                                                                       0.22x

                                             0.20x

                                                                                              0.15x
                                                                                    0.14x
                                             0.15x


                                             0.10x
                                                                          0.07x
                                                                 0.06x
                                                     0.05x
                                             0.05x


                                             0.00x
                                                     Tecnisa     Klabin    MRV      Gafisa   Company   Rossi   Average   Cyrela

                                             Source: Bulltick


                                                                                                                                  4
Company Outlooks

Rossi Residencial: TP-YE08 R$65.00, 45.7% upside potential in USD

As a consequence of one of the best cash flow outlooks going forward, we are placing
Rossi among our top picks in the sector, being the company our preferred name among
the most liquid stocks in the sector.

We are raising our TP to R$65.00 from R$59.00 on the back of higher launching
estimates, to which working capital needs are almost completely funded by construction
financing.

The stock’s recent 13% correction, which we perceive as linked to fears of an upcoming
follow-on offer by Rossi after Cyrela’s equity issue announcement, was unjustified.
However, should such a deal come up, investors should note the proceeds will probably
be invested in new projects, thus, with expectation to create value.

We currently see Rossi trading at a 10.3x PER09E vs. our average of 9.2x for the sector.
On top of being one of the most liquid names in the sector, and having a proven track
record as well as fair future cash flow outlook, we believe the stock deserves some
premium to both Cyrela and Gafisa.

Exhibit 7:          Rossi’s Main Figures
Rossi Res. (R$ MM)                  2006    2007E    2008E    2009E    2010E    2011E    2012E

Launchings                          882     1,981    2,500    3,000    3,360    3,696    3,844
 - Real Estate Sales                584      1,284    2,218    2,571    3,096    3,466    3,704

Net Revenues                         411      701    1,380    1,998    2,565    3,075    3,474
Adj. EBITDA                           61      137      297      464      626      753      851
Adj. Net income                       54      137      233      325      424      520      598

Gross Margin                       31.2%    35.3%    35.5%    35.6%    34.8%    34.3%    34.0%
Adj. EBITDA Margin                 12.4%    19.6%    21.5%    23.2%    24.4%    24.5%    24.5%
Adj. Net Margin                    10.6%    19.6%    16.9%    16.3%    16.5%    16.9%    17.2%

PER                                 62.0x    24.3x    14.3x    10.3x     7.9x     6.4x     5.6x
FV/EBITDA                           51.3x    25.5x    13.6x    10.2x     8.2x     7.2x     6.5x
Adjusted for IPO costs
Source: Rossi Residencial and Bulltick


MRV: TP-YE08 R$55.00, 51.1% upside potential in USD

We are also placing MRV among our top picks in the sector on the back of an interesting
growth-adjusted valuation and, in our view, an attractive entry point created recently by
the 20% drop in stock price since early December.

We disagree with the criticisms out on the street about the company’s aggressive growth
plans. As MRV benefits from the use of special credit lines targeted to low-income
developers by Caixa Economica, the company enjoys a comfortable cash flow position
going forward.

MRV shares currently trade at a 8.9x PER09E, a 7% discount over the first-tier group
composed by Rossi, Cyrela and Gafisa. On a growth-adjusted basis, MRV trades at PE09-
to-growth of 0.07x versus an average of 0.25x for Brazilian homebuilders.

We reiterate our positive view on the company and on the quality of its management,
which has potential to surprise the market going forward not only by over-delivering
results but also due to its search for innovative credit solutions to its clients. For example,

                                                                                                  5
MRV recently led the pack in signing a MOU with Caixa Economica in order to gain scale in
low-income credit approval and grant financing for 12,000 units in 2008, a move quickly
followed by its competitors.

Main changes to our model were the inclusion of the revised launching estimates for 2008
and 2009 and modeling of the SFH financing. Besides, as this report was being written,
we had to stop the press in order to account for the fact that the company beat its 2007
estimates. Our DCF-model points to a Dec 08 TP of R$55.00/share, implying a 51.1%
potential upside in USD and therefore a BUY rating for the stock.

Exhibit 8:         MRV’s main figures
 MRV (R$ MM)                2006    2007E    2008E    2009E    2010E    2011E    2012E

 Launchings                 337     1,200    2,100    2,520    2,898    3,130    3,318
  - Real Estate Sales       206       717     1,707    2,298    2,705    3,001    3,220

 Net Revenues               140       399    1,046    1,811    2,371    2,745    3,019
 Adj. EBITDA                 22       100      291      579      762      886      960
 Adj. Net income             17       114      297      523      685      792      855

 Gross Margin               35%       40%      43%      43%      42%      41%      40%
 Adj. EBITDA Margin         16%       25%      28%      32%      32%      32%      32%
 Adj. Net Margin            12%       29%      28%      29%      29%      29%      28%

 PER                       274.2x    87.7x    15.7x     8.9x     6.8x     5.9x     5.5x
 FV/EBITDA                 209.8x   102.3x    16.3x     8.2x     6.3x     5.5x     5.1x
Adjusted for IPO costs
Source: MRV and Bulltick


Cyrela: TP-YE08 R$30.00, 14.9% upside potential in USD

After incorporating the most recent launchings guidance and including the SFH leverage
into our model, we are increasing our YE08 TP to R$29.00/share from R$26.00/share and
downgrading Cyrela to NEUTRAL from BUY. At this point we prefer to take a more
cautious stance concerning Cyrela, based on our estimates for the company’s cash flow
for the coming years.

Despite having a substantial amount of receivables, which could offset its funding needs,
our analysis suggests that the company should direct most of the resources from recently
announced debt and equity issues to comply with the working capital needs for the
intended R$13.5 billion in launchings over 2008 and 2009.

Besides the working capital management factor, the overhang created by the new equity
issue announcement, the third since September 2005, reinforce our view.

We see Cyrela shares, currently trading at 10.7x PER09E, at premium to both Rossi and
Gafisa. However, at this point we believe Rossi deserves a premium over Cyrela as it is in
better shape to face its working capital needs going forward.


                                                                                          6
Exhibit 9:          Cyrela’s Main Figures
Cyrela (R$MM)                  2006      2007E    2008E    2009E    2010E    2011E    2012E

Launchings                    3,618      4,600    6,000    7,500    8,400    9,240    9,610
 - Real Estate Sales           2,247      3,400    4,400    6,053    7,424    8,382    9,097

Net Revenues                  1,064      1,561    2,040    3,727    5,430    6,905    8,146
Adj. EBITDA                     196        403      539    1,075    1,582    1,998    2,351
Adj. Net Income                 190        330      431      796    1,220    1,589    1,856

Gross Margin                  39.4%      42.1%    42.8%    42.5%    41.8%    41.1%    40.8%
Adj. EBITDA Margin            18.4%      25.8%    26.4%    28.8%    29.1%    28.9%    28.9%
Adj. Net Margin               17.8%      21.1%    21.1%    21.4%    22.5%    23.0%    22.8%

PER                            44.8x      19.3x    19.7x    10.7x     7.0x     5.4x     4.6x
FV/EBITDA                      41.2x      21.0x    17.0x     9.5x     6.5x     5.3x     4.5x
Adjusted for non-recurring gains
Source: Cyrela and Bulltick


Gafisa: TP-YE08 R$37.00, 16.5% upside potential in USD

Our revised TP of R$37.00/share for Gafisa, up 12% from our previous TP of
R$33.00/share, is a result of increased launchings guidance and fine tuning to our model.
Nonetheless, we are downgrading Gafisa shares to NEUTRAL from BUY on the back of the
same conservative stance we applied to Cyrela. Our analysis indicates Gafisa should need
between R$350-R$450 million in additional funding, besides leveraging through SFH
construction financing, to provide for its working capital needs.

Additionally, we are still waiting to see concrete results arising from the company’s new
business lines Fit and Bairro Novo, added to Alphaville’s acquisition. We currently see
Gafisa stocks trading at a 10.6x PER09E, 15% above the average of the companies under
our coverage.

Exhibit 10:         Gafisa’s Main Figures
Gafisa (R$MM)                  2006      2007E    2008E    2009E    2010E    2011E    2012E

Launchings                    1,005      1,900    3,000    3,360    3,695    3,846    3,999
 - Real Estate Sales            995       1,625    2,627    3,086    3,505    3,729    3,908

Net Revenues                       664   1,124    1,565    2,201    2,912    3,346    3,651
Adj. EBITDA                         98     175      279      493      678      780      834
Adj. Net Income                     76     122      225      368      495      575      613

Gross Margin                  29.8%      30.4%    31.5%    32.3%    32.1%    31.7%    31.1%
Adj. EBITDA Margin            14.8%      15.6%    17.8%    22.4%    23.3%    23.3%    22.8%
Adj. Net Margin               11.4%      10.9%    14.4%    16.7%    17.0%    17.2%    16.8%

PER                            84.3x      42.2x    17.3x    10.6x     7.8x     6.7x     6.3x
FV/EBITDA                      57.3x      27.4x    15.6x     9.8x     7.4x     6.6x     6.3x
Adjusted for IPO costs
Source: Gafisa and Bulltick


                                                                                               7
Tecnisa: TP-YE08 R$20.00, 96.5% upside potential in USD

Tecnisa stocks continue to be among the most discounted within our coverage universe.
Against the market, the company was able to deliver 2007 launchings. This piece of news
came out at the very end of the year and we believe it was overlooked by most of the
market. The fact was also overshadowed by the pessimistic sentiment that has recently
pushed market indices downward.

As to the changes to our model, besides modeling of SFH construction financing, we
incorporated the latest launchings guidance provided by the company. We also raised our
discount rates to reflect the stock’s lower liquidity.

Despite the higher discount rate, we still see the shares trading at a 52% discount to our
Dec 08 target price of R$20.00/share. As described above, investing in Tecnisa is also
attractive if we think in terms of P/ Adjusted Book Value ratio, trading at 1.77x vs. an
average of 2.59x for the companies under our coverage. It is also important to mention
that the company has a substantial amount of receivables which could help to cover the
company’s capital needs. Therefore, we are maintaining our BUY rating for the stocks.

Exhibit 11:        Tecnisa’s Main Figures
Tecnisa (R$ MM)                2006    2007E    2008E    2009E    2010E    2011E    2012E

Launchings                     369     1,364    1,778    2,235    2,504    2,601    2,705
 - Real Estate Sales           333       706     1,387    1,877    2,270    2,476    2,618

Net Revenues                    203      364      740    1,430    1,942    2,304    2,518
Adj. EBITDA                      47       80      199      418      572      678      753
Adj. Net Income                  36       88      146      265      380      491      546

Gross Margin                   40.0%   38.6%    39.3%    39.0%    38.5%    38.2%    38.0%
Adj. EBITDA Margin             23.1%   11.0%    26.9%    29.2%    29.4%    29.4%    29.9%
Adj. Net Margin                17.6%   13.2%    19.8%    18.5%    19.6%    21.3%    21.7%

PER                            38.6x    15.8x     9.4x     5.2x     3.6x     2.8x     2.5x
FV/EBITDA                      32.4x    17.6x     8.6x     5.0x     3.8x     3.4x     3.2x
Adjusted for IPO costs
Source: Tecnisa and Bulltick


Klabin Segall: TP-YE08 R$33.50, 148% upside potential in USD

Among the less liquid names, Klabin Segall is the most discounted stock under our
coverage universe. The company had its ups and downs to manage and deliver expected
launchings growth during 2007 and we believe current prices more than reflect those
issues. Nevertheless, we expect a more smooth string of launchings going forward,
increasing results visibility, which we expect to translate in some share price recovery.

Currently trading at 5.7x PER09E, a 38% discount to the sector average, stocks are
attractive not only on a PER basis. Investors looking for deep value, the shares are also
trading at almost without any premium to adjusted book value multiple, and 43%
discounted to the sector average.

In addition, we expect to see some more of the innovative projects Klabin Segall became
known for executing successfully. For example, during 2008 and 2009 the company plans
to develop an integrated complex of commercial and middle income residential project in
Santo André, besides applying its revitalization experience to launch a 2nd home project in
Buzios, Rio de Janiero state coast. We also look forward to see the initial results on the
“Olá” low income initiative.

Model review focused on increased launchings after Setin’s acquisition, including the
construction financing and fine tunning. Besides, we are also raising our discount rates to
                                                                                             8
reflect lower liquidity for the shares.

All in all, we reach a Dec. 08 TP of R$33.50/share, implying a 156% in USD and
reiterating our BUY rating for the shares.

Exhibit 12:         Klabin Segall’s Main Figures
Klabin Segall (R$ MM)                   2006      2007E      2008E      2009E      2010E     2011E      2012E

Launchings                              773      1,775      1,812       2,084     2,334      2,567      2,670
 - Real Estate Sales                    400        875       1,706       1,832     2,199      2,358      2,535

Net Revenues                             138       292         705      1,188      1,785      2,032     2,319
Adj. EBITDA                               59        62         168        307        482        557       634
Adj. Net income                           25        39          71        137        267        331       389

Gross Margin                           41.9%      36.1%      36.5%      36.4%      36.2%      36.4%     36.1%
Adj. EBITDA Margin                     27.4%      21.4%      23.8%      25.8%      27.0%      27.4%     27.3%
Adj. Net Margin                        17.8%      13.5%      10.0%      11.6%      14.9%      16.3%     16.8%

PER                                    206.0x      19.9x      11.1x       5.7x       2.9x       2.4x      2.0x
FV/EBITDA                               14.0x      13.8x       8.1x       5.5x       3.5x       3.1x      2.7x
Adjusted for IPO Costs
Source: Klabin Segall and Bulltick


Company: TP-YE08 R$54.00, 48.2% upside potential in USD

As part of our revision of Company’s valuation model, besides including higher launching
guidance for ’08 and ’09, we analyzed carefully its working capital management, not only
including SFH leverage but also the construction and sales speed curves.

Company trades at a 7.8x PER09E versus Tecnisa’s and Klabin Segall’s respective 5.2x
and 5.7x multiples and the average of 9.2x for homebuilders under our coverage. On a
Price-to-Adj Book Value basis, Company negotiates at 2.85x, slightly above the 2.59x
average for companies under our coverage.

Company shares are currently trading at premium to Tecnisa and Klabin Segall, where we
see more upside on a relative basis. Thus, despite a favorable valuation vis-à-vis the
more liquid names, at this point, we prefer to look for deep value and stick to Tecnisa and
Klabin Segall.

Our DCF TP for Company is R$55.00/share for YE08. After roughly 21% decline in share
prices since early December, we are upgrading Company to BUY from NEUTRAL.

Exhibit 13:         Company’s Main Figures
Company (R$ MM)                      2006      2007E       2008E      2009E      2010E      2011E      2012E

Launchings                           353       1,033      1,500       1,875      2,100      2,184      2,271
 - Real Estate Sales                 258         695       1,149       1,446      1,839      2,035      2,178

Net Revenues                          289        451        742         997      1,442      1,806      2,064
Adj. EBITDA                            69         90        166         233        327        398        439
Adj. Net income                        56         64        123         157        230        281        311

Gross Margin                         34.2%      30.7%      33.3%      34.4%      33.6%      33.0%      32.2%
Adj. EBITDA Margin                   20.4%      19.8%      22.4%      23.4%      22.7%      22.0%      21.3%
Adj. Net Margin                      15.8%      14.2%      16.6%      15.8%      15.9%      15.6%      15.1%

PER                                  21.9x      19.0x       9.9x        7.8x       5.3x       4.3x       3.9x
FV/EBITDA                            17.8x      15.6x       9.8x        8.2x       6.1x       5.3x       4.9x
Adjusted for IPO costs
Source: Company and Bulltick


                                                                                                                 9
Detailed Financial Statements

Rossi Residencial

         Income Statement (R$ MM)                  2006     2007E      2008E     2009E      2010E       2011E      2012E
         Launchings                                882      1,981      2,500     3,000      3,360       3,696      3,844
          - Real Estate Sales                       584      1,284      2,218     2,571      3,096       3,466      3,704

         Gross Revenues                            425        720      1,432     2,074      2,662       3,191      3,605
         Net Revenues                              411        701      1,380     1,998      2,565       3,075      3,474
          - COGS                                   (283)      (454)      (890)   (1,286)    (1,671)     (2,021)    (2,294)
         Gross Profit                              128        247        490       712        894       1,054      1,180
          - Sales Expeditures                       (46)       (59)      (117)     (160)      (180)       (215)      (243)
          - G&A Expenditures                        (38)       (59)       (85)     (107)      (111)       (115)      (120)
          - Other Operational                          6         7          8        16         21          28         32
         EBIT                                        50       136        296       462        624         751        848
         Financial Results                           47         24        (39)     (104)      (153)       (173)      (184)
         Non-Operational Results                    (52)    (3,447)       -         -          -           -          -
         EBT                                         46       157        256       357        471         577        664
         Income Tax                                   (2)      (20)       (23)      (32)       (47)        (58)       (66)
         Minority Interest                          -          -          -         -          -           -          -
         Net income                                  44       137        233       325        424         520        598

         Depreciation                               0.9        1.3       1.5        1.8        2.1         2.6        3.2
         EBITDA                                     51        137       297        464        626         753        851
         Adjustments                                 10        -         -          -          -           -          -
         Adjusted EBITDA                            61        137       297        464        626         753        851

         Gross Margin                             31.2%     35.3%      35.5%     35.6%      34.8%       34.3%      34.0%
         Adjusted EBITDA Margin                   14.9%     19.6%      21.5%     23.2%      24.4%       24.5%      24.5%
         Adjusted Net Margin                      13.1%     19.6%      16.9%     16.3%      16.5%       16.9%      17.2%
         Free Cash Flow                            2006     2007E      2008E     2009E      2010E       2011E      2012E

         EBITDA                                      51        137       297        464        626         753       851
         Taxes on EBIT                               (2)       (18)      (27)       (42)        (62)       (75)      (85)
         Change in Net Working Assets              (408)      (234)     (917)      (876)      (870)       (929)     (489)
         CAPEX                                       (2)         (1)       (2)        (2)         (3)        (3)       (4)
         FCFF                                     (361)      (115)     (648)      (456)      (309)       (254)      274
         Change in Debt                             (14)       422       463        625        359         249       102
         Emission                                   755        -         -          -           -          -         -
         Financial Results                           47         24       (39)      (104)      (153)       (173)     (184)
         Tax difference                               0          (2)        4          9         15         17        18
         FCFE                                      428        329      (221)         74        (88)      (161)      210

         Balance Sheet                             2006     2007E      2008E     2009E      2010E       2011E      2012E

         Assets
         Cash and Equivalents                       327       377         311       246        164         164        164
         Accounts Receivable                        392       353       1,107     1,550      2,001       2,601      2,855
         Inventories                                552       901       1,006     1,400      1,787       2,087      2,296
         Other                                      220       537         468       644        632         433        560
         Total Assets                             1,490     2,168      2,892     3,840      4,583       5,285      5,875
         Liabilities
         Short Term Debt                             89       135        135        135        135         135        135
         Clients Advance Payments                     2        -          -         -          -           -          -
         Long Term Debt                              37       414        877      1,502      1,861       2,110      2,212
         Other                                      283       445        531        610        677         739        779
         Equity                                   1,080     1,174      1,349     1,593      1,911       2,301      2,749
         Total Liabilities                        1,490     2,168      2,892     3,840      4,583       5,285      5,875
         Source: Rossi Residencial and Bulltick


                                                                                                                             10
MRV

      Income Statement (R$ MM)       2006      2007E     2008E     2009E      2010E      2011E      2012E
      Launchings                     337       1,200     2,100     2,520      2,898      3,130      3,318
       - Real Estate Sales            206        717      1,707     2,298      2,705      3,001      3,220

      Gross Revenues                 160        430      1,085     1,879      2,460      2,849      3,134
      Net Revenues                   140        399      1,046     1,811      2,371      2,745      3,019
       - COGS                         (91)      (240)      (595)   (1,036)    (1,386)    (1,619)    (1,805)
      Gross Profit                    50        159        450       775        984      1,126      1,214
       - Sales Expeditures            (11)       (29)       (98)     (132)      (156)      (173)      (185)
       - G&A Expenditures             (24)      (108)       (62)      (66)       (69)       (71)       (72)
       - Other Operational               9        26         32        42         52         58         60
      EBIT                            24          48       322       619        812        941      1,017
      Financial Results                 (3)       32         28         (3)        (6)        (9)      (11)
      Non-Operational Results            0          0       -         -          -          -          -
      EBT                             20          81       350       616        805        932      1,005
      Income Tax                        (3)      (28)       (52)      (92)      (121)      (140)      (151)
      Minority Interest               -            (0)      -         -          -          -          -
      Net income                      17          53       297       523        685        792        855

      Depreciation                    0.2        0.8       1.4        2.0        2.3        2.6        2.9
      EBITDA                          22         39       291        579        762        886        960
      Adjustments                     -           61       -          -          -          -          -
      Adjusted EBITDA                 22        100       291        579        762        886        960

      Gross Margin                   35.3%     39.9%     43.1%     42.8%      41.5%      41.0%      40.2%
      Adjusted EBITDA Margin         16.0%     25.0%     27.9%     32.0%      32.1%      32.3%      31.8%
      Adjusted Net Margin            12.1%     28.5%     28.4%     28.9%      28.9%      28.8%      28.3%
      Free Cash Flow                 2006      2007E     2008E     2009E      2010E      2011E      2012E
      EBITDA                            22        39       291        579        762        886       960
      Taxes on EBIT                      (4)     (29)      (48)       (93)      (122)      (141)     (153)
      Change in Net Working Assets     (69)     (553)     (573)      (436)      (325)      (198)      (98)
      CAPEX                              (2)      (5)        (7)        (4)        (4)        (5)       (5)
      FCFF                            (52)     (535)     (337)         47       311        542       704
      Change in Debt                    63       (14)      149         25         39         30        25
      Emission                         -       1,231       -          -          -          -         -
      Financial Results                (12)      (18)      (12)       (61)       (79)       (85)      (94)
      Tax difference                      1        1         (4)         0          1          1         2
      FCFE                              (1)     666      (204)         11       272        489       637

      Balance Sheet                  2006      2007E     2008E     2009E      2010E      2011E      2012E

      Assets
      Cash and Equivalents             9         702        132       132        132        132        132
      Accounts Receivable            129         493      1,003     1,197      1,413      1,509      1,543
      Inventories                    235         644        957     1,314      1,539      1,700      1,820
      Other                            7         107        580       656        948      1,418      2,015
      Total Assets                   380       1,945     2,672     3,299      4,032      4,758      5,509
      Liabilities
      Short Term Debt                 48          16        16         16         16         16         16
      Clients Advance Payments        28          35        27         10         12        -          -
      Long Term Debt                  17          36       185        209        248        278        304
      Other                          197         479       842      1,069      1,246      1,361      1,446
      Equity                          91       1,380     1,603     1,996      2,509      3,103      3,744
      Total Liabilities              380       1,945     2,672     3,299      4,032      4,758      5,509
      Source: MRV and Bulltick


                                                                                                              11
Cyrela

         Income Statement (R$ MM)          2006     2007E       2008E        2009E       2010E       2011E       2012E
         Launchings                      3,618      4,600       6,000        7,500       8,400       9,240       9,610
          - Real Estate Sales             2,247      3,400       4,400        6,053       7,424       8,382       9,097

         Gross Revenues                  1,104      1,625       2,117        3,868       5,635       7,167       8,455
         Net Revenues                    1,064      1,561       2,040        3,727       5,430       6,905       8,146
          - C OGS                          (645)      (904)     (1,166)      (2,142)     (3,162)     (4,069)     (4,826)
         Gross Profit                      419        657         873        1,584       2,268       2,836       3,320
          - Sales Expeditures              (131)      (170)       (204)        (373)       (543)       (691)       (815)
          - G&A Expenditures                (73)      (103)       (125)        (131)       (136)       (142)       (147)
          - Management Fees                   (2)       (2)          (2)          (2)         (3)         (3)         (3)
          - Other Operational               (18)         6         -            -           -           -           -
         EBIT                              196        388         542        1,078       1,585       2,001       2,355
         Financial Results                   49         46           39         (51)        (15)          44          33
           - Financial Expenses             (84)      (102)       (138)        (186)       (187)       (194)       (211)
           - Financial Revenues             133        149         177          135         172         237         244
         Non-Operational Results            -          0.1         -            -           -           -           -
         Equity Pick-Up                     -          110         -            -           -           -           -
         EBT                               244        545         582        1,027       1,571       2,045       2,387
         Income Tax                         (58)       (57)        (87)        (123)       (188)       (245)       (286)
         Employee Interest                    (5)       (9)          (5)          (5)         (5)         (6)         (6)
         Minority Interest                  (24)       (39)        (58)        (103)       (157)       (204)       (239)
         Net income                        190        440         431          796       1,220       1,589       1,856

         Depreciation                       3.6         1.6        1.7          1.9         2.0         2.2         2.4
         Amortization                       1.5         -          -            -           -           -           -
         Employee Interest                   (5)          (9)        (5)          (5)         (5)         (6)         (6)
         EBITDA                            196         403        539        1,075       1,582       1,998       2,351
         Adjustments                       20.8         -          -            -           -           -           -
         Adjusted EBITDA                   217         403        539        1,075       1,582       1,998       2,351

         Gross Margin                     39.4%      42.1%       42.8%        42.5%       41.8%       41.1%       40.8%
         Ajudsted EBITDA Margin           20.4%      25.8%       26.4%        28.8%       29.1%       28.9%       28.9%
         Adjusted Net Margin              19.8%      21.1%       21.1%        21.4%       22.5%       23.0%       22.8%

         Free Cash Flow                    2006      2007E      2008E        2009E       2010E       2011E       2012E

         EBITDA                             196         403        539        1,075       1,582       1,998       2,351
         Minority Adjustment                (62)       (118)      (176)        (339)       (400)       (391)       (232)
         Taxes on EBIT                      (47)        (40)        (81)       (129)       (190)       (240)       (283)
         C hange in Net Working Assets     (735)     (1,223)    (1,191)      (2,388)     (3,251)     (4,298)     (1,198)
         C APEX                             (39)       (269)          (3)         (3)         (3)         (3)         (4)
         FCFF                             (686)     (1,247)      (912)      (1,784)     (2,263)     (2,936)        635
         C hange in Debt                    (79)        509        810          604         101         219         179
         Emission                           -           -           -           -           -           -           -
         Financial Results                   49           46          39        (51)        (15)          44          33
         Tax difference                     (11)        (17)          (6)          6           2          (5)         (4)
         FCFE                             (727)       (709)        (68)     (1,225)     (2,174)     (2,678)        843

         Balance Sheet                     2006      2007E      2008E        2009E       2010E       2011E       2012E

         Assets
         C ash and Equivalents              561        671         785          399         363         363         363
         Accounts Receivable                865      1,104       1,586        2,668       3,856       6,157       7,040
         C lient Financing                  -          522         689        1,061       2,303       3,644       3,492
         Inventories                        976      1,696       2,306        3,447       4,432       5,262       5,830
         Other                             640         142         213          (96)     (1,880)     (4,321)     (3,611)
         Total Assets                    3,042      4,134       5,578        7,478       9,073      11,105      13,115
         Liabilities
         Short Term Debt                      57       86           86            86          86          86          86
         Real Estate Acquisition Payables   351       758          891        1,067       1,195       1,314       1,367
         C lients Advance Payments            84       35            7          -           -           -           -
         Long Term Debt                       67      548        1,358        1,962       2,064       2,283       2,462
         Other                               535      713          919        1,450       1,901       2,401       2,787
         Equity                           1,949     1,993       2,317        2,914       3,829       5,021       6,413
         Total Liabilities                3,042     4,134       5,578        7,478       9,073      11,105      13,115
         Source: Cyrela and Bulltick


                                                                                                                            12
Gafisa

         Income Statement (R$ MM)             2006    2007E      2008E     2009E     2010E     2011E     2012E
         Launchings                         1,005     1,900      3,000     3,360     3,695     3,846     3,999
          - Real Estate Sales                  995     1,625      2,627     3,086     3,505     3,729     3,908

         Gross Revenues                      744      1,192      1,665     2,342     3,098     3,560     3,884
         Net Revenues                        664      1,124      1,565     2,201     2,912     3,346     3,651
          - C OGS                            (466)      (782)    (1,071)   (1,491)   (1,978)   (2,286)   (2,517)
         Gross Profit                        198        342        494       710       934     1,061     1,134
          - Sales Expeditures                 (52)       (71)      (110)     (110)     (146)     (167)     (183)
          - G&A Expenditures                  (52)      (103)      (117)     (122)     (127)     (132)     (137)
          - Other Operational                 (30)       (38)       -         -         -         -         -
         EBIT                                  64       130        267       479       661       762       815
         Financial Results                    (12)       (18)       (12)      (61)      (79)      (85)      (94)
           - Financial Expenses               (65)       (62)       (31)      (74)      (92)      (97)     (106)
           - Financial Revenues                 53         44         19        14        13        13        12
         Non-Operational Results              -          -          -         -         -         -         -
         EBT                                   52       112        255       418       582       677       721
         Income Tax                             (6)      (14)       (31)      (50)      (87)     (102)     (108)
         Minority Interest                    -            (6)      -         -         -         -         -
         Net income                            46         92       225       368       495       575       613

         Depreciation                         4.3       14.7       12.0     14.6       16.9     18.1       18.8
         EBITDA                               68        145        279      493        678      780        834
         Adjustments                           30       30.2        -        -          -        -          -
         Adjusted EBITDA                      98        175        279      493        678      780        834

         Gross Margin                       29.8%     30.4%      31.5%     32.3%     32.1%     31.7%     31.1%
         Adjusted EBITDA Margin             14.8%     15.6%      17.8%     22.4%     23.3%     23.3%     22.8%
         Adjusted Net Margin                11.4%     10.9%      14.4%     16.7%     17.0%     17.2%     16.8%

         Free Cash Flow                      2006     2007E      2008E     2009E     2010E     2011E     2012E

         EBITDA                                 68       145       279        493      678       780        834
         Taxes on EBIT                          (8)        (9)     (33)       (59)    (102)     (117)      (125)
         C hange in Net Working Assets       (397)      (759)     (880)    (1,106)    (341)     (376)      (301)
         C APEX                                 (6)      (36)      (18)       (22)     (20)      (20)       (21)
         FCFF                               (343)      (659)     (652)      (694)     216       267        387
         C hange in Debt                      (21)        89       214        482      158       129        100
         Emission                             -          623       -          -        -         -          -
         Financial Results                    (12)       (18)      (12)       (61)     (79)      (85)       (94)
         Tax difference                          2         (5)       3          9        14        15         17
         FCFE                               (374)         30     (447)      (264)     309       327        410

         Balance Sheet                       2006     2007E      2008E     2009E     2010E     2011E     2012E

         Assets
         C ash and Equivalents                266        310        130       130       130       130       130
         Accounts Receivable                  560        924      1,489     2,222     2,621     2,890     3,011
         Inventories                          441        921      1,375     1,803     1,805     2,008     2,129
         Other                                227        337        158       (56)      240       494       797
         Total Assets                       1,494     2,492      3,153     4,099     4,795     5,523     6,067
         Liabilities
         Short Term Debt                       28         34        34        34         34        34         34
         Real Estate Acquisition Payables      22         25        58        94        126       146       155
         C lients Advance Payments             76         17        -         -           9        83       -
         Long Term Debt                       267        351       564      1,046     1,204     1,333     1,433
         Other                                286        553       816        969     1,095     1,168     1,226
         Equity                               814     1,512      1,680     1,956     2,327     2,759     3,219
         Total Liabilities                  1,494     2,492      3,153     4,099     4,795     5,523     6,067
         Source: Gafisa and Bulltick


                                                                                                                   13
Tecnisa

          Income Statement (R$ MM)           2006      2007E     2008E      2009E      2010E      2011E      2012E
          Total Launchings                   369       1,364     1,778      2,235      2,504      2,601      2,705
          Launchings - Tecnisa Stake         285       1,000     1,600      1,900      2,128      2,341      2,434
          Total Real Estate Sales             333        706      1,387      1,877      2,270      2,476      2,618

          Gross Revenues                     211        379       768       1,484      2,016      2,391      2,613
          Net Revenues                       203        364       740       1,430      1,942      2,304      2,518
           - COGS                            (122)      (224)     (449)       (872)    (1,194)    (1,425)    (1,560)
          Gross Profit                         81       141       291         558        748        879        958
           - Sales Expeditures                (11)       (20)      (37)        (79)      (107)      (127)      (126)
           - G&A Expenditures                 (21)       (38)      (43)        (45)       (47)       (49)       (51)
           - Management Fees                    (2)        (4)     (12)        (17)       (22)       (26)       (29)
           - Other Operational                  (0)      (37)      -           -          -          -          -
          EBIT                                 47         41      199         418        571        677        752
          Financial Results                      2        17       (12)        (47)       (55)       (58)       (64)
            - Financial Expenses              (16)       (17)      (25)        (59)       (70)       (80)       (89)
            - Financial Revenues                18        34         13         12          15        23          25
          Non-Operational Results                1       729       -           -          -          -          -
          EBT                                  49         59      187         370        516        620        688
          Income Tax                            (9)        (9)     (22)        (44)       (52)       (62)       (69)
          Employee Interest                   -          -         -           -          -          -          -
          Minority Interest                                (2)     (19)        (61)       (85)       (66)       (73)
          Net income                           36         48      146         265        380        491        546

          Depreciation                        0.4       (1.2)       0.4        0.4        0.4        0.4        0.5
          Amortization                        -          -          -          -          -          -          -
          Employee Interest                   -          -          -          -          -          -          -
          EBITDA                              47         40        199        418        572        678        753
          Adjustments                         -           40        -          -          -          -          -
          Adjusted EBITDA                     47         80        199        418        572        678        753

          Gross Margin                       40.0%     38.6%     39.3%      39.0%      38.5%      38.2%      38.0%
          Adjusted EBITDA Margin             23.1%     21.9%     26.9%      29.2%      29.4%      29.4%      29.9%
          Adjusted Net Margin                17.6%     24.0%     19.8%      18.5%      19.6%      21.3%      21.7%

          Free Cash Flow                     2006      2007E     2008E      2009E      2010E      2011E      2012E

          EBITDA                                 47       40        199        418        572        678        753
          Minority Adjustment                  (10)      (16)       (21)       (70)       (94)       (73)       (82)
          Taxes on EBIT                          (8)       (3)      (24)       (50)       (57)       (68)       (75)
          Change in Net Working Assets         (88)     (567)      (678)    (1,035)      (885)      (835)      (310)
          CAPEX                                  (2)       (1)        (1)        (1)        (1)        (1)        (1)
          FCFF                                (62)     (552)      (525)      (738)      (465)      (299)       285
          Change in Debt                         92      (18)       298        360          95       114          92
          Emission                             -         591        -          -          -          -          -
          Financial Results                       2       17        (12)       (47)       (55)       (58)       (64)
          Tax difference                         (0)       (6)         1          6          6          6          6
          FCFE                                 31         32      (237)      (419)      (420)      (237)       319

          Balance Sheet                      2006      2007E     2008E      2009E      2010E      2011E      2012E

          Assets
          Cash and Equivalents                  20       120        100        100        100        100        100
          Accounts Receivable                174         299        597      1,267      1,820      2,327      2,547
          Client Financing                    -           11         15         26        121        269        260
          Inventories                        232         659      1,116      1,550      1,841      2,063      2,184
          Other                                 83        94        (52)      (430)      (858)    (1,140)      (910)
          Total Assets                       509       1,184     1,777      2,512      3,024      3,619      4,180
          Liabilities
          Short Term Debt                    118          41        41          41          41        41          41
          Real Estate Acquisition Payables   116         156       239        284        318        350         364
          Clients Advance Payments            28           8         2         -          -          -          -
          Long Term Debt                      41         100       398        759        854        968       1,060
          Other                               61         107       216        349        446        526         572
          Equity                             145         772       882      1,080      1,365      1,734      2,143
          Total Liabilities                  509       1,184     1,777      2,512      3,024      3,619      4,180
          Source: Tecnisa and Bulltick


                                                                                                                        14
Klabin Segall

         Income Statement (R$ MM)            2006     2007E     2008E     2009E     2010E      2011E     2012E
         Launchings                          773      1,775     1,812     2,084     2,334      2,567     2,670
          - Real Estate Sales                 400       875      1,706     1,832     2,199      2,358     2,535

         Gross Revenues                      144       306       738      1,244     1,869      2,127     2,428
         Net Revenues                        138       292       705      1,188     1,785      2,032     2,319
          - COGS                              (80)     (187)     (448)      (755)   (1,138)    (1,292)   (1,481)
         Gross Profit                         58       106       258        433       646        740       838
          - Sales Expeditures                   (8)     (26)      (53)       (89)     (134)      (152)     (174)
          - G&A Expenditures                  (12)      (24)      (49)       (51)      (53)       (55)      (57)
          - Other Operational                   (4)       (2)     -          -         -          -         -
         EBIT                                 34         58      163        305       479        554       631
         Financial Results                       5         9      (35)       (76)      (89)       (77)      (74)
           - Financial Expenses                 (8)     (15)      (46)       (81)      (94)       (81)      (78)
           - Financial Revenues                12        25        10          5         5          5         5
         Non-Operational Results              (20)       67       -          -         -          -         -
         EBT                                  19         67      128        229       390        477       557
         Income Tax                             (8)     (13)      (26)       (46)      (78)       (95)     (111)
         Employee Interest                    -         -         -          -         -          -         -
         Minority Interest                      (7)     (15)      (32)       (46)      (45)       (50)      (56)
         Net income                              4       39        71       137       267        331       389

         Depreciation                         3.4       4.8       4.7       1.9        2.3        2.8       3.4
         Amortization                         -         -         -         -          -          -         -
         EBITDA                               38        62       168       307        482        557       634
         Adjustments                           21       -         -         -          -          -         -
         Adjusted EBITDA                      59        62       168       307        482        557       634

         Gross Margin                        41.9%    36.1%     36.5%     36.4%     36.2%      36.4%     36.1%
         Adjusted EBITDA Margin              42.4%    21.4%     23.8%     25.8%     27.0%      27.4%     27.3%
         Adjusted Net Margin                 17.8%    13.5%     10.0%     11.6%     14.9%      16.3%     16.8%

         Free Cash Flow                      2006     2007E     2008E     2009E     2010E      2011E     2012E

         EBITDA                                38        62       168       307        482       557       634
         Minority Adjustment                   (9)      (16)      (40)      (57)       (57)      (63)      (70)
         Taxes on EBIT                         (7)      (12)      (34)      (61)       (96)     (111)     (127)
         Change in Net Working Assets         (90)     (471)     (333)     (669)      (483)     (237)     (204)
         CAPEX                                 (4)        (6)       (5)       (3)        (3)       (4)       (5)
         FCFF                                (73)     (442)     (243)     (482)      (157)      142       228
         Change in Debt                         9       294       308       334           6         2       26
         Emission                            361        -         -         -          -         -         -
         Financial Results                      5          9      (35)      (76)       (89)      (77)      (74)
         Tax difference                        (0)        (1)        8       16         18        16        15
         FCFE                                302      (140)        38     (208)      (222)        84      196

         Balance Sheet                       2006     2007E     2008E     2009E     2010E      2011E     2012E

         Assets
         Cash and Equivalents                281        243         49        49        49         49        49
         Accounts Receivable                 104        209       465        808     1,052      1,161     1,289
         Client Financing                     -          -         -         -         -          -         -
         Inventories                         190        645       753      1,169     1,479      1,659     1,773
         Other                                 38        (18)     230         63      (138)       (71)       90
         Total Assets                        613      1,079     1,496     2,089     2,442      2,797     3,200
         Liabilities
         Short Term Debt                      16         12        12         12        12         12        12
         Real Estate Acquisition Payables    101        189       193       222       249        273       284
         Clients Advance Payments              1          1         0        -         -          -         -
         Long Term Debt                       12        309       617       952       958        960       986
         Other                                64        160       213       340       459        539       613
         Equity                              419        408       461       564       764      1,013     1,305
         Total Liabilities                   613      1,079     1,496     2,089     2,442      2,797     3,200
        Source: Klabin Segall and Bulltick


                                                                                                                   15
Company

          Income Statement (R$ MM)           2006       2007E     2008E     2009E     2010E     2011E      2012E
          Launchings                         353        1,033     1,500     1,875     2,100     2,184      2,271
           - Real Estate Sales                258         695      1,149     1,446     1,839     2,035      2,178

          Gross Revenues                      300        484       770      1,035     1,497     1,874      2,142
          Net Revenues                        289        451       742        997     1,442     1,806      2,064
           - COGS                             (190)      (313)     (495)      (654)     (957)   (1,210)    (1,398)
          Gross Profit                          99       138       247        343       485       596        665
           - SG&A expenditures                 (26)       (43)      (82)      (110)     (159)     (199)      (227)
           - Other Operational                 (12)         (6)     -          -         -         -          -
          EBIT                                  61         89      165        233       327       398        438
          Financial Results                      (2)      (16)      (20)       (48)      (57)      (67)       (72)
            - Financial Expenses               (17)       (35)      (32)       (59)      (67)      (77)       (83)
            - Financial Revenues                15         19        12         11        11        10         10
          Non-Operational Results                (0)      767       -          -         -         -          -
          EBT                                   55         74      145        185       270       331        366
          Income Tax                             (7)        (9)     (22)       (28)      (41)      (50)       (55)
          Employee Interest                      (2)      -         -          -         -         -          -
          Minority Interest                      (0)      -         -          -         -         -          -
          Net income                            45         64      123        157       230       281        311

          Depreciation                         0.4        0.4       0.4       0.4       0.4        0.4        0.4
          EBITDA                               59         90       166       233       327        398        439
          Adjustments                           10        -         -         -         -          -          -
          Adjusted EBITDA                      69         90       166       233       327        398        439

          Gross Margin                       34.2%      30.7%     33.3%     34.4%     33.6%     33.0%      32.2%
          Adjusted EBITDA Margin             24.0%      19.8%     22.4%     23.4%     22.7%     22.0%      21.3%
          Adjusted Net Margin                19.3%      14.2%     16.6%     15.8%     15.9%     15.6%      15.1%

          Free Cash Flow                     2006       2007E     2008E     2009E     2010E     2011E      2012E

          EBITDA                                 59        90       166       233       327        398       439
          Taxes on EBIT                           (8)     (11)      (25)      (35)      (49)       (60)      (66)
          Change in Net Working Assets        (175)      (225)     (541)     (841)     (535)      (619)     (367)
          CAPEX                                   (1)       (0)       (0)       (0)       (0)        (0)       (0)
          FCFF                               (125)      (147)     (400)     (643)     (257)      (281)          6
          Change in Debt                         73       155       222       304        74        103        60
          Emission                              -         -         -         -         -          -         -
          Financial Results                       (2)     (16)      (20)      (48)      (57)       (67)      (72)
          Tax difference                           1         2         3         7         8        10        11
          FCFE                                 (54)        (6)    (196)     (379)     (231)      (234)          4

          Balance Sheet                      2006       2007E     2008E     2009E     2010E     2011E      2012E

          Assets
          Cash and Equivalents                119        109         109       109       109       109        109
          Accounts Receivable                 297        371         819     1,379     1,687     2,111      2,351
          Inventories                         133        306         457       799     1,070     1,290      1,436
          Other                                59         89        (100)     (489)     (742)   (1,022)    (1,080)
          Total Assets                        607        875      1,285     1,798     2,124     2,489      2,816
          Liabilities
          Short Term Debt                      50         61         61         61        61        61         61
          Suppliers                            12         15         22         27        30        32         33
          Real Estate Acquisition Payables     35         52         76         95      106       110        115
          Clients Advance Payments              2          0          0        -         -         -          -
          Long Term Debt                       80        225        447       751       825       929        988
          Other                               137        188        252       318       384       428        457
          Equity                              291        335        428       546       718       929      1,162
          Total Liabilities                   607        875      1,285     1,798     2,124     2,489      2,816
          Source: Company and Bulltick


                                                                                                                     16
APPENDIX B
IMPORTANT DISCLOSURES


Bulltick Brasil Consultoria e Assessoria Empresarial Ltda. is an affiliate of Bulltick LLC (The Firm). Bulltick LLC may do
business with the companies covered in this report, as a result, investors should be aware that the Firm may have a
conflict of interest that could affect the objectivity of this report. Investors should consider this report only as a single
factor in making their investment decision.


A. CONFLICTS OF INTEREST

From the companies covered in this report, Bulltick Brasil Consultoria e Assessoria Empresarial Ltda, or its affiliates,
currently has, or has had within the past 12 months, Tecnisa and MRV as client and/or received compensation for products
and services provided to this company.

From the companies covered in this report, Bulltick Brasil Consultoria e Assessoria Empresarial Ltda, or its affiliates,
managed or co-managed a public offering of securities for Tecnisa and MRV in the past 12 months, received
compensation for investment banking services from Tecnisa and MRV in the past 12 months.

Neither Bulltick Brasil Consultoria e Assessoria Empresarial Ltda nor any of its affiliates own equity securities of any of the
subject companies.

Analyst compensation is determined by Bulltick Brasil Consultoria e Assessoria Empresarial Ltda management and is not
linked to specific transactions or recommendations.


B. ANALYST CERTIFICATION

I, Rafael Pinho, author of this report, hereby certify that all of the views expressed in this report accurately reflect my
personal views about any and all of the subject issuer(s) or securities, no part of my compensation was, is , or will be
directly or indirectly related to the specific recommendation(s) or view(s) in this report. I have not received any
compensation from any of the subject companies in the past 12 months. I also certify that neither I nor any member of
my household serves as a director, officer, or advisory board member of any of the subject companies in this report.


C. INVESTMENT RATING

Investment ratings are determined by the ranges described below:
BUY: Total return of securities expected to be above 18% (in dollar terms) in the following 12 months
NEUTRAL: Total return of securities expected to be below 18% (in dollar terms) and above 8% (in dollar terms) in the
following 12 months.
SELL: Total return of securities expected to be below 8% (in dollar terms) in the following 12 months.

Price Target: The valuation method used to determine the price targets in this report were based on the discounted
cash flow methodology.


D. RISK RATINGS

Risks for the achievement of the target prices defined in this report include major change in our base case macro-
economic scenario, increase in interest rates and in the Brazil risk, reduction in the expectations for demand for real
estate in Brazil and impact on already listed stocks of new IPOs in Brazil´s real estate sector.

Based on last 6 months volatility of subject companies, and comparing them to the volatility of the Bovespa Index
(Ibovespa) in the same period, we define each subject company´s relative volatility in the following way: Company
High, Cyrela High, Gafisa High, Klabin Segall High, Rossi Residencial High and Tecnisa High

                                                                                                                            17
OTHER DISCLOSURES

Bulltick Brasil Consultoria e Assessoria Empresarial Ltda and its subsidiaries, affiliates, shareholders, directors, officers,
employees, and licensors (“The Bulltick Parties”) will not be liable (individually, jointly, or severally) to you or any other
person as a result of your access, reception or use of the information contained in this document for indirect,
consequential, special, incidental, punitive, or exemplary damages, including, without limitation, lost profits, lost savings
and lost revenues (collectively, the “Excluded Damages”), whether or not characterized in negligence, tort, contract, or
other theory of liability.

The information contained in this document has been obtained from sources believed to be reliable, although its
accuracy and completeness cannot be guaranteed. All opinions, projections, and estimates constitute the judgment of
the author as of the date of the report and these, plus any other information contained in the report, are subject to
change without notice. Prices and availability of financial instruments also are subject to change without notice.

Bulltick Brasil Consultoria e Assessoria Empresarial Ltda and its affiliated companies have not taken any steps to insure
that the securities referred to in this report are suitable for any particular investor. The Report is for informational
purposes only and is not intended as an offer or solicitation for the purchase or sale of a security. Securities mentioned
in the report are subject to investment risks, including the possible loss of the principal amount invested. Any decision
to purchase securities mentioned in the Report must take into account existing public information on such a security or
any registered prospectus.

The financial instruments mentioned in this document may not be eligible for sale in some countries. The Report is not
to be construed as providing investment services in any jurisdiction where the provision of such services would be
illegal.

Bulltick Brasil Consultoria e Assessoria Empresarial Ltda, its affiliated companies, and/or its officers, directors, or
shareholders, may from time to time have long or short positions in the financial instruments of the companies
mentioned in this document, engage in securities transactions in a manner inconsistent with this report, buy or sell from
customers on a principal basis, or serve in an advisory capacity.

Investing in non-US securities, including ADRs, may entail certain risks. The securities of non-US issuers may not be
registered with, and may not be subject to the reporting requirements of the US Securities and Exchange Commission.
There may be limited information available on foreign securities. Foreign companies are generally not subject to
uniform audit and reporting standards, practices and requirements comparable to those in the US Securities of some
foreign companies may be less liquid and their prices more volatile than securities of comparable US companies. In
addition, exchange rate movements may have an adverse effect on the value of an investment in a foreign stock and its
corresponding dividend payment for US investors.

The information contained in the report is privileged and confidential and intended solely for the recipients who have
been specifically authorized to receive it and it may not be further distributed. Bulltick Brasil Consultoria e Assessoria
Empresarial Ltda and its affiliates accept no liability whatsoever for the actions of third parties. Should you receive this
message by mistake you are hereby notified that any disclosure reproduction, distribution, or use of this message is
strictly prohibited.

The Report may provide the addresses of, or contain hyperlinks to, websites. Except to the extent to which the Report
refers to the website material of the Bulltick Brasil Consultoria e Assessoria Empresarial Ltda or any of its affiliates, the
Firm has not reviewed the linked site. Equally, except to the extent to which the Report refers to website material of
Bulltick Brasil Consultoria e Assessoria Empresarial Ltda or any of its affiliates, the Firm takes no responsibility for, and
makes no representation or warranties whatsoever as to, the data and information contained therein. Such address or
hyperlink (including addresses or hyperlinks to website material of Bulltick Brasil Consultoria e Assessoria Empresarial
Ltda or any of its affiliates) is provided solely for your convenience and information and the content of the linked site
does not in any way form part of this document. Accessing such website or following such link through the Report or
the website of Bulltick Brasil Consultoria e Assessoria Empresarial Ltda or any of its affiliates shall be at your own risk
and Bulltick Brasil Consultoria e Assessoria Empresarial Ltda or any of its affiliates shall have no liability arising out of,
or in connection with, and such referenced website.


                                                                                                                             18

Weitere ähnliche Inhalte

Was ist angesagt?

Indiabulls Zee Ent 15 May09
Indiabulls Zee Ent 15 May09Indiabulls Zee Ent 15 May09
Indiabulls Zee Ent 15 May09Harsh Arun
 
Singland Fy08 130209
Singland Fy08 130209Singland Fy08 130209
Singland Fy08 130209Gan Chuan
 
PVR-Management Meet Note
PVR-Management Meet NotePVR-Management Meet Note
PVR-Management Meet NoteAngel Broking
 
Keynote capitals india morning note 7 december-12
Keynote capitals india morning note 7 december-12Keynote capitals india morning note 7 december-12
Keynote capitals india morning note 7 december-12Keynote Capitals Ltd.
 
111103 investor presentation full
111103   investor presentation full111103   investor presentation full
111103 investor presentation fullMultiplus
 
Investor Presentation - October 2011
Investor Presentation - October 2011Investor Presentation - October 2011
Investor Presentation - October 2011Multiplus
 
120815 investor presentation full
120815   investor presentation full120815   investor presentation full
120815 investor presentation fullMultiplus
 
AGCO 2006AR_spd
AGCO 2006AR_spdAGCO 2006AR_spd
AGCO 2006AR_spdfinance33
 
AutoSuccess Jul06
AutoSuccess Jul06AutoSuccess Jul06
AutoSuccess Jul06autosuccess
 
Presentation Jbs S.A. January 2010
Presentation Jbs S.A.   January 2010Presentation Jbs S.A.   January 2010
Presentation Jbs S.A. January 2010JBS RI
 

Was ist angesagt? (10)

Indiabulls Zee Ent 15 May09
Indiabulls Zee Ent 15 May09Indiabulls Zee Ent 15 May09
Indiabulls Zee Ent 15 May09
 
Singland Fy08 130209
Singland Fy08 130209Singland Fy08 130209
Singland Fy08 130209
 
PVR-Management Meet Note
PVR-Management Meet NotePVR-Management Meet Note
PVR-Management Meet Note
 
Keynote capitals india morning note 7 december-12
Keynote capitals india morning note 7 december-12Keynote capitals india morning note 7 december-12
Keynote capitals india morning note 7 december-12
 
111103 investor presentation full
111103   investor presentation full111103   investor presentation full
111103 investor presentation full
 
Investor Presentation - October 2011
Investor Presentation - October 2011Investor Presentation - October 2011
Investor Presentation - October 2011
 
120815 investor presentation full
120815   investor presentation full120815   investor presentation full
120815 investor presentation full
 
AGCO 2006AR_spd
AGCO 2006AR_spdAGCO 2006AR_spd
AGCO 2006AR_spd
 
AutoSuccess Jul06
AutoSuccess Jul06AutoSuccess Jul06
AutoSuccess Jul06
 
Presentation Jbs S.A. January 2010
Presentation Jbs S.A.   January 2010Presentation Jbs S.A.   January 2010
Presentation Jbs S.A. January 2010
 

Andere mochten auch

асетаскарбеков+ продажа фастфудов+предприниматели
асетаскарбеков+ продажа фастфудов+предпринимателиасетаскарбеков+ продажа фастфудов+предприниматели
асетаскарбеков+ продажа фастфудов+предпринимателиAsetAskarbekov
 
''SinR, the Master Regulator of Biofilm Regulator'' Presentation by KATE, Wis...
''SinR, the Master Regulator of Biofilm Regulator'' Presentation by KATE, Wis...''SinR, the Master Regulator of Biofilm Regulator'' Presentation by KATE, Wis...
''SinR, the Master Regulator of Biofilm Regulator'' Presentation by KATE, Wis...Wisdom Deebeke Kate
 
Potabilizador de agua
Potabilizador de aguaPotabilizador de agua
Potabilizador de aguaAndre Duque R
 
Mexico Road Show
Mexico Road ShowMexico Road Show
Mexico Road Showrpinho
 
асетаскарбеков+ продажа фастфудов+предприниматели
асетаскарбеков+ продажа фастфудов+предпринимателиасетаскарбеков+ продажа фастфудов+предприниматели
асетаскарбеков+ продажа фастфудов+предпринимателиAsetAskarbekov
 
wall beds - THE PRESENTATION
wall beds - THE PRESENTATIONwall beds - THE PRESENTATION
wall beds - THE PRESENTATIONRatna Sharma
 
Jet engine thermodynamics
Jet engine thermodynamicsJet engine thermodynamics
Jet engine thermodynamicsAdnan Aslam
 
Turbofan engine
Turbofan engineTurbofan engine
Turbofan engineShambu S
 

Andere mochten auch (11)

асетаскарбеков+ продажа фастфудов+предприниматели
асетаскарбеков+ продажа фастфудов+предпринимателиасетаскарбеков+ продажа фастфудов+предприниматели
асетаскарбеков+ продажа фастфудов+предприниматели
 
''SinR, the Master Regulator of Biofilm Regulator'' Presentation by KATE, Wis...
''SinR, the Master Regulator of Biofilm Regulator'' Presentation by KATE, Wis...''SinR, the Master Regulator of Biofilm Regulator'' Presentation by KATE, Wis...
''SinR, the Master Regulator of Biofilm Regulator'' Presentation by KATE, Wis...
 
Synopsis
SynopsisSynopsis
Synopsis
 
Potabilizador de agua
Potabilizador de aguaPotabilizador de agua
Potabilizador de agua
 
Mexico Road Show
Mexico Road ShowMexico Road Show
Mexico Road Show
 
асетаскарбеков+ продажа фастфудов+предприниматели
асетаскарбеков+ продажа фастфудов+предпринимателиасетаскарбеков+ продажа фастфудов+предприниматели
асетаскарбеков+ продажа фастфудов+предприниматели
 
Team Leadership
Team LeadershipTeam Leadership
Team Leadership
 
wall beds - THE PRESENTATION
wall beds - THE PRESENTATIONwall beds - THE PRESENTATION
wall beds - THE PRESENTATION
 
Turbojets
TurbojetsTurbojets
Turbojets
 
Jet engine thermodynamics
Jet engine thermodynamicsJet engine thermodynamics
Jet engine thermodynamics
 
Turbofan engine
Turbofan engineTurbofan engine
Turbofan engine
 

Kürzlich hochgeladen

Russian Call Girls In Gurgaon ❤️8448577510 ⊹Best Escorts Service In 24/7 Delh...
Russian Call Girls In Gurgaon ❤️8448577510 ⊹Best Escorts Service In 24/7 Delh...Russian Call Girls In Gurgaon ❤️8448577510 ⊹Best Escorts Service In 24/7 Delh...
Russian Call Girls In Gurgaon ❤️8448577510 ⊹Best Escorts Service In 24/7 Delh...lizamodels9
 
Enhancing and Restoring Safety & Quality Cultures - Dave Litwiller - May 2024...
Enhancing and Restoring Safety & Quality Cultures - Dave Litwiller - May 2024...Enhancing and Restoring Safety & Quality Cultures - Dave Litwiller - May 2024...
Enhancing and Restoring Safety & Quality Cultures - Dave Litwiller - May 2024...Dave Litwiller
 
Mondelez State of Snacking and Future Trends 2023
Mondelez State of Snacking and Future Trends 2023Mondelez State of Snacking and Future Trends 2023
Mondelez State of Snacking and Future Trends 2023Neil Kimberley
 
Mysore Call Girls 8617370543 WhatsApp Number 24x7 Best Services
Mysore Call Girls 8617370543 WhatsApp Number 24x7 Best ServicesMysore Call Girls 8617370543 WhatsApp Number 24x7 Best Services
Mysore Call Girls 8617370543 WhatsApp Number 24x7 Best ServicesDipal Arora
 
Monthly Social Media Update April 2024 pptx.pptx
Monthly Social Media Update April 2024 pptx.pptxMonthly Social Media Update April 2024 pptx.pptx
Monthly Social Media Update April 2024 pptx.pptxAndy Lambert
 
The Path to Product Excellence: Avoiding Common Pitfalls and Enhancing Commun...
The Path to Product Excellence: Avoiding Common Pitfalls and Enhancing Commun...The Path to Product Excellence: Avoiding Common Pitfalls and Enhancing Commun...
The Path to Product Excellence: Avoiding Common Pitfalls and Enhancing Commun...Aggregage
 
Call Girls Jp Nagar Just Call 👗 7737669865 👗 Top Class Call Girl Service Bang...
Call Girls Jp Nagar Just Call 👗 7737669865 👗 Top Class Call Girl Service Bang...Call Girls Jp Nagar Just Call 👗 7737669865 👗 Top Class Call Girl Service Bang...
Call Girls Jp Nagar Just Call 👗 7737669865 👗 Top Class Call Girl Service Bang...amitlee9823
 
It will be International Nurses' Day on 12 May
It will be International Nurses' Day on 12 MayIt will be International Nurses' Day on 12 May
It will be International Nurses' Day on 12 MayNZSG
 
Famous Olympic Siblings from the 21st Century
Famous Olympic Siblings from the 21st CenturyFamous Olympic Siblings from the 21st Century
Famous Olympic Siblings from the 21st Centuryrwgiffor
 
M.C Lodges -- Guest House in Jhang.
M.C Lodges --  Guest House in Jhang.M.C Lodges --  Guest House in Jhang.
M.C Lodges -- Guest House in Jhang.Aaiza Hassan
 
HONOR Veterans Event Keynote by Michael Hawkins
HONOR Veterans Event Keynote by Michael HawkinsHONOR Veterans Event Keynote by Michael Hawkins
HONOR Veterans Event Keynote by Michael HawkinsMichael W. Hawkins
 
Grateful 7 speech thanking everyone that has helped.pdf
Grateful 7 speech thanking everyone that has helped.pdfGrateful 7 speech thanking everyone that has helped.pdf
Grateful 7 speech thanking everyone that has helped.pdfPaul Menig
 
Regression analysis: Simple Linear Regression Multiple Linear Regression
Regression analysis:  Simple Linear Regression Multiple Linear RegressionRegression analysis:  Simple Linear Regression Multiple Linear Regression
Regression analysis: Simple Linear Regression Multiple Linear RegressionRavindra Nath Shukla
 
Call Girls Pune Just Call 9907093804 Top Class Call Girl Service Available
Call Girls Pune Just Call 9907093804 Top Class Call Girl Service AvailableCall Girls Pune Just Call 9907093804 Top Class Call Girl Service Available
Call Girls Pune Just Call 9907093804 Top Class Call Girl Service AvailableDipal Arora
 
Boost the utilization of your HCL environment by reevaluating use cases and f...
Boost the utilization of your HCL environment by reevaluating use cases and f...Boost the utilization of your HCL environment by reevaluating use cases and f...
Boost the utilization of your HCL environment by reevaluating use cases and f...Roland Driesen
 
A DAY IN THE LIFE OF A SALESMAN / WOMAN
A DAY IN THE LIFE OF A  SALESMAN / WOMANA DAY IN THE LIFE OF A  SALESMAN / WOMAN
A DAY IN THE LIFE OF A SALESMAN / WOMANIlamathiKannappan
 
Call Girls Hebbal Just Call 👗 7737669865 👗 Top Class Call Girl Service Bangalore
Call Girls Hebbal Just Call 👗 7737669865 👗 Top Class Call Girl Service BangaloreCall Girls Hebbal Just Call 👗 7737669865 👗 Top Class Call Girl Service Bangalore
Call Girls Hebbal Just Call 👗 7737669865 👗 Top Class Call Girl Service Bangaloreamitlee9823
 

Kürzlich hochgeladen (20)

Russian Call Girls In Gurgaon ❤️8448577510 ⊹Best Escorts Service In 24/7 Delh...
Russian Call Girls In Gurgaon ❤️8448577510 ⊹Best Escorts Service In 24/7 Delh...Russian Call Girls In Gurgaon ❤️8448577510 ⊹Best Escorts Service In 24/7 Delh...
Russian Call Girls In Gurgaon ❤️8448577510 ⊹Best Escorts Service In 24/7 Delh...
 
Enhancing and Restoring Safety & Quality Cultures - Dave Litwiller - May 2024...
Enhancing and Restoring Safety & Quality Cultures - Dave Litwiller - May 2024...Enhancing and Restoring Safety & Quality Cultures - Dave Litwiller - May 2024...
Enhancing and Restoring Safety & Quality Cultures - Dave Litwiller - May 2024...
 
Mifty kit IN Salmiya (+918133066128) Abortion pills IN Salmiyah Cytotec pills
Mifty kit IN Salmiya (+918133066128) Abortion pills IN Salmiyah Cytotec pillsMifty kit IN Salmiya (+918133066128) Abortion pills IN Salmiyah Cytotec pills
Mifty kit IN Salmiya (+918133066128) Abortion pills IN Salmiyah Cytotec pills
 
Mondelez State of Snacking and Future Trends 2023
Mondelez State of Snacking and Future Trends 2023Mondelez State of Snacking and Future Trends 2023
Mondelez State of Snacking and Future Trends 2023
 
Mysore Call Girls 8617370543 WhatsApp Number 24x7 Best Services
Mysore Call Girls 8617370543 WhatsApp Number 24x7 Best ServicesMysore Call Girls 8617370543 WhatsApp Number 24x7 Best Services
Mysore Call Girls 8617370543 WhatsApp Number 24x7 Best Services
 
Monthly Social Media Update April 2024 pptx.pptx
Monthly Social Media Update April 2024 pptx.pptxMonthly Social Media Update April 2024 pptx.pptx
Monthly Social Media Update April 2024 pptx.pptx
 
The Path to Product Excellence: Avoiding Common Pitfalls and Enhancing Commun...
The Path to Product Excellence: Avoiding Common Pitfalls and Enhancing Commun...The Path to Product Excellence: Avoiding Common Pitfalls and Enhancing Commun...
The Path to Product Excellence: Avoiding Common Pitfalls and Enhancing Commun...
 
Call Girls Jp Nagar Just Call 👗 7737669865 👗 Top Class Call Girl Service Bang...
Call Girls Jp Nagar Just Call 👗 7737669865 👗 Top Class Call Girl Service Bang...Call Girls Jp Nagar Just Call 👗 7737669865 👗 Top Class Call Girl Service Bang...
Call Girls Jp Nagar Just Call 👗 7737669865 👗 Top Class Call Girl Service Bang...
 
It will be International Nurses' Day on 12 May
It will be International Nurses' Day on 12 MayIt will be International Nurses' Day on 12 May
It will be International Nurses' Day on 12 May
 
Famous Olympic Siblings from the 21st Century
Famous Olympic Siblings from the 21st CenturyFamous Olympic Siblings from the 21st Century
Famous Olympic Siblings from the 21st Century
 
M.C Lodges -- Guest House in Jhang.
M.C Lodges --  Guest House in Jhang.M.C Lodges --  Guest House in Jhang.
M.C Lodges -- Guest House in Jhang.
 
VVVIP Call Girls In Greater Kailash ➡️ Delhi ➡️ 9999965857 🚀 No Advance 24HRS...
VVVIP Call Girls In Greater Kailash ➡️ Delhi ➡️ 9999965857 🚀 No Advance 24HRS...VVVIP Call Girls In Greater Kailash ➡️ Delhi ➡️ 9999965857 🚀 No Advance 24HRS...
VVVIP Call Girls In Greater Kailash ➡️ Delhi ➡️ 9999965857 🚀 No Advance 24HRS...
 
HONOR Veterans Event Keynote by Michael Hawkins
HONOR Veterans Event Keynote by Michael HawkinsHONOR Veterans Event Keynote by Michael Hawkins
HONOR Veterans Event Keynote by Michael Hawkins
 
Grateful 7 speech thanking everyone that has helped.pdf
Grateful 7 speech thanking everyone that has helped.pdfGrateful 7 speech thanking everyone that has helped.pdf
Grateful 7 speech thanking everyone that has helped.pdf
 
Forklift Operations: Safety through Cartoons
Forklift Operations: Safety through CartoonsForklift Operations: Safety through Cartoons
Forklift Operations: Safety through Cartoons
 
Regression analysis: Simple Linear Regression Multiple Linear Regression
Regression analysis:  Simple Linear Regression Multiple Linear RegressionRegression analysis:  Simple Linear Regression Multiple Linear Regression
Regression analysis: Simple Linear Regression Multiple Linear Regression
 
Call Girls Pune Just Call 9907093804 Top Class Call Girl Service Available
Call Girls Pune Just Call 9907093804 Top Class Call Girl Service AvailableCall Girls Pune Just Call 9907093804 Top Class Call Girl Service Available
Call Girls Pune Just Call 9907093804 Top Class Call Girl Service Available
 
Boost the utilization of your HCL environment by reevaluating use cases and f...
Boost the utilization of your HCL environment by reevaluating use cases and f...Boost the utilization of your HCL environment by reevaluating use cases and f...
Boost the utilization of your HCL environment by reevaluating use cases and f...
 
A DAY IN THE LIFE OF A SALESMAN / WOMAN
A DAY IN THE LIFE OF A  SALESMAN / WOMANA DAY IN THE LIFE OF A  SALESMAN / WOMAN
A DAY IN THE LIFE OF A SALESMAN / WOMAN
 
Call Girls Hebbal Just Call 👗 7737669865 👗 Top Class Call Girl Service Bangalore
Call Girls Hebbal Just Call 👗 7737669865 👗 Top Class Call Girl Service BangaloreCall Girls Hebbal Just Call 👗 7737669865 👗 Top Class Call Girl Service Bangalore
Call Girls Hebbal Just Call 👗 7737669865 👗 Top Class Call Girl Service Bangalore
 

Working Capital Management is King

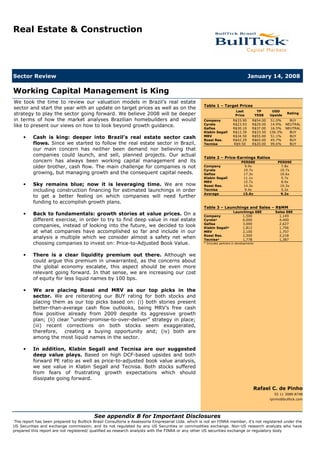
  • 1. Real Estate & Construction Sector Review January 14, 2008 Working Capital Management is King We took the time to review our valuation models in Brazil’s real estate Table 1 – Target Prices sector and start the year with an update on target prices as well as on the Last TP USD strategy to play the sector going forward. We believe 2008 will be deeper Rating Price YE08 Upside in terms of how the market analyses Brazilian homebuilders and would R$33.90 R$54.00 51.0% BUY Company R$23.93 R$29.00 14.9% NEUTRAL Cyrela like to present our views on how to look beyond growth guidance. R$30.10 R$37.00 16.5% NEUTRAL Gafisa R$12.39 R$33.50 156.3% BUY Klabin Segall R$34.50 R$55.00 51.1% BUY MRV Cash is king: deeper into Brazil’s real estate sector cash • R$42.29 R$65.00 45.7% BUY Rossi Res. flows. Since we started to follow the real estate sector in Brazil, R$9.50 R$20.00 99.6% BUY Tecnisa our main concern has neither been demand nor believing that companies could launch, and sell, planned projects. Our actual Table 2 – Price-Earnings Ratios concern has always been working capital management and its PER08E PER09E older brother, cash flow. The main challenge for companies is not 9.9x 7.8x Company 19.7x 10.7x Cyrela growing, but managing growth and the consequent capital needs. 17.3x 10.6x Gafisa 11.1x 5.7x Klabin Segall 15.7x 8.9x MRV Sky remains blue; now it is leveraging time. We are now • 14.3x 10.3x Rossi Res. including construction financing for estimated launchings in order 9.4x 5.2x Tecnisa Average 15.6x 9.2x to get a better feeling on which companies will need further funding to accomplish growth plans. Table 3 – Launchings and Sales – R$MM Launchings 08E Sales 08E Back to fundamentals: growth stories at value prices. On a • 1,500 1,149 Company different exercise, in order to try to find deep value in real estate 6,000 4,400 Cyrela* 3,000 2,627 Gafisa companies, instead of looking into the future, we decided to look 1,812 1,706 Klabin Segall* at what companies have accomplished so far and include in our 2,100 1,707 MRV 2,500 2,218 Rossi Res. analysis a multiple which we consider almost a safety net when 1,778 1,387 Tecnisa* choosing companies to invest on: Price-to-Adjusted Book Value. * Includes partners in developments There is a clear liquidity premium out there. Although we • could argue this premium in unwarranted, as the concerns about the global economy escalate, this aspect should be even more relevant going forward. In that sense, we are increasing our cost of equity for less liquid names by 100 bps. We are placing Rossi and MRV as our top picks in the • sector. We are reiterating our BUY rating for both stocks and placing them as our top picks based on: (i) both stories present better-than-average cash flow outlooks, being MRV’s free cash flow positive already from 2009 despite its aggressive growth plan; (ii) clear “under-promise-to-over-deliver” strategy in place; (iii) recent corrections on both stocks seem exaggerated, therefore, creating a buying opportunity and; (iv) both are among the most liquid names in the sector. In addition, Klabin Segall and Tecnisa are our suggested • deep value plays. Based on high DCF-based upsides and both forward PE ratio as well as price-to-adjusted book value analysis, we see value in Klabin Segall and Tecnisa. Both stocks suffered from fears of frustrating growth expectations which should dissipate going forward. Rafael C. de Pinho 55 11 3089-8748 rpinho@bulltick.com See appendix B for Important Disclosures This report has been prepared by Bulltick Brasil Consultoria e Assessoria Empresarial Ltda. which is not an FINRA member, it’s not registered under the US Securities and exchange commission, and its not regulated by any US Securities or commodities exchange. Non-US research analysts who have prepared this report are not registered/ qualified as research analysts with the FINRA or any other US securities exchange or regulatory body
  • 2. Cash is king: deeper into Brazil’s real estate sector cash flows Since we started to follow the real estate sector in Brazil, our main concern has neither Our main concern regarding been demand nor believing that companies could launch, and sell, planned projects. Our the real estate sector has always been working capital actual concern has always been working capital management and its older brother, cash management. flow. The main challenge for companies is not growing, but managing growth and the consequent capital needs. As shown on Exhibit 1, typical working capital exposure to an average project should hover between 20-30% of a project’s potential sales value (PSV). This is only possible due to the use of construction financing, which allows companies to finance on average 70% of the cost of the building. So far, the return on newly developed projects has been quite high on an IRR or NPV perspective. However, this return is only assured by the project delivery, which is tied to managing correctly the cash flow. Exhibit 1: Typical project cash exposure with SFH financing Considering construction Potential Sales Value (PSV) 100,000 financing, typical cash flow Gross Margin 40% exposure should hover Total Cost (60,000) between 20-30% of a project’s PSV. Land Cost (15% of PSV) (A) (15,000) Building Costs (45,000) SFH Financing = 70% of Building Costs 31,500 Building Cash Exposure (B) (13,500) Total Cash Exposure (A) + (B) (28,500) Source: Bulltick Our cash flow exposure exercise depends on the companies being able to get financing to reduce their own cash exposure to projects. A substantial stake of the capital Brazilian banks are obliged to invest in real estate projects goes in the form of construction financing. On Exhibit 2, we show the difference between a typical project cash flow leveraged by construction financing and another one without the line. Exhibit 2: Typical project cash flows, SFH financing impact 45% Cash Exposure as % of PSV 30% 15% 0% 1Q 2Q 3Q 4Q 5Q 6Q 7Q 8Q 9Q 10Q 11Q 12Q -15% -30% -45% -60% With SFH leverage Without SFH leverage Source: Bulltick Until now, the outlook for the Brazilian macroeconomic scenario suggests that the growth As we assume the growth cycle for homebuilders is cycle for homebuilders is sustainable. This opinion seems to be shared by the companies sustainable, we included in the sector: the average growth in launchings estimates by company managements is construction financing in around 30% per year for the 2009-07 period. our models… 2
  • 3. Given this scenario, we have decided to include in our models the construction financing …allowing us to better evaluate those companies in for projects within the SFH scope in order to better evaluate those companies in which which extra funding should extra cash will be needed to meet guidance going forward. If the financing conditions for be needed, given current real estate projects are unchanged, some of these companies may attempt to raise cash market conditions. either through debt or equity issues. In the case of equity issues, the potential EPS dilution for shareholders is a concern. Exhibit 3: Free cash flow-to-equity, 2008-2012 Cash Position Free Cash Flows-to-Equity Company (R$ MM) 2008 2009 2010 2011 2012 Cyrela 800 (68) (1,225) (2,174) (2,678) 843 Tecnisa 156 (237) (419) (420) (237) 319 Klabin Segall* 238 37 (209) (222) 83 195 Rossi Residencial 377 (221) 74 (88) (161) 210 Company 128 (196) (379) (231) (234) 4 MRV 882 (164) 69 345 565 720 Gafisa 372 (447) (264) 309 327 410 Source: Bulltick * Cash adjusted for recently issued debentures Back to fundamentals: growth stories at value prices On a different exercise, in order to try to find deep value in real estate companies, We included Price-to- instead of looking into the future, we decided to look at what companies have Adjusted Book Value accomplished so far and include in our analysis a multiple which we consider almost a multiples to our analysis in safety net when choosing companies to invest on: Price-to-Adjusted Book Value. order to find deep value plays. As the accounting for homebuilders does not help much our analysis, distorting financial statements, especially given the high growth experienced over the last 2 years, we have decided to make a simple adjustment to reported book value for the companies: we added the backlog profits. The recognition of such profits is dependable only on building and delivery. At this point, we think it is fair to assume sold apartments will be delivered. Below, we present a table including the price-to-adjusted book value multiples for companies under our coverage. Exhibit 4: Adjusted price-to-book values R$ Millions, unless noted Company Cyrela Gafisa Klabin MRV Rossi Tecnisa Average/Sum Market Cap 1,221 8,511 3,867 731 4,666 3,335 1,381 23,710 3Q07 Reported Book Value 328 1,994 1,493 400 1,339 1,177 735 7,466 Price / Book 3.73x 4.27x 2.59x 1.83x 3.49x 2.83x 1.88x 3.18x Premium / Discount to Average 17.3% 34.4% -18.5% -42.5% 9.7% -10.8% -40.8% Backlog Revenues to recognize 337 2,099 1,209 386 327 853 150 5,361 Cost to recognize (206) (1,202) (744) (257) (145) (546) (92) (3,192) Gross Profit to recognize 131 897 466 128 181 307 58 2,169 Net Profits to recognize 101 698 356 89 144 247 46 1,680 428 2,692 1,850 489 1,483 1,424 781 9,146 Adjusted Book Value - Backlog Profits Price / Adj. Book Value 2.85x 3.16x 2.09x 1.50x 3.15x 2.34x 1.77x 2.59x Source: Bulltick As with PE ratios, Price-to-Book value analysis in real estate also shows some inconsistency. First, we assume that the average project return between different companies is similar. In addition, we remind investors that entry barriers in real estate are relatively low, thus, exaggerated premiums are not sustainable in the long run, even when a liquidity premium/discount is considered. For investors looking to buy value in the sector, departing from price-to-adjusted book Departing from this simple value, companies like Klabin Segall and Tecnisa call our attention, especially when this metric, Klabin Segall and analysis is coupled with SFH financing analysis and with forward PE multiples. Tecnisa call our attention. 3
  • 4. Exhibit 5: Price-to-Earnings 2009E 12.0x Even when considering a 10.7x 10.6x liquidity premium/discount, 10.3x if the average project return 10.0x 9.2x is similar and entry barriers 8.9x are inexistent, a 105% gap between the extremes in 7.8x 8.0x our PER09E multiples range seem exaggerated to us. 5.7x 6.0x 5.2x 4.0x Tecnisa Klabin Company MRV Average Rossi Gafisa Cyrela Source: Bulltick Exhibit 6: PE-to-growth multiples – 2009E 0.30x 0.26x 0.25x 0.25x 0.22x 0.20x 0.15x 0.14x 0.15x 0.10x 0.07x 0.06x 0.05x 0.05x 0.00x Tecnisa Klabin MRV Gafisa Company Rossi Average Cyrela Source: Bulltick 4
  • 5. Company Outlooks Rossi Residencial: TP-YE08 R$65.00, 45.7% upside potential in USD As a consequence of one of the best cash flow outlooks going forward, we are placing Rossi among our top picks in the sector, being the company our preferred name among the most liquid stocks in the sector. We are raising our TP to R$65.00 from R$59.00 on the back of higher launching estimates, to which working capital needs are almost completely funded by construction financing. The stock’s recent 13% correction, which we perceive as linked to fears of an upcoming follow-on offer by Rossi after Cyrela’s equity issue announcement, was unjustified. However, should such a deal come up, investors should note the proceeds will probably be invested in new projects, thus, with expectation to create value. We currently see Rossi trading at a 10.3x PER09E vs. our average of 9.2x for the sector. On top of being one of the most liquid names in the sector, and having a proven track record as well as fair future cash flow outlook, we believe the stock deserves some premium to both Cyrela and Gafisa. Exhibit 7: Rossi’s Main Figures Rossi Res. (R$ MM) 2006 2007E 2008E 2009E 2010E 2011E 2012E Launchings 882 1,981 2,500 3,000 3,360 3,696 3,844 - Real Estate Sales 584 1,284 2,218 2,571 3,096 3,466 3,704 Net Revenues 411 701 1,380 1,998 2,565 3,075 3,474 Adj. EBITDA 61 137 297 464 626 753 851 Adj. Net income 54 137 233 325 424 520 598 Gross Margin 31.2% 35.3% 35.5% 35.6% 34.8% 34.3% 34.0% Adj. EBITDA Margin 12.4% 19.6% 21.5% 23.2% 24.4% 24.5% 24.5% Adj. Net Margin 10.6% 19.6% 16.9% 16.3% 16.5% 16.9% 17.2% PER 62.0x 24.3x 14.3x 10.3x 7.9x 6.4x 5.6x FV/EBITDA 51.3x 25.5x 13.6x 10.2x 8.2x 7.2x 6.5x Adjusted for IPO costs Source: Rossi Residencial and Bulltick MRV: TP-YE08 R$55.00, 51.1% upside potential in USD We are also placing MRV among our top picks in the sector on the back of an interesting growth-adjusted valuation and, in our view, an attractive entry point created recently by the 20% drop in stock price since early December. We disagree with the criticisms out on the street about the company’s aggressive growth plans. As MRV benefits from the use of special credit lines targeted to low-income developers by Caixa Economica, the company enjoys a comfortable cash flow position going forward. MRV shares currently trade at a 8.9x PER09E, a 7% discount over the first-tier group composed by Rossi, Cyrela and Gafisa. On a growth-adjusted basis, MRV trades at PE09- to-growth of 0.07x versus an average of 0.25x for Brazilian homebuilders. We reiterate our positive view on the company and on the quality of its management, which has potential to surprise the market going forward not only by over-delivering results but also due to its search for innovative credit solutions to its clients. For example, 5
  • 6. MRV recently led the pack in signing a MOU with Caixa Economica in order to gain scale in low-income credit approval and grant financing for 12,000 units in 2008, a move quickly followed by its competitors. Main changes to our model were the inclusion of the revised launching estimates for 2008 and 2009 and modeling of the SFH financing. Besides, as this report was being written, we had to stop the press in order to account for the fact that the company beat its 2007 estimates. Our DCF-model points to a Dec 08 TP of R$55.00/share, implying a 51.1% potential upside in USD and therefore a BUY rating for the stock. Exhibit 8: MRV’s main figures MRV (R$ MM) 2006 2007E 2008E 2009E 2010E 2011E 2012E Launchings 337 1,200 2,100 2,520 2,898 3,130 3,318 - Real Estate Sales 206 717 1,707 2,298 2,705 3,001 3,220 Net Revenues 140 399 1,046 1,811 2,371 2,745 3,019 Adj. EBITDA 22 100 291 579 762 886 960 Adj. Net income 17 114 297 523 685 792 855 Gross Margin 35% 40% 43% 43% 42% 41% 40% Adj. EBITDA Margin 16% 25% 28% 32% 32% 32% 32% Adj. Net Margin 12% 29% 28% 29% 29% 29% 28% PER 274.2x 87.7x 15.7x 8.9x 6.8x 5.9x 5.5x FV/EBITDA 209.8x 102.3x 16.3x 8.2x 6.3x 5.5x 5.1x Adjusted for IPO costs Source: MRV and Bulltick Cyrela: TP-YE08 R$30.00, 14.9% upside potential in USD After incorporating the most recent launchings guidance and including the SFH leverage into our model, we are increasing our YE08 TP to R$29.00/share from R$26.00/share and downgrading Cyrela to NEUTRAL from BUY. At this point we prefer to take a more cautious stance concerning Cyrela, based on our estimates for the company’s cash flow for the coming years. Despite having a substantial amount of receivables, which could offset its funding needs, our analysis suggests that the company should direct most of the resources from recently announced debt and equity issues to comply with the working capital needs for the intended R$13.5 billion in launchings over 2008 and 2009. Besides the working capital management factor, the overhang created by the new equity issue announcement, the third since September 2005, reinforce our view. We see Cyrela shares, currently trading at 10.7x PER09E, at premium to both Rossi and Gafisa. However, at this point we believe Rossi deserves a premium over Cyrela as it is in better shape to face its working capital needs going forward. 6
  • 7. Exhibit 9: Cyrela’s Main Figures Cyrela (R$MM) 2006 2007E 2008E 2009E 2010E 2011E 2012E Launchings 3,618 4,600 6,000 7,500 8,400 9,240 9,610 - Real Estate Sales 2,247 3,400 4,400 6,053 7,424 8,382 9,097 Net Revenues 1,064 1,561 2,040 3,727 5,430 6,905 8,146 Adj. EBITDA 196 403 539 1,075 1,582 1,998 2,351 Adj. Net Income 190 330 431 796 1,220 1,589 1,856 Gross Margin 39.4% 42.1% 42.8% 42.5% 41.8% 41.1% 40.8% Adj. EBITDA Margin 18.4% 25.8% 26.4% 28.8% 29.1% 28.9% 28.9% Adj. Net Margin 17.8% 21.1% 21.1% 21.4% 22.5% 23.0% 22.8% PER 44.8x 19.3x 19.7x 10.7x 7.0x 5.4x 4.6x FV/EBITDA 41.2x 21.0x 17.0x 9.5x 6.5x 5.3x 4.5x Adjusted for non-recurring gains Source: Cyrela and Bulltick Gafisa: TP-YE08 R$37.00, 16.5% upside potential in USD Our revised TP of R$37.00/share for Gafisa, up 12% from our previous TP of R$33.00/share, is a result of increased launchings guidance and fine tuning to our model. Nonetheless, we are downgrading Gafisa shares to NEUTRAL from BUY on the back of the same conservative stance we applied to Cyrela. Our analysis indicates Gafisa should need between R$350-R$450 million in additional funding, besides leveraging through SFH construction financing, to provide for its working capital needs. Additionally, we are still waiting to see concrete results arising from the company’s new business lines Fit and Bairro Novo, added to Alphaville’s acquisition. We currently see Gafisa stocks trading at a 10.6x PER09E, 15% above the average of the companies under our coverage. Exhibit 10: Gafisa’s Main Figures Gafisa (R$MM) 2006 2007E 2008E 2009E 2010E 2011E 2012E Launchings 1,005 1,900 3,000 3,360 3,695 3,846 3,999 - Real Estate Sales 995 1,625 2,627 3,086 3,505 3,729 3,908 Net Revenues 664 1,124 1,565 2,201 2,912 3,346 3,651 Adj. EBITDA 98 175 279 493 678 780 834 Adj. Net Income 76 122 225 368 495 575 613 Gross Margin 29.8% 30.4% 31.5% 32.3% 32.1% 31.7% 31.1% Adj. EBITDA Margin 14.8% 15.6% 17.8% 22.4% 23.3% 23.3% 22.8% Adj. Net Margin 11.4% 10.9% 14.4% 16.7% 17.0% 17.2% 16.8% PER 84.3x 42.2x 17.3x 10.6x 7.8x 6.7x 6.3x FV/EBITDA 57.3x 27.4x 15.6x 9.8x 7.4x 6.6x 6.3x Adjusted for IPO costs Source: Gafisa and Bulltick 7
  • 8. Tecnisa: TP-YE08 R$20.00, 96.5% upside potential in USD Tecnisa stocks continue to be among the most discounted within our coverage universe. Against the market, the company was able to deliver 2007 launchings. This piece of news came out at the very end of the year and we believe it was overlooked by most of the market. The fact was also overshadowed by the pessimistic sentiment that has recently pushed market indices downward. As to the changes to our model, besides modeling of SFH construction financing, we incorporated the latest launchings guidance provided by the company. We also raised our discount rates to reflect the stock’s lower liquidity. Despite the higher discount rate, we still see the shares trading at a 52% discount to our Dec 08 target price of R$20.00/share. As described above, investing in Tecnisa is also attractive if we think in terms of P/ Adjusted Book Value ratio, trading at 1.77x vs. an average of 2.59x for the companies under our coverage. It is also important to mention that the company has a substantial amount of receivables which could help to cover the company’s capital needs. Therefore, we are maintaining our BUY rating for the stocks. Exhibit 11: Tecnisa’s Main Figures Tecnisa (R$ MM) 2006 2007E 2008E 2009E 2010E 2011E 2012E Launchings 369 1,364 1,778 2,235 2,504 2,601 2,705 - Real Estate Sales 333 706 1,387 1,877 2,270 2,476 2,618 Net Revenues 203 364 740 1,430 1,942 2,304 2,518 Adj. EBITDA 47 80 199 418 572 678 753 Adj. Net Income 36 88 146 265 380 491 546 Gross Margin 40.0% 38.6% 39.3% 39.0% 38.5% 38.2% 38.0% Adj. EBITDA Margin 23.1% 11.0% 26.9% 29.2% 29.4% 29.4% 29.9% Adj. Net Margin 17.6% 13.2% 19.8% 18.5% 19.6% 21.3% 21.7% PER 38.6x 15.8x 9.4x 5.2x 3.6x 2.8x 2.5x FV/EBITDA 32.4x 17.6x 8.6x 5.0x 3.8x 3.4x 3.2x Adjusted for IPO costs Source: Tecnisa and Bulltick Klabin Segall: TP-YE08 R$33.50, 148% upside potential in USD Among the less liquid names, Klabin Segall is the most discounted stock under our coverage universe. The company had its ups and downs to manage and deliver expected launchings growth during 2007 and we believe current prices more than reflect those issues. Nevertheless, we expect a more smooth string of launchings going forward, increasing results visibility, which we expect to translate in some share price recovery. Currently trading at 5.7x PER09E, a 38% discount to the sector average, stocks are attractive not only on a PER basis. Investors looking for deep value, the shares are also trading at almost without any premium to adjusted book value multiple, and 43% discounted to the sector average. In addition, we expect to see some more of the innovative projects Klabin Segall became known for executing successfully. For example, during 2008 and 2009 the company plans to develop an integrated complex of commercial and middle income residential project in Santo André, besides applying its revitalization experience to launch a 2nd home project in Buzios, Rio de Janiero state coast. We also look forward to see the initial results on the “Olá” low income initiative. Model review focused on increased launchings after Setin’s acquisition, including the construction financing and fine tunning. Besides, we are also raising our discount rates to 8
  • 9. reflect lower liquidity for the shares. All in all, we reach a Dec. 08 TP of R$33.50/share, implying a 156% in USD and reiterating our BUY rating for the shares. Exhibit 12: Klabin Segall’s Main Figures Klabin Segall (R$ MM) 2006 2007E 2008E 2009E 2010E 2011E 2012E Launchings 773 1,775 1,812 2,084 2,334 2,567 2,670 - Real Estate Sales 400 875 1,706 1,832 2,199 2,358 2,535 Net Revenues 138 292 705 1,188 1,785 2,032 2,319 Adj. EBITDA 59 62 168 307 482 557 634 Adj. Net income 25 39 71 137 267 331 389 Gross Margin 41.9% 36.1% 36.5% 36.4% 36.2% 36.4% 36.1% Adj. EBITDA Margin 27.4% 21.4% 23.8% 25.8% 27.0% 27.4% 27.3% Adj. Net Margin 17.8% 13.5% 10.0% 11.6% 14.9% 16.3% 16.8% PER 206.0x 19.9x 11.1x 5.7x 2.9x 2.4x 2.0x FV/EBITDA 14.0x 13.8x 8.1x 5.5x 3.5x 3.1x 2.7x Adjusted for IPO Costs Source: Klabin Segall and Bulltick Company: TP-YE08 R$54.00, 48.2% upside potential in USD As part of our revision of Company’s valuation model, besides including higher launching guidance for ’08 and ’09, we analyzed carefully its working capital management, not only including SFH leverage but also the construction and sales speed curves. Company trades at a 7.8x PER09E versus Tecnisa’s and Klabin Segall’s respective 5.2x and 5.7x multiples and the average of 9.2x for homebuilders under our coverage. On a Price-to-Adj Book Value basis, Company negotiates at 2.85x, slightly above the 2.59x average for companies under our coverage. Company shares are currently trading at premium to Tecnisa and Klabin Segall, where we see more upside on a relative basis. Thus, despite a favorable valuation vis-à-vis the more liquid names, at this point, we prefer to look for deep value and stick to Tecnisa and Klabin Segall. Our DCF TP for Company is R$55.00/share for YE08. After roughly 21% decline in share prices since early December, we are upgrading Company to BUY from NEUTRAL. Exhibit 13: Company’s Main Figures Company (R$ MM) 2006 2007E 2008E 2009E 2010E 2011E 2012E Launchings 353 1,033 1,500 1,875 2,100 2,184 2,271 - Real Estate Sales 258 695 1,149 1,446 1,839 2,035 2,178 Net Revenues 289 451 742 997 1,442 1,806 2,064 Adj. EBITDA 69 90 166 233 327 398 439 Adj. Net income 56 64 123 157 230 281 311 Gross Margin 34.2% 30.7% 33.3% 34.4% 33.6% 33.0% 32.2% Adj. EBITDA Margin 20.4% 19.8% 22.4% 23.4% 22.7% 22.0% 21.3% Adj. Net Margin 15.8% 14.2% 16.6% 15.8% 15.9% 15.6% 15.1% PER 21.9x 19.0x 9.9x 7.8x 5.3x 4.3x 3.9x FV/EBITDA 17.8x 15.6x 9.8x 8.2x 6.1x 5.3x 4.9x Adjusted for IPO costs Source: Company and Bulltick 9
  • 10. Detailed Financial Statements Rossi Residencial Income Statement (R$ MM) 2006 2007E 2008E 2009E 2010E 2011E 2012E Launchings 882 1,981 2,500 3,000 3,360 3,696 3,844 - Real Estate Sales 584 1,284 2,218 2,571 3,096 3,466 3,704 Gross Revenues 425 720 1,432 2,074 2,662 3,191 3,605 Net Revenues 411 701 1,380 1,998 2,565 3,075 3,474 - COGS (283) (454) (890) (1,286) (1,671) (2,021) (2,294) Gross Profit 128 247 490 712 894 1,054 1,180 - Sales Expeditures (46) (59) (117) (160) (180) (215) (243) - G&A Expenditures (38) (59) (85) (107) (111) (115) (120) - Other Operational 6 7 8 16 21 28 32 EBIT 50 136 296 462 624 751 848 Financial Results 47 24 (39) (104) (153) (173) (184) Non-Operational Results (52) (3,447) - - - - - EBT 46 157 256 357 471 577 664 Income Tax (2) (20) (23) (32) (47) (58) (66) Minority Interest - - - - - - - Net income 44 137 233 325 424 520 598 Depreciation 0.9 1.3 1.5 1.8 2.1 2.6 3.2 EBITDA 51 137 297 464 626 753 851 Adjustments 10 - - - - - - Adjusted EBITDA 61 137 297 464 626 753 851 Gross Margin 31.2% 35.3% 35.5% 35.6% 34.8% 34.3% 34.0% Adjusted EBITDA Margin 14.9% 19.6% 21.5% 23.2% 24.4% 24.5% 24.5% Adjusted Net Margin 13.1% 19.6% 16.9% 16.3% 16.5% 16.9% 17.2% Free Cash Flow 2006 2007E 2008E 2009E 2010E 2011E 2012E EBITDA 51 137 297 464 626 753 851 Taxes on EBIT (2) (18) (27) (42) (62) (75) (85) Change in Net Working Assets (408) (234) (917) (876) (870) (929) (489) CAPEX (2) (1) (2) (2) (3) (3) (4) FCFF (361) (115) (648) (456) (309) (254) 274 Change in Debt (14) 422 463 625 359 249 102 Emission 755 - - - - - - Financial Results 47 24 (39) (104) (153) (173) (184) Tax difference 0 (2) 4 9 15 17 18 FCFE 428 329 (221) 74 (88) (161) 210 Balance Sheet 2006 2007E 2008E 2009E 2010E 2011E 2012E Assets Cash and Equivalents 327 377 311 246 164 164 164 Accounts Receivable 392 353 1,107 1,550 2,001 2,601 2,855 Inventories 552 901 1,006 1,400 1,787 2,087 2,296 Other 220 537 468 644 632 433 560 Total Assets 1,490 2,168 2,892 3,840 4,583 5,285 5,875 Liabilities Short Term Debt 89 135 135 135 135 135 135 Clients Advance Payments 2 - - - - - - Long Term Debt 37 414 877 1,502 1,861 2,110 2,212 Other 283 445 531 610 677 739 779 Equity 1,080 1,174 1,349 1,593 1,911 2,301 2,749 Total Liabilities 1,490 2,168 2,892 3,840 4,583 5,285 5,875 Source: Rossi Residencial and Bulltick 10
  • 11. MRV Income Statement (R$ MM) 2006 2007E 2008E 2009E 2010E 2011E 2012E Launchings 337 1,200 2,100 2,520 2,898 3,130 3,318 - Real Estate Sales 206 717 1,707 2,298 2,705 3,001 3,220 Gross Revenues 160 430 1,085 1,879 2,460 2,849 3,134 Net Revenues 140 399 1,046 1,811 2,371 2,745 3,019 - COGS (91) (240) (595) (1,036) (1,386) (1,619) (1,805) Gross Profit 50 159 450 775 984 1,126 1,214 - Sales Expeditures (11) (29) (98) (132) (156) (173) (185) - G&A Expenditures (24) (108) (62) (66) (69) (71) (72) - Other Operational 9 26 32 42 52 58 60 EBIT 24 48 322 619 812 941 1,017 Financial Results (3) 32 28 (3) (6) (9) (11) Non-Operational Results 0 0 - - - - - EBT 20 81 350 616 805 932 1,005 Income Tax (3) (28) (52) (92) (121) (140) (151) Minority Interest - (0) - - - - - Net income 17 53 297 523 685 792 855 Depreciation 0.2 0.8 1.4 2.0 2.3 2.6 2.9 EBITDA 22 39 291 579 762 886 960 Adjustments - 61 - - - - - Adjusted EBITDA 22 100 291 579 762 886 960 Gross Margin 35.3% 39.9% 43.1% 42.8% 41.5% 41.0% 40.2% Adjusted EBITDA Margin 16.0% 25.0% 27.9% 32.0% 32.1% 32.3% 31.8% Adjusted Net Margin 12.1% 28.5% 28.4% 28.9% 28.9% 28.8% 28.3% Free Cash Flow 2006 2007E 2008E 2009E 2010E 2011E 2012E EBITDA 22 39 291 579 762 886 960 Taxes on EBIT (4) (29) (48) (93) (122) (141) (153) Change in Net Working Assets (69) (553) (573) (436) (325) (198) (98) CAPEX (2) (5) (7) (4) (4) (5) (5) FCFF (52) (535) (337) 47 311 542 704 Change in Debt 63 (14) 149 25 39 30 25 Emission - 1,231 - - - - - Financial Results (12) (18) (12) (61) (79) (85) (94) Tax difference 1 1 (4) 0 1 1 2 FCFE (1) 666 (204) 11 272 489 637 Balance Sheet 2006 2007E 2008E 2009E 2010E 2011E 2012E Assets Cash and Equivalents 9 702 132 132 132 132 132 Accounts Receivable 129 493 1,003 1,197 1,413 1,509 1,543 Inventories 235 644 957 1,314 1,539 1,700 1,820 Other 7 107 580 656 948 1,418 2,015 Total Assets 380 1,945 2,672 3,299 4,032 4,758 5,509 Liabilities Short Term Debt 48 16 16 16 16 16 16 Clients Advance Payments 28 35 27 10 12 - - Long Term Debt 17 36 185 209 248 278 304 Other 197 479 842 1,069 1,246 1,361 1,446 Equity 91 1,380 1,603 1,996 2,509 3,103 3,744 Total Liabilities 380 1,945 2,672 3,299 4,032 4,758 5,509 Source: MRV and Bulltick 11
  • 12. Cyrela Income Statement (R$ MM) 2006 2007E 2008E 2009E 2010E 2011E 2012E Launchings 3,618 4,600 6,000 7,500 8,400 9,240 9,610 - Real Estate Sales 2,247 3,400 4,400 6,053 7,424 8,382 9,097 Gross Revenues 1,104 1,625 2,117 3,868 5,635 7,167 8,455 Net Revenues 1,064 1,561 2,040 3,727 5,430 6,905 8,146 - C OGS (645) (904) (1,166) (2,142) (3,162) (4,069) (4,826) Gross Profit 419 657 873 1,584 2,268 2,836 3,320 - Sales Expeditures (131) (170) (204) (373) (543) (691) (815) - G&A Expenditures (73) (103) (125) (131) (136) (142) (147) - Management Fees (2) (2) (2) (2) (3) (3) (3) - Other Operational (18) 6 - - - - - EBIT 196 388 542 1,078 1,585 2,001 2,355 Financial Results 49 46 39 (51) (15) 44 33 - Financial Expenses (84) (102) (138) (186) (187) (194) (211) - Financial Revenues 133 149 177 135 172 237 244 Non-Operational Results - 0.1 - - - - - Equity Pick-Up - 110 - - - - - EBT 244 545 582 1,027 1,571 2,045 2,387 Income Tax (58) (57) (87) (123) (188) (245) (286) Employee Interest (5) (9) (5) (5) (5) (6) (6) Minority Interest (24) (39) (58) (103) (157) (204) (239) Net income 190 440 431 796 1,220 1,589 1,856 Depreciation 3.6 1.6 1.7 1.9 2.0 2.2 2.4 Amortization 1.5 - - - - - - Employee Interest (5) (9) (5) (5) (5) (6) (6) EBITDA 196 403 539 1,075 1,582 1,998 2,351 Adjustments 20.8 - - - - - - Adjusted EBITDA 217 403 539 1,075 1,582 1,998 2,351 Gross Margin 39.4% 42.1% 42.8% 42.5% 41.8% 41.1% 40.8% Ajudsted EBITDA Margin 20.4% 25.8% 26.4% 28.8% 29.1% 28.9% 28.9% Adjusted Net Margin 19.8% 21.1% 21.1% 21.4% 22.5% 23.0% 22.8% Free Cash Flow 2006 2007E 2008E 2009E 2010E 2011E 2012E EBITDA 196 403 539 1,075 1,582 1,998 2,351 Minority Adjustment (62) (118) (176) (339) (400) (391) (232) Taxes on EBIT (47) (40) (81) (129) (190) (240) (283) C hange in Net Working Assets (735) (1,223) (1,191) (2,388) (3,251) (4,298) (1,198) C APEX (39) (269) (3) (3) (3) (3) (4) FCFF (686) (1,247) (912) (1,784) (2,263) (2,936) 635 C hange in Debt (79) 509 810 604 101 219 179 Emission - - - - - - - Financial Results 49 46 39 (51) (15) 44 33 Tax difference (11) (17) (6) 6 2 (5) (4) FCFE (727) (709) (68) (1,225) (2,174) (2,678) 843 Balance Sheet 2006 2007E 2008E 2009E 2010E 2011E 2012E Assets C ash and Equivalents 561 671 785 399 363 363 363 Accounts Receivable 865 1,104 1,586 2,668 3,856 6,157 7,040 C lient Financing - 522 689 1,061 2,303 3,644 3,492 Inventories 976 1,696 2,306 3,447 4,432 5,262 5,830 Other 640 142 213 (96) (1,880) (4,321) (3,611) Total Assets 3,042 4,134 5,578 7,478 9,073 11,105 13,115 Liabilities Short Term Debt 57 86 86 86 86 86 86 Real Estate Acquisition Payables 351 758 891 1,067 1,195 1,314 1,367 C lients Advance Payments 84 35 7 - - - - Long Term Debt 67 548 1,358 1,962 2,064 2,283 2,462 Other 535 713 919 1,450 1,901 2,401 2,787 Equity 1,949 1,993 2,317 2,914 3,829 5,021 6,413 Total Liabilities 3,042 4,134 5,578 7,478 9,073 11,105 13,115 Source: Cyrela and Bulltick 12
  • 13. Gafisa Income Statement (R$ MM) 2006 2007E 2008E 2009E 2010E 2011E 2012E Launchings 1,005 1,900 3,000 3,360 3,695 3,846 3,999 - Real Estate Sales 995 1,625 2,627 3,086 3,505 3,729 3,908 Gross Revenues 744 1,192 1,665 2,342 3,098 3,560 3,884 Net Revenues 664 1,124 1,565 2,201 2,912 3,346 3,651 - C OGS (466) (782) (1,071) (1,491) (1,978) (2,286) (2,517) Gross Profit 198 342 494 710 934 1,061 1,134 - Sales Expeditures (52) (71) (110) (110) (146) (167) (183) - G&A Expenditures (52) (103) (117) (122) (127) (132) (137) - Other Operational (30) (38) - - - - - EBIT 64 130 267 479 661 762 815 Financial Results (12) (18) (12) (61) (79) (85) (94) - Financial Expenses (65) (62) (31) (74) (92) (97) (106) - Financial Revenues 53 44 19 14 13 13 12 Non-Operational Results - - - - - - - EBT 52 112 255 418 582 677 721 Income Tax (6) (14) (31) (50) (87) (102) (108) Minority Interest - (6) - - - - - Net income 46 92 225 368 495 575 613 Depreciation 4.3 14.7 12.0 14.6 16.9 18.1 18.8 EBITDA 68 145 279 493 678 780 834 Adjustments 30 30.2 - - - - - Adjusted EBITDA 98 175 279 493 678 780 834 Gross Margin 29.8% 30.4% 31.5% 32.3% 32.1% 31.7% 31.1% Adjusted EBITDA Margin 14.8% 15.6% 17.8% 22.4% 23.3% 23.3% 22.8% Adjusted Net Margin 11.4% 10.9% 14.4% 16.7% 17.0% 17.2% 16.8% Free Cash Flow 2006 2007E 2008E 2009E 2010E 2011E 2012E EBITDA 68 145 279 493 678 780 834 Taxes on EBIT (8) (9) (33) (59) (102) (117) (125) C hange in Net Working Assets (397) (759) (880) (1,106) (341) (376) (301) C APEX (6) (36) (18) (22) (20) (20) (21) FCFF (343) (659) (652) (694) 216 267 387 C hange in Debt (21) 89 214 482 158 129 100 Emission - 623 - - - - - Financial Results (12) (18) (12) (61) (79) (85) (94) Tax difference 2 (5) 3 9 14 15 17 FCFE (374) 30 (447) (264) 309 327 410 Balance Sheet 2006 2007E 2008E 2009E 2010E 2011E 2012E Assets C ash and Equivalents 266 310 130 130 130 130 130 Accounts Receivable 560 924 1,489 2,222 2,621 2,890 3,011 Inventories 441 921 1,375 1,803 1,805 2,008 2,129 Other 227 337 158 (56) 240 494 797 Total Assets 1,494 2,492 3,153 4,099 4,795 5,523 6,067 Liabilities Short Term Debt 28 34 34 34 34 34 34 Real Estate Acquisition Payables 22 25 58 94 126 146 155 C lients Advance Payments 76 17 - - 9 83 - Long Term Debt 267 351 564 1,046 1,204 1,333 1,433 Other 286 553 816 969 1,095 1,168 1,226 Equity 814 1,512 1,680 1,956 2,327 2,759 3,219 Total Liabilities 1,494 2,492 3,153 4,099 4,795 5,523 6,067 Source: Gafisa and Bulltick 13
  • 14. Tecnisa Income Statement (R$ MM) 2006 2007E 2008E 2009E 2010E 2011E 2012E Total Launchings 369 1,364 1,778 2,235 2,504 2,601 2,705 Launchings - Tecnisa Stake 285 1,000 1,600 1,900 2,128 2,341 2,434 Total Real Estate Sales 333 706 1,387 1,877 2,270 2,476 2,618 Gross Revenues 211 379 768 1,484 2,016 2,391 2,613 Net Revenues 203 364 740 1,430 1,942 2,304 2,518 - COGS (122) (224) (449) (872) (1,194) (1,425) (1,560) Gross Profit 81 141 291 558 748 879 958 - Sales Expeditures (11) (20) (37) (79) (107) (127) (126) - G&A Expenditures (21) (38) (43) (45) (47) (49) (51) - Management Fees (2) (4) (12) (17) (22) (26) (29) - Other Operational (0) (37) - - - - - EBIT 47 41 199 418 571 677 752 Financial Results 2 17 (12) (47) (55) (58) (64) - Financial Expenses (16) (17) (25) (59) (70) (80) (89) - Financial Revenues 18 34 13 12 15 23 25 Non-Operational Results 1 729 - - - - - EBT 49 59 187 370 516 620 688 Income Tax (9) (9) (22) (44) (52) (62) (69) Employee Interest - - - - - - - Minority Interest (2) (19) (61) (85) (66) (73) Net income 36 48 146 265 380 491 546 Depreciation 0.4 (1.2) 0.4 0.4 0.4 0.4 0.5 Amortization - - - - - - - Employee Interest - - - - - - - EBITDA 47 40 199 418 572 678 753 Adjustments - 40 - - - - - Adjusted EBITDA 47 80 199 418 572 678 753 Gross Margin 40.0% 38.6% 39.3% 39.0% 38.5% 38.2% 38.0% Adjusted EBITDA Margin 23.1% 21.9% 26.9% 29.2% 29.4% 29.4% 29.9% Adjusted Net Margin 17.6% 24.0% 19.8% 18.5% 19.6% 21.3% 21.7% Free Cash Flow 2006 2007E 2008E 2009E 2010E 2011E 2012E EBITDA 47 40 199 418 572 678 753 Minority Adjustment (10) (16) (21) (70) (94) (73) (82) Taxes on EBIT (8) (3) (24) (50) (57) (68) (75) Change in Net Working Assets (88) (567) (678) (1,035) (885) (835) (310) CAPEX (2) (1) (1) (1) (1) (1) (1) FCFF (62) (552) (525) (738) (465) (299) 285 Change in Debt 92 (18) 298 360 95 114 92 Emission - 591 - - - - - Financial Results 2 17 (12) (47) (55) (58) (64) Tax difference (0) (6) 1 6 6 6 6 FCFE 31 32 (237) (419) (420) (237) 319 Balance Sheet 2006 2007E 2008E 2009E 2010E 2011E 2012E Assets Cash and Equivalents 20 120 100 100 100 100 100 Accounts Receivable 174 299 597 1,267 1,820 2,327 2,547 Client Financing - 11 15 26 121 269 260 Inventories 232 659 1,116 1,550 1,841 2,063 2,184 Other 83 94 (52) (430) (858) (1,140) (910) Total Assets 509 1,184 1,777 2,512 3,024 3,619 4,180 Liabilities Short Term Debt 118 41 41 41 41 41 41 Real Estate Acquisition Payables 116 156 239 284 318 350 364 Clients Advance Payments 28 8 2 - - - - Long Term Debt 41 100 398 759 854 968 1,060 Other 61 107 216 349 446 526 572 Equity 145 772 882 1,080 1,365 1,734 2,143 Total Liabilities 509 1,184 1,777 2,512 3,024 3,619 4,180 Source: Tecnisa and Bulltick 14
  • 15. Klabin Segall Income Statement (R$ MM) 2006 2007E 2008E 2009E 2010E 2011E 2012E Launchings 773 1,775 1,812 2,084 2,334 2,567 2,670 - Real Estate Sales 400 875 1,706 1,832 2,199 2,358 2,535 Gross Revenues 144 306 738 1,244 1,869 2,127 2,428 Net Revenues 138 292 705 1,188 1,785 2,032 2,319 - COGS (80) (187) (448) (755) (1,138) (1,292) (1,481) Gross Profit 58 106 258 433 646 740 838 - Sales Expeditures (8) (26) (53) (89) (134) (152) (174) - G&A Expenditures (12) (24) (49) (51) (53) (55) (57) - Other Operational (4) (2) - - - - - EBIT 34 58 163 305 479 554 631 Financial Results 5 9 (35) (76) (89) (77) (74) - Financial Expenses (8) (15) (46) (81) (94) (81) (78) - Financial Revenues 12 25 10 5 5 5 5 Non-Operational Results (20) 67 - - - - - EBT 19 67 128 229 390 477 557 Income Tax (8) (13) (26) (46) (78) (95) (111) Employee Interest - - - - - - - Minority Interest (7) (15) (32) (46) (45) (50) (56) Net income 4 39 71 137 267 331 389 Depreciation 3.4 4.8 4.7 1.9 2.3 2.8 3.4 Amortization - - - - - - - EBITDA 38 62 168 307 482 557 634 Adjustments 21 - - - - - - Adjusted EBITDA 59 62 168 307 482 557 634 Gross Margin 41.9% 36.1% 36.5% 36.4% 36.2% 36.4% 36.1% Adjusted EBITDA Margin 42.4% 21.4% 23.8% 25.8% 27.0% 27.4% 27.3% Adjusted Net Margin 17.8% 13.5% 10.0% 11.6% 14.9% 16.3% 16.8% Free Cash Flow 2006 2007E 2008E 2009E 2010E 2011E 2012E EBITDA 38 62 168 307 482 557 634 Minority Adjustment (9) (16) (40) (57) (57) (63) (70) Taxes on EBIT (7) (12) (34) (61) (96) (111) (127) Change in Net Working Assets (90) (471) (333) (669) (483) (237) (204) CAPEX (4) (6) (5) (3) (3) (4) (5) FCFF (73) (442) (243) (482) (157) 142 228 Change in Debt 9 294 308 334 6 2 26 Emission 361 - - - - - - Financial Results 5 9 (35) (76) (89) (77) (74) Tax difference (0) (1) 8 16 18 16 15 FCFE 302 (140) 38 (208) (222) 84 196 Balance Sheet 2006 2007E 2008E 2009E 2010E 2011E 2012E Assets Cash and Equivalents 281 243 49 49 49 49 49 Accounts Receivable 104 209 465 808 1,052 1,161 1,289 Client Financing - - - - - - - Inventories 190 645 753 1,169 1,479 1,659 1,773 Other 38 (18) 230 63 (138) (71) 90 Total Assets 613 1,079 1,496 2,089 2,442 2,797 3,200 Liabilities Short Term Debt 16 12 12 12 12 12 12 Real Estate Acquisition Payables 101 189 193 222 249 273 284 Clients Advance Payments 1 1 0 - - - - Long Term Debt 12 309 617 952 958 960 986 Other 64 160 213 340 459 539 613 Equity 419 408 461 564 764 1,013 1,305 Total Liabilities 613 1,079 1,496 2,089 2,442 2,797 3,200 Source: Klabin Segall and Bulltick 15
  • 16. Company Income Statement (R$ MM) 2006 2007E 2008E 2009E 2010E 2011E 2012E Launchings 353 1,033 1,500 1,875 2,100 2,184 2,271 - Real Estate Sales 258 695 1,149 1,446 1,839 2,035 2,178 Gross Revenues 300 484 770 1,035 1,497 1,874 2,142 Net Revenues 289 451 742 997 1,442 1,806 2,064 - COGS (190) (313) (495) (654) (957) (1,210) (1,398) Gross Profit 99 138 247 343 485 596 665 - SG&A expenditures (26) (43) (82) (110) (159) (199) (227) - Other Operational (12) (6) - - - - - EBIT 61 89 165 233 327 398 438 Financial Results (2) (16) (20) (48) (57) (67) (72) - Financial Expenses (17) (35) (32) (59) (67) (77) (83) - Financial Revenues 15 19 12 11 11 10 10 Non-Operational Results (0) 767 - - - - - EBT 55 74 145 185 270 331 366 Income Tax (7) (9) (22) (28) (41) (50) (55) Employee Interest (2) - - - - - - Minority Interest (0) - - - - - - Net income 45 64 123 157 230 281 311 Depreciation 0.4 0.4 0.4 0.4 0.4 0.4 0.4 EBITDA 59 90 166 233 327 398 439 Adjustments 10 - - - - - - Adjusted EBITDA 69 90 166 233 327 398 439 Gross Margin 34.2% 30.7% 33.3% 34.4% 33.6% 33.0% 32.2% Adjusted EBITDA Margin 24.0% 19.8% 22.4% 23.4% 22.7% 22.0% 21.3% Adjusted Net Margin 19.3% 14.2% 16.6% 15.8% 15.9% 15.6% 15.1% Free Cash Flow 2006 2007E 2008E 2009E 2010E 2011E 2012E EBITDA 59 90 166 233 327 398 439 Taxes on EBIT (8) (11) (25) (35) (49) (60) (66) Change in Net Working Assets (175) (225) (541) (841) (535) (619) (367) CAPEX (1) (0) (0) (0) (0) (0) (0) FCFF (125) (147) (400) (643) (257) (281) 6 Change in Debt 73 155 222 304 74 103 60 Emission - - - - - - - Financial Results (2) (16) (20) (48) (57) (67) (72) Tax difference 1 2 3 7 8 10 11 FCFE (54) (6) (196) (379) (231) (234) 4 Balance Sheet 2006 2007E 2008E 2009E 2010E 2011E 2012E Assets Cash and Equivalents 119 109 109 109 109 109 109 Accounts Receivable 297 371 819 1,379 1,687 2,111 2,351 Inventories 133 306 457 799 1,070 1,290 1,436 Other 59 89 (100) (489) (742) (1,022) (1,080) Total Assets 607 875 1,285 1,798 2,124 2,489 2,816 Liabilities Short Term Debt 50 61 61 61 61 61 61 Suppliers 12 15 22 27 30 32 33 Real Estate Acquisition Payables 35 52 76 95 106 110 115 Clients Advance Payments 2 0 0 - - - - Long Term Debt 80 225 447 751 825 929 988 Other 137 188 252 318 384 428 457 Equity 291 335 428 546 718 929 1,162 Total Liabilities 607 875 1,285 1,798 2,124 2,489 2,816 Source: Company and Bulltick 16
  • 17. APPENDIX B IMPORTANT DISCLOSURES Bulltick Brasil Consultoria e Assessoria Empresarial Ltda. is an affiliate of Bulltick LLC (The Firm). Bulltick LLC may do business with the companies covered in this report, as a result, investors should be aware that the Firm may have a conflict of interest that could affect the objectivity of this report. Investors should consider this report only as a single factor in making their investment decision. A. CONFLICTS OF INTEREST From the companies covered in this report, Bulltick Brasil Consultoria e Assessoria Empresarial Ltda, or its affiliates, currently has, or has had within the past 12 months, Tecnisa and MRV as client and/or received compensation for products and services provided to this company. From the companies covered in this report, Bulltick Brasil Consultoria e Assessoria Empresarial Ltda, or its affiliates, managed or co-managed a public offering of securities for Tecnisa and MRV in the past 12 months, received compensation for investment banking services from Tecnisa and MRV in the past 12 months. Neither Bulltick Brasil Consultoria e Assessoria Empresarial Ltda nor any of its affiliates own equity securities of any of the subject companies. Analyst compensation is determined by Bulltick Brasil Consultoria e Assessoria Empresarial Ltda management and is not linked to specific transactions or recommendations. B. ANALYST CERTIFICATION I, Rafael Pinho, author of this report, hereby certify that all of the views expressed in this report accurately reflect my personal views about any and all of the subject issuer(s) or securities, no part of my compensation was, is , or will be directly or indirectly related to the specific recommendation(s) or view(s) in this report. I have not received any compensation from any of the subject companies in the past 12 months. I also certify that neither I nor any member of my household serves as a director, officer, or advisory board member of any of the subject companies in this report. C. INVESTMENT RATING Investment ratings are determined by the ranges described below: BUY: Total return of securities expected to be above 18% (in dollar terms) in the following 12 months NEUTRAL: Total return of securities expected to be below 18% (in dollar terms) and above 8% (in dollar terms) in the following 12 months. SELL: Total return of securities expected to be below 8% (in dollar terms) in the following 12 months. Price Target: The valuation method used to determine the price targets in this report were based on the discounted cash flow methodology. D. RISK RATINGS Risks for the achievement of the target prices defined in this report include major change in our base case macro- economic scenario, increase in interest rates and in the Brazil risk, reduction in the expectations for demand for real estate in Brazil and impact on already listed stocks of new IPOs in Brazil´s real estate sector. Based on last 6 months volatility of subject companies, and comparing them to the volatility of the Bovespa Index (Ibovespa) in the same period, we define each subject company´s relative volatility in the following way: Company High, Cyrela High, Gafisa High, Klabin Segall High, Rossi Residencial High and Tecnisa High 17
  • 18. OTHER DISCLOSURES Bulltick Brasil Consultoria e Assessoria Empresarial Ltda and its subsidiaries, affiliates, shareholders, directors, officers, employees, and licensors (“The Bulltick Parties”) will not be liable (individually, jointly, or severally) to you or any other person as a result of your access, reception or use of the information contained in this document for indirect, consequential, special, incidental, punitive, or exemplary damages, including, without limitation, lost profits, lost savings and lost revenues (collectively, the “Excluded Damages”), whether or not characterized in negligence, tort, contract, or other theory of liability. The information contained in this document has been obtained from sources believed to be reliable, although its accuracy and completeness cannot be guaranteed. All opinions, projections, and estimates constitute the judgment of the author as of the date of the report and these, plus any other information contained in the report, are subject to change without notice. Prices and availability of financial instruments also are subject to change without notice. Bulltick Brasil Consultoria e Assessoria Empresarial Ltda and its affiliated companies have not taken any steps to insure that the securities referred to in this report are suitable for any particular investor. The Report is for informational purposes only and is not intended as an offer or solicitation for the purchase or sale of a security. Securities mentioned in the report are subject to investment risks, including the possible loss of the principal amount invested. Any decision to purchase securities mentioned in the Report must take into account existing public information on such a security or any registered prospectus. The financial instruments mentioned in this document may not be eligible for sale in some countries. The Report is not to be construed as providing investment services in any jurisdiction where the provision of such services would be illegal. Bulltick Brasil Consultoria e Assessoria Empresarial Ltda, its affiliated companies, and/or its officers, directors, or shareholders, may from time to time have long or short positions in the financial instruments of the companies mentioned in this document, engage in securities transactions in a manner inconsistent with this report, buy or sell from customers on a principal basis, or serve in an advisory capacity. Investing in non-US securities, including ADRs, may entail certain risks. The securities of non-US issuers may not be registered with, and may not be subject to the reporting requirements of the US Securities and Exchange Commission. There may be limited information available on foreign securities. Foreign companies are generally not subject to uniform audit and reporting standards, practices and requirements comparable to those in the US Securities of some foreign companies may be less liquid and their prices more volatile than securities of comparable US companies. In addition, exchange rate movements may have an adverse effect on the value of an investment in a foreign stock and its corresponding dividend payment for US investors. The information contained in the report is privileged and confidential and intended solely for the recipients who have been specifically authorized to receive it and it may not be further distributed. Bulltick Brasil Consultoria e Assessoria Empresarial Ltda and its affiliates accept no liability whatsoever for the actions of third parties. Should you receive this message by mistake you are hereby notified that any disclosure reproduction, distribution, or use of this message is strictly prohibited. The Report may provide the addresses of, or contain hyperlinks to, websites. Except to the extent to which the Report refers to the website material of the Bulltick Brasil Consultoria e Assessoria Empresarial Ltda or any of its affiliates, the Firm has not reviewed the linked site. Equally, except to the extent to which the Report refers to website material of Bulltick Brasil Consultoria e Assessoria Empresarial Ltda or any of its affiliates, the Firm takes no responsibility for, and makes no representation or warranties whatsoever as to, the data and information contained therein. Such address or hyperlink (including addresses or hyperlinks to website material of Bulltick Brasil Consultoria e Assessoria Empresarial Ltda or any of its affiliates) is provided solely for your convenience and information and the content of the linked site does not in any way form part of this document. Accessing such website or following such link through the Report or the website of Bulltick Brasil Consultoria e Assessoria Empresarial Ltda or any of its affiliates shall be at your own risk and Bulltick Brasil Consultoria e Assessoria Empresarial Ltda or any of its affiliates shall have no liability arising out of, or in connection with, and such referenced website. 18