1. U.S. Exports to
Morocco
A State Perspective
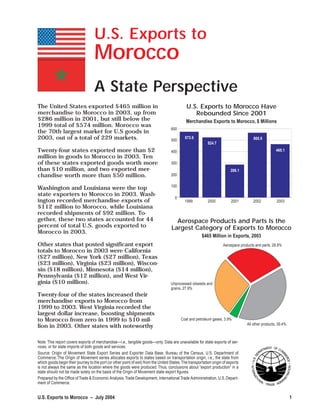
The United States exported $465 million in U.S. Exports to Morocco Have
merchandise to Morocco in 2003, up from Rebounded Since 2001
$286 million in 2001, but still below the Merchandise Exports to Morocco, $ Millions
1999 total of $574 million. Morocco was
600
the 70th largest market for U.S goods in
2003, out of a total of 229 markets. 500
573.6 565.5
524.7
Twenty-four states exported more than $2 400 465.1
million in goods to Morocco in 2003. Ten
of these states exported goods worth more 300
than $10 million, and two exported mer- 286.1
chandise worth more than $50 million. 200
100
Washington and Louisiana were the top
state exporters to Morocco in 2003. Wash-
0
ington recorded merchandise exports of 1999 2000 2001 2002 2003
$112 million to Morocco, while Louisiana
recorded shipments of $92 million. To-
gether, these two states accounted for 44 Aerospace Products and Parts Is the
percent of total U.S. goods exported to Largest Category of Exports to Morocco
Morocco in 2003.
$465 Million in Exports, 2003
Other states that posted significant export Aerospace products and parts, 28.8%
totals to Morocco in 2003 were California
($27 million), New York ($27 million), Texas
($23 million), Virginia ($23 million), Wiscon-
sin ($18 million), Minnesota ($14 million),
Pennsylvania ($12 million), and West Vir-
ginia ($10 million). Unprocessed oilseeds and
grains, 27.9%
Twenty-four of the states increased their
merchandise exports to Morocco from
1999 to 2003. West Virginia recorded the
largest dollar increase, boosting shipments
to Morocco from zero in 1999 to $10 mil- Coal and petroleum gases, 3.9%
All other products, 39.4%
lion in 2003. Other states with noteworthy
Note: This report covers exports of merchandise—i.e., tangible goods—only. Data are unavailable for state exports of ser-
vices, or for state imports of both goods and services.
Source: Origin of Movement State Export Series and Exporter Data Base, Bureau of the Census, U.S. Department of
Commerce. The Origin of Movement series allocates exports to states based on transportation origin, i.e., the state from
which goods begin their journey to the port (or other point of exit) from the United States. The transportation origin of exports
is not always the same as the location where the goods were produced. Thus, conclusions about “export production” in a
state should not be made solely on the basis of the Origin of Movement state export figures.
Prepared by the Office of Trade & Economic Analysis, Trade Development, International Trade Admininstration, U.S. Depart-
ment of Commerce.
U.S. Exports to Morocco – July 2004 1
2. Twenty-Four States Exported $2 Million or More to Morocco in 2003
$ Value Merchandise Exported
to Morocco, 2003
$2 million or more
Less than $2 million
West Virginia Recorded the Biggest Growth in Exports to Morocco
From 1999 to 2003
Top 10 States by Dollar Change in Exports to Morocco
West Virginia 10.5
Pennsylvania 9.0
Minnesota 8.3
Wisconsin 7.5
California 6.7
New York 6.5
Kansas 4.9
Louisiana 3.7
Oregon 3.1
Michigan 2.5
0 1 2 3 4 5 6 7 8 9 10 11
1999–2003 Change, $ Millions
2 U.S. Exports to Morocco – July 2004
3. increases in merchandise export value to ports of all these categories rose by more
Morocco over the 1999–2003 period were than 300 percent.
Pennsylvania (up $9.0 million), Minnesota
(up $8.3 million), Wisconsin (up $7.5 mil- Among non-manufactures, U.S. exports of
lion), California (up $6.7 million), New York unprocessed oilseeds and grains to Mo-
(up $6.5 million), Kansas (up $4.9 million), rocco rebounded by 53 percent from 2002
Louisiana (up $3.7 million), Oregon (up to 2003, but were a more modest 15 per-
$3.1 million), Michigan (up $2.5 million), cent above the 1999 level of $113 million.
and Indiana (up $2.5 million).
A total of 872 U.S. companies exported
Manufactured goods made up 61 percent merchandise to Morocco in 2001 (the lat-
of U.S. merchandise exports to Morocco in est year for which data are available). Of
2003 (well below the 89 percent figure for those, 67 percent were small and medium-
total U.S. exports of goods). Aerospace sized enterprises (SMEs) with fewer than
products and parts was the largest manu- 500 employees.
factured export category, with $134 mil-
lion or 29 percent of total U.S. shipments SMEs generated more than one-third (36
of merchandise (including non- percent) of the known value of U.S. exports
manufactures). Other significant manufac- to Morocco in 2001. This was well above
tured export categories were agriculture the SME share of U.S. exports to the world,
and construction machinery ($13 million); which in 2001 stood at 29 percent.
resin, synthetic rubber, and synthetic fi-
bers and filaments ($11 million); and grain
and oilseed milling products ($11 million).
The United States also exported significant
amounts of unprocessed agricultural com-
modities to Morocco in 2003. Shipments
of unprocessed oilseeds and grains totaled
$130 million—the second largest export
category to this market, accounting for
more than one-fourth of total U.S. exports
to Morocco.
While overall U.S. exports to Morocco in
2003 were below the 1999 level, several
product sectors grew strongly over this
period. In dollar terms, the leading growth
category among manufactured exports to
Morocco was pulp, paper, and paperboard
mill products. Export shipments of these
products over the 1999–2003 period
more than doubled, going from $4.7 mil-
lion to $9.6 million. Other manufactured
export categories that registered large dol-
lar growth during this period were petro-
leum and coal products (up $4.5 million)
and communications equipment (up $2.4
million).
In percentage terms, the fastest-growing
categories among U.S. manufactured ex-
ports to Morocco from 1999 to 2003
were clay and refractory products; fibers,
yarns, and threads; footwear; processed
alumina and aluminum; springs and wire
products; and electrical equipment. Ex-
U.S. Exports to Morocco – July 2004 3
10. Data Notes on the strategy, but they are not exports. Exports
Origin of Movement Series include only goods and services that are
outbound from the United States and
All state export statistics in this report are which transit its borders.
drawn from the Census Bureau’s Origin of
Movement (OM) state export series. The The OM series was not designed to measure
OM series is based on information sup- the state distribution of U.S. export produc-
plied by U.S. exporters on official Shippers tion or export-related jobs. The focus is
Export Declarations (SEDs) for goods leav- transportation origin, not manufacturing
ing the United States. All statistics in the origin.
OM series are on a free-alongside-ship
(f.a.s.) basis and include both domestic There are nonetheless many cases when
exports and re-exports. the state origin of movement and the state
of production happen to be the same. The
The OM series seeks to measure state ex- origin of movement and origin of produc-
ports on the basis of transportation ori- tion often coincide because many manu-
gin—i.e., the location from which exports facturers ship exports directly from the
begin their journey to the port (or other factory gate, or from a nearby distribution
point) of exit from the United States. facility.
The OM series covers exports of merchan- There is no listing of states for which the
dise only. Exports of services are excluded Origin of Movement series is a good proxy
from the data. Also, OM statistics are for export production. Additional research
available only at the state level. There are is needed in this area. As a general rule,
currently no equivalent figures for exports however, it appears that the OM series is
by metropolitan areas, counties, zip codes, indicative of export production when (1)
or other sub-state areas. intermediaries are minor exporters in a
state, (2) manufacturers—especially single-
Similarly, no OM statistics are available for establishment firms—dominate exports,
state-level imports. The collection of state and (3) the state is a known producer of
import data presents enormous technical the goods being exported.
challenges, since it would require tracking
foreign goods through the U.S. wholesale The OM series in some cases will show
and retail distribution systems. Conse- considerable manufactured exports from
quently, it is not currently possible—using states known to have little manufacturing
OM data or any other U.S. trade data—to capability. This is partly attributable to ex-
calculate state trade balances. port marketing by in-state intermediaries.
These exporters frequently ship manufac-
The Origin of Movement series covers di- tures produced by out-of-state suppliers
rect exports only. A direct export is one from in-state distribution centers. Another
consisting of final goods shipped to a des- factor is shipments of manufactures from
tination outside the United States. So- in-state warehouses and other distribution
called indirect exports are excluded from centers that are arranged by exporters lo-
the data. Indirect exports are typically in- cated out-of-state. In both cases, manufac-
termediate goods, parts, or other inputs tured exports from the non-industrial state
that are shipped within the United States, are magnified on an origin-of-movement
and subsequently incorporated in final ex- basis.
port goods. Such shipments represent do-
mestic transactions—they are not Another limitation of the OM series is that,
considered exports in U.S. trade statistics. in certain cases, it falls short of its goal of
measuring transportation origin. The prob-
Also, cross-border shipments made by for- lem stems from the fact that many inter-
eign affiliates of U.S. companies (e.g., a mediaries have traditionally listed the state
shipment from a French subsidiary to a in which they are located—which is not
German customer) are not U.S. exports. necessarily the origin of movement—as the
These transactions may affect the finances "state of origin" on SEDs. For many other
of U.S. firms and reflect a global business transactions, intermediaries specify the
10 U.S. Exports to Morocco – July 2004
11. state location of the port of exit—which
very often is not the state where goods
began their export journey.
The result is significant inconsistencies in
the state-level allocation of exports sold by
intermediaries. The primary impact is on
the state distribution of non-manufactured
exports—where intermediaries are over-
whelmingly dominant. Most affected is the
allocation of exports of farm products,
minerals, and other bulk commodities—
virtually all of which are sold abroad by
intermediaries. The impact on manufac-
tured exports is much more limited, due to
the fact that intermediaries account for
only about one-third of U.S. exports of
manufactures.
The most visible result of the problem is a
tendency to understate exports from agri-
cultural states and inflate exports from
states having ports that handle high-value
shipments of farm products (e.g., Louisi-
ana).
Yet another data issue is that some ship-
pers fail to fill in the "state of origin" block
on the SED, or furnish invalid or illegible
entries. Consequently, the Census Bureau
is presently unable to determine the state
origin of movement for about five percent
of the value of U.S. exports.
For additional information on the Origin of
Movement series, visit the Census
Bureau’s website at http://
www.census.gov/foreign-trade/aip/
elom.html.
U.S. Exports to Morocco – July 2004 11