Descriptive Statistics in R.pptx
•Als PPTX, PDF herunterladen•
0 gefällt mir•187 views

Descriptive Statistics in R

Empfohlen
Weitere ähnliche Inhalte
Was ist angesagt?
Was ist angesagt? (20)
Ähnlich wie Descriptive Statistics in R.pptx
Ähnlich wie Descriptive Statistics in R.pptx (20)
Mehr von Ramakrishna Reddy Bijjam
Mehr von Ramakrishna Reddy Bijjam (20)
Kürzlich hochgeladen
Kürzlich hochgeladen (20)
Descriptive Statistics in R.pptx
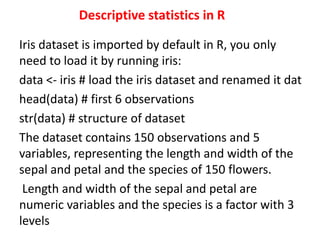
- 1. Descriptive statistics in R Iris dataset is imported by default in R, you only need to load it by running iris: data <- iris # load the iris dataset and renamed it dat head(data) # first 6 observations str(data) # structure of dataset The dataset contains 150 observations and 5 variables, representing the length and width of the sepal and petal and the species of 150 flowers. Length and width of the sepal and petal are numeric variables and the species is a factor with 3 levels
- 2. • Regarding plots, we present the default graphs and the graphs from the well- known {ggplot2} package. • Graphs from the {ggplot2} • Minimum and maximum • Minimum and maximum can be found thanks to the min() and max() functions: • min(data$Sepal.Length) • max(data$Sepal.Length) • Alternatively the range() function: • rng <- range(data$Sepal.Length)
- 3. Range • The range can then be easily computed, as you have guessed, by subtracting the minimum from the maximum: • max(dat$Sepal.Length) - min(dat$Sepal.Length) • there is no default function to compute the range. • Mean • The mean can be computed with the mean() function: • mean(data$Sepal.Length) • if there is at least one missing value in your dataset, use • mean(data$Sepal.Length, na.rm = TRUE) to compute the mean with the NA excluded. • This argument can be used for most functions presented in this article, not only the mean • numbers<-c(5,7,8,6,4,2,5,6) • mean(numbers) • barplot(numbers)
- 4. Frequency and Mode • Frequency is a summary of data occurrence in a collection of non-overlapping types • In R freq() used to find frequency distribution of vector inputs • Head(subset(mtcars, select=‘gear’)) • Factor(mtcars$gear) • w=table(mtcars$gear) • t=as.data.frame(w) • cbind() function can be used to display result in column format • cbind(w)
- 5. Mode • Mode is similar to frequency , except that the value of mode returns highest number of occurrences in a dataset • Mode can take both numeric and character as inputdata • V<-c(5,6,4,2,5,6,7,8,9,6,3,6) • Calculate mode with userdefined function • resultMode<-get Mode(v)
- 6. Median • Median is the middle value of given inputs • In R median can be found using median() function • Median(x,na.rm=FALSE) • X<-c(15,54,6,5,9.2,36,5.3,8,-7,-5) • Median.result<-median(x) • Numbers<-c(1,3,5,6,4,7,8,10) • Median(numbers) • Barplot(numbers)
- 7. Standard Deviation • To determine the Standard Deviation, to plot the numbers in a barplot and have straight line run through the plot at mean and another straight line run through the plot at mean+Standard Deviation • V<-c(5,6,4,2,5,6,7,8,9,6,3,6) • Mean(v) • deviation<- sd(v) • Barplot(numbers)
- 8. First and third quartile • As the median, the first and third quartiles can be computed to the quantile() function and by setting the second argument to 0.25 or 0.75: • quantile(dat$Sepal.Length, 0.25) # first quartile • quantile(dat$Sepal.Length, 0.75) # third quartile • Interquartile range • The interquartile range (i.e., the difference between the first and third quartile) can be computed with the IQR() function: • IQR(dat$Sepal.Length) • uantile(dat$Sepal.Length, 0.75) - quantile(dat$Sepal.Length, 0.25)