How to Master Data-Driven Marketing–Rival IQ
•
1 gefällt mir•927 views

Rival IQ is social media analytics with a competitive edge. Analyze your performance, gain strategic insight, and beat the competition. Rival IQ brings together social media, SEO keywords, and website content in one easy tool!
Empfohlen

Empfohlen
Weitere ähnliche Inhalte
Kürzlich hochgeladen
Kürzlich hochgeladen (20)
Empfohlen
Empfohlen (20)
How to Master Data-Driven Marketing–Rival IQ
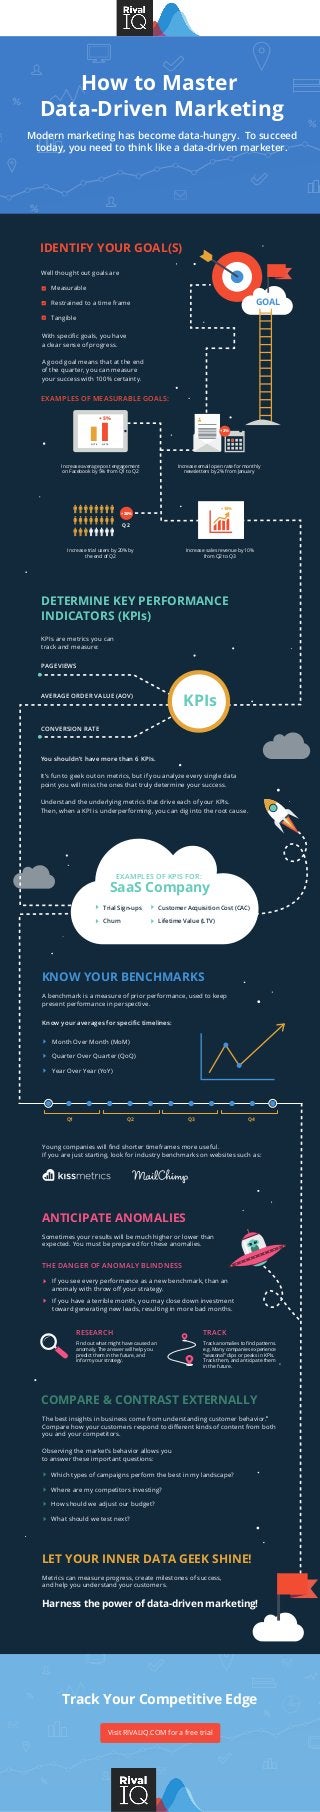
- 1. How to Master Data-Driven Marketing Modern marketing has become data-hungry. To succeed today, you need to think like a data-driven marketer. IDENTIFY YOUR GOAL(S) DETERMINE KEY PERFORMANCE INDICATORS (KPIs) KNOW YOUR BENCHMARKS Well thought out goals are EXAMPLES OF MEASURABLE GOALS: Measurable Restrained to a time frame Tangible KPIs are metrics you can track and measure: EXAMPLES OF KPIS FOR: You shouldn’t have more than 6 KPIs. It’s fun to geek out on metrics, but if you analyze every single data point you will miss the ones that truly determine your success. Understand the underlying metrics that drive each of your KPIs. Then, when a KPI is underperforming, you can dig into the root cause. Trial Sign-ups Churn Customer Acquisition Cost (CAC) Lifetime Value (LTV) PAGEVIEWS AVERAGE ORDER VALUE (AOV) CONVERSION RATE GOAL + 5% Q1’16 Q2’16 Increase average post engagement on Facebook by 5% from Q1 to Q2 Increase email open rate for monthly newsletters by 2% from January Increase trial users by 20% by the end of Q2 Increase sales revenue by 10% from Q2 to Q3 + 20% Q2 + 2% With specific goals, you have a clear sense of progress. A good goal means that at the end of the quarter, you can measure your success with 100% certainty. SaaS Company A benchmark is a measure of prior performance, used to keep present performance in perspective. ANTICIPATE ANOMALIES Sometimes your results will be much higher or lower than expected. You must be prepared for these anomalies. COMPARE & CONTRAST EXTERNALLY The best insights in business come from understanding customer behavior. Compare how your customers respond to different kinds of content from both you and your competitors. LET YOUR INNER DATA GEEK SHINE! Metrics can measure progress, create milestones of success, and help you understand your customers. Harness the power of data-driven marketing! Track Your Competitive Edge Observing the market’s behavior allows you to answer these important questions: Which types of campaigns perform the best in my landscape? Where are my competitors investing? How should we adjust our budget? What should we test next? If you see every performance as a new benchmark, than an anomaly with throw off your strategy. RESEARCH Find out what might have caused an anomaly. The answer will help you predict them in the future, and inform your strategy. TRACK Track anomalies to find patterns. e.g. Many companies experience “seasonal” dips or peaks in KPIs. Track them, and anticipate them in the future. If you have a terrible month, you may close down investment toward generating new leads, resulting in more bad months. THE DANGER OF ANOMALY BLINDNESS Know your averages for specific timelines: Young companies will find shorter timeframes more useful. If you are just starting, look for industry benchmarks on websites such as: Month Over Month (MoM) Quarter Over Quarter (QoQ) Year Over Year (YoY) Q1 Q2 Q3 Q4 + 10% KPIs Visit RIVALIQ.COM for a free trial