1. TIM Participações S.A.
TIM PARTICIPAÇÕES S.A. Announces its Consolidated
Results for the Fourth Quarter and Full Year of 2006
BOVESPA 1 Rio de Janeiro, March 6, 2007 – TIM Participações S.A. (BOVESPA: TCSL3 and
(lot of 1,000 shares) TCSL4; and NYSE: TSU), the company which controls directly TIM Celular S.A. and
TCSL3: R$10.2 indirectly TIM Nordeste S.A., announces its results for the fourth quarter (4Q06) and full
TCSL4: R$6.7
year of 2006. TIM Participações S.A. (“TIM Participações” or “TIM”) provides mobile
NYSE 1 telecommunications services through its mobile operators throughout Brazil and is the
(1 ADR = 10,000 shares) largest GSM operator in the country. The following financial and operating information,
TSU: US$30.65 except where otherwise indicated, is presented on a consolidated basis and in Brazilian
Reais (R$), pursuant to Brazilian Corporate Law. Comparisons refer to the fourth quarter
of 2005 (4Q05) and the year of 2005, except when otherwise indicated.
(1) Figures of March 05, 2007
4Q06 Highlights
4Q06 Conference Call • With the launch of “TIM Casa”, a pioneering service in Brazil which transforms
mobile handsets into house phones, the Company maintains its leadership in
Conference Call in English services innovation, reaching more than 250 thousand subscriptions after
March 6, 2007, at 11:00 am, Brasília
time. only 3 months of its launching.
(09:00 US ET)
• Strong growth in the postpaid segment: 27.9% market share in the postpaid
Conference Call in Portuguese: segment. Over the past twelve months, the postpaid subscribers’ base grew 33.4%,
March 6, 2007, at 13:00 pm, Brasília resulting in an improved client mix.
time.
(11:00 US ET) • Leader in net service revenues: R$2.7 billion in the 4Q06, 43.1% and 14.2% up
on the 4Q05 and 3Q06.
For further information, please
access the Company’s website: • Strong ARPU (average revenues per user) expansion: R$37.0 in the 4Q06,
www.timpartri.com.br 7.6% higher than the R$34.4 recorded in the previous quarter, which also
factors interconnection revenues stemming from the elimination of the Bill &
IR Contacts: Keep system.
Stefano De Angelis
CFO and Investor Relations Officer • Reduced subscriber acquisition cost (SAC): reduction of 17.8% and 9.1%
over the 3Q06 and 4Q05, respectively, driven by tight controls over variable
Joana Serafim
IR Manager
costs, especially subsidies. The 4Q06 SAC / ARPU ratio was of 3.6 months, well
(55 21) 4009-3742 / 8113-0571 below the level of previous quarters (4.4 months in 3Q06 and 4.4 months in 4Q05).
jserafim@timbrasil.com.br
• Profitable growth: EBITDA of R$ 797.5 million in the 4Q06 (17.9% up on
Leonardo Wanderley the 3Q06), and R$2,492.5 billion for the full year (67.7% up on 2005). The
IR Analyst EBITDA margin reached 27.3% in the quarter and 24.6% in the year,
(55 21) 4009-3751 / 8113-0547 4.5p.p. and 6.8p.p. higher than in the 4Q05 and 2005, respectively, notwithstanding
lwanderley@timbrasil.com.br
the negative Bill & Keep impact, in terms of margin dilution.
• Quarterly net income of R$ 78.7 million, reversing a net loss of R$ 116.1
million in the 4Q05, reflecting the continuous improvement in the Company’s
operating results.
• Substantial improvement in Operating Free Cash Flow: R$ 873.3 million R$, a R$
726.0 million increase vs. 3Q06 and R$ 341.0 million vs. 4Q05.
• TIM Participações closed the year awarded with “Top of Mind 2006” in the
mobile phone category, confirming the strength of its brand.
2. Main Regulatory and Accounting Changes
Exclusion of Partial Bill and Keep
With the introduction of the SMP (Personal Mobile Service) in 2000, Anatel created the partial
Bill & Keep concept, which meant that in calls between mobile operators in the same
registration area (locale), one operator is obliged to pay the other the interconnection charge
(VUM) only if traffic exceeds 55% of the total in either direction.
With the introduction of Resolution 438 of July 14, 2006, Anatel completely eliminated the Bill
& Keep concept, establishing a full interconnection regime, meaning that each mobile
operator will be paid for the use of its network, based on total traffic.
Prepaid Expenses (Deferral of Handset Subsidies)
Starting in the third quarter of 2006, and retroactive to January 1, 2006, Management
changed the accounting procedures for costs related to postpaid handset sales. These would
henceforth be deferred and amortized in line with the minimum permanence period stipulated
in client contracts (12 months) in order to better reflect the performance of the postpaid
segment (previously these costs were booked directly under results). The contractually
stipulated fine for clients canceling their subscriptions or changing to the prepaid system
before the minimum permanence period expires is invariably higher than the average subsidy
on each handset sale.
It is important to mention that the deferral of handset sale costs only applies to
the postpaid segment, in which clients sign an agreement to remain with the
operator for at least 12 months and are fined in case of cancellation.
Discontinued Asset Liability (Asset Retirement Obligation – ARO)
In the fourth quarter (retroactive to 2004), pursuant to CVM Resolution 489, the
Company started to use new accounting procedures, as to bring them into line with
those adopted by other companies in the telecommunications sector. Now the
estimated cost of dismantling radio towers and equipment in rented buildings will be
recognized as an obligation, as a counter-entry of permanent assets. The depreciation
of these assets is calculated based on their useful life. The estimated liability is discounted to
present value in order to reflect the best current estimate.
Pro-forma analysis of Financial Performance
On March 16, 2006, a TIM Participações S.A. Extraordinary Shareholders’ Meeting approved the
merger of all TIM Celular S.A.’s shares into TIM Participações S.A., turning the company into a
wholly-owned subsidiary of TIM Participações S.A.. For the purposes of making year-on-year
comparisons, therefore, pro-forma financial statements were drawn up as if the merger had
occurred on January 1st, 2005.
For further information, see the explanatory notes to the financial statements for
the period in question and the associated material fact, which are available on our
Investor Relations website: www.timpartri.com.br
2 / 17
3. Message from Management
Initiative and innovation are core attributes of TIM brand: we were the first operator
to implement the national integrated GSM network, which enabled us to launch front
running services, such as voice and data roaming, sending of photos and video messages, TV by
mobile phone, multimedia messages (MMS) and broadband services (EDGE), Blackberry, TIM
Casa and TIM Família, amongst others.
TIM’s performance was always sustained by four pillars: client care, skilled and
committed employees, ethical values and return to shareholders. Such pillars are
cultivated within a culture of efficiency and control, based on the principles of our True
Care philosophy – a real concern with clients’ satisfaction, certain that at the end of the day,
we have made everything under our reach to serve them well.
The Company’s greatest achievements in 2006 were only possible thanks to the
enthusiasm o of our more than 9 thousand employees, who were capable of
implementing the True Care philosophy and who worked as a team in order to transform our
aggressive growth plans into results.
The market has acknowledged our ongoing efforts. With our focus on convenience
and mobility, we are already leaders in the corporate segments, we have the client
base with best mix in postpaid and prepaid plans, considering our peers’ average,
and we reached the leadership on net service revenue in the last quarter. TIM is the
preferred brand and appreciated by consumers, even by those who are not our
clients yet.
In a country with such continental dimensions such as Brazil, the regional differences may and
should be respected. We still are the single mobile operator with nationwide presence,
but we perform with strategies that combine the best in terms of institutional image
with regional opportunities. Our promotions ally innovation and segmentation, seeking to
make the right offer to the right client, in the right place. Even VAS is already segmented, and
the results obtained show us this is the right path.
The future will still bring great novelties for us; the mobile phone, every year, is no
longer a voice instrument, but it is a relationship instrument, also comprising data, image
and multimedia.
We need to be ready for the future. We are closely tracking the evolution of all
trends, in pure mobile and those concerned with convergence. We participate in all
opportunities bringing tangible benefits to our clients and the return to our
shareholders.
The Management
3 / 17
4. Operating Performance
National The Brazilian market closed December/06 with 99.9 million lines, 15.9% up on the
penetration 86.2 million registered in December/05. National penetration reached 53.2% and
reaches showing potential growth, especially when compared to other countries in Latin America.
53.2% in
the 4Q06. Total market net additions in the quarter came to 4.0 million, compared to 6.2 million
in the same period of the previous year; the slower pace also reflects a more rational
commercial approach pursued by the main players that consisted, among others, in lower
handset subsidies especially in the pre-paid segment.
The Company added 1.3 million new clients to its base in the 4Q06, consolidating
its substantial share of sector growth (32.8% of total period additions). For the
year as a whole, the Company recorded 38.2% of annual net additions, the highest
figure in the sector.
Market TIM Participações ended the fourth quarter with 25.4 million clients, 26.0% up year-on-year,
share: and a market share of 25.4% versus 23.4% in the 4Q05.
25.4% in Thanks to such strong performance TIM Participações further reduced the market share gap
the 4Q06 vs. the incumbent to 3.7 p.p., with a sharp reduction compared to the beginning of the year (-
11.1pp), The gap vs. 3rd player remained broadly at 2 p.p.
The Company’s client base mix also improved in 2006. The postpaid base grew by
33.4%, representing 21.3% of the total base.
Client Base (thousands)
25,410.5
24,084.5
22,338.4
20,171.4 21,018.3 21.3%
20.5%
20.6%
20.6%
Strong 20.1%
growth in
the value
segment
79.9% 79.4% 79.4% 79.5% 78.7%
4Q05 1Q06 2Q06 3Q06 4Q06
Pre-paid Post-paid
At the end of the quarter, 90.8% of TIM Participações’ clients were using GSM
TIM: the technology. TIM’s GSM coverage reached 91.6% of the country’s urban population, serving
largest GSM 2,453 municipalities. All municipalities with GSM also have access to GPRS, while 456 have the
client base
additional benefit of EDGE technology. These innovations facilitate access to and encourage
clients to use data and multimedia services, leading to strong VAS revenue growth.
4 / 17
5. Marketing Activities
TIM was strongly positioned in the market value segment throughout 2006,
offering clients complete communication solutions and constantly seeking
innovations to encourage frequent cell-phone use, such as TIM Casa and TIM
Família.
“TIM Casa”, an exclusive TIM service available nationwide for new and current
clients, includes a package of minutes for fixed local calls, at a lower cost than those of a
fixed line monthly subscription
The “TIM Família” plan is another pioneering initiative of TIM. It is an exclusive
service that allows the inclusion of up to nine dependents, which can make free
calls among them and share integrated voice and VAS service packages, in addition
to discounts on local fixed calls.
The “TIM Recarga Fácil” promotion was designed to further encouragement to
recharging. Clients who effect a R$15 recharge, for example, receive five minutes of free
local calls to TIM handsets and fixed phones.
In the VAS segment, TIM clients can take advantage of an ever increasing range of
interactive services. They can now use their cell phones to take part in polls and quizzes, as
well as send comments and compete for prizes.
In the final quarter, when promotions are geared towards the festive period, TIM
continued to encourage local intra-network calls, allowing a substantial reduction
in prepaid handset subsidies. In this context, the Company launched the “7 centavos”
promotion, with a highly competitive tariff on intra-network local calls for postpaid and prepaid
clients, through July/07.
TIM launched a sales-automation system for its consultants dedicated to attend
small and middle companies, named “TIM e-Vendas Móvel”. This system not only
allows a more efficient management of the entire sales process by enabling on-line
access through PDAs and generation of sales visit reports, but also can be
customized for another business applications.
All these initiatives exemplify the Company’s continuous drive to acquire and retain clients and
are sustained by the strength of the TIM brand, its constant innovation and client
segmentation, as well as customized promotions.
5 / 17
6. Financial Performance
Selected Figures 1
R$ thousand
4Q06 4Q05 % Y-o-Y 3T06 % Q-o-Q 4Q06 4Q05 % Y-o-Y
Total Gross Revenue 4,093,955 3,260,442 25.6% 3,692,860 10.9% 13,877,559 11,232,604 23.5%
Gross Service Revenue 3,542,483 2,536,928 39.6% 3,157,578 12.2% 11,820,276 8,962,547 31.9%
Gross Handset Revenue 551,472 723,514 -23.8% 535,282 3.0% 2,057,283 2,270,057 -9.4%
Total Net Revenue 2,918,038 2,408,758 21.1% 2,745,870 6.3% 10,116,113 8,368,052 20.9%
Net Services Revenue 2,734,774 1,910,664 43.1% 2,394,327 14.2% 8,933,528 6,795,047 31.5%
Net Handsets Sales 183,263 498,094 -63.2% 351,543 -47.9% 1,182,585 1,573,005 -24.8%
EBITDA 797,547 550,336 44.9% 676,663 17.9% 2,492,460 1,485,856 67.7%
EBITDA Margin 27.3% 22.8% 4.5 p.p. 24.6% 2.7 p.p. 24.6% 17.8% 6.8 p.p.
EBIT 200,313 21,518 830.9% 98,902 102.5% 207,572 (429,035) -
EBIT Margin 6.9% 0.9% 6.0 p.p. 3.6% 3.3 p.p. 2.1% -5.1% 7.2 p.p.
Net Income (Loss) 78,691 (116,088) - 20,345 286.8% (301,683) (989,561) -69.5%
Nota: (1) Consolidated figures
Operating revenues
Total net revenues came to R$2,918.0 million in the 4Q06 (21.1% up year-on-year),
and R$10,116.1 million for the full year, 20.9% up on the R$8,368.1 million registered in
2005.
Leadership
in net Net service revenue accounted for R$2,734.8 million in the quarter, 43.1% more
service than the R$1,910.7 million recorded in the 4Q05, underlining the Company’s
revenue in continuous growth and ensuing its lead of the national mobile segment in the
the 4Q06 4Q06.
In 2006 as a whole, net service revenue totaled R$8,933.5 million, 31.5% up on 2005. This
growth was primarily due to the continuing expansion of traffic and value-added services
(VAS), underlining the quality of TIM’s subscriber base, and also thanks to the positive impact
of the Bill & Keep elimination. It is worth to mention that, considering partial Bill & Keep
system elimination on January 1, 2005, the annual service revenue would grow by 22%, on a
YoY comparison.
Net handset revenues totaled R$ 183.3 million in the 4Q06, 63.2% down year-on-
year, and R$1,182.6 million in 2006 versus R$1,573.0 million in 2005. During 2006,
the Company substantially reduced its participation on prepaid handset sales volume (-30.8%
year-on-year in the 4Q06 and -24.2% in 2006 over 2005), besides of stimulating SIM Card
selling offer, with “TIM Chip Only” promotion.
In addition, as of the 4Q06, consumer handset discounts are fully booked as
“discounts on goods sold”, instead of being partially allocated to selling expenses
as before.
6 / 17
7. ARPU: Average revenue per user (ARPU) totaled R$ 37.0 in the 4Q06, 7.6% up on the
Strong quarter before (R$34.4), which also includes the positive impact of the Bill & Keep
4Q06 vs. elimination. This growth reflected, the campaigns adopted by the company to stimulate
3Q06 usage, the high quality of the customers acquired in the quarter and the period’s seasonality,
expansion characterized by increased service usage.
It is important to point out the company’s continuous efforts to encourage the use
of value added services (VAS), which complement the service plans in all
segments. Gross VAS revenues stood at R$ 250.8 million in the 4Q06 and R$ 886.2
million in the year, 42.2% and 51.7% higher, respectively, than the expansion recorded in
the same periods in 2005. Innovative services (MMS, GPRS, downloads, etc) accounted
for39.4% of these revenues in the fourth quarter. In the last quarter of 2006, VAS gross
revenue accounted for 7.1% of gross service revenue, 0.1 p.p. higher on a YoY comparison
(7.5% in 2006, 1.0 p.p. higher when compared to 2005).
Operating Costs and Expenses
Network and interconnection costs stood at R$950.0 million in the quarter, versus
Interconnection
R$398.0 million in the 4Q05, and R$2,664.8 million for the year (60.2% up on the
costs reflect
the elimination R$1,663.6 million recorded in 2005). The increase chiefly reflects the elimination of the Bill &
of the Bill & Keep system, meaning that the Company now pays the interconnection charge on every local
Keep call to other mobile operators, and the impressive growth in traffic volume (+31.2% in 2006
versus 2005), basically due to the expansion of the client base.
The cost of goods sold – basically comprising handset and accessory sales – totaled
R$ 289.7 million in the 4Q06, versus R$515.9 million in the same period the year
before. In 2006 as a whole, these costs represented R$ 1,407.8 million, against R$ 1,719.8
million in 2005. The quarterly and annual reductions were mainly due to: (i) the change in the
consumer segment strategy, represented by the elimination of prepaid handset subsidies and
the “SIM card” solely sales drive through the “TIM Chip Only” promotion; (ii) the annual
reduction in handset sales volume (5.5 million, versus 7.3 million in 2005), combined with a
change on handsets mix, reflecting the strong sales expansion of more sophisticated handsets,
of medium and high value; (iii) the deferral of postpaid handsets subsidies, applied to the
previous 12 months (R$ 24.2 million positive impact in 4Q06 and R$ 160 million in 2006); and
(iv) discounts on the sales of handsets to final consumer, previously booked as cost of goods
sold and are now booked as discounts on handsets sales.
Quarterly selling and marketing expenses came to R$519.9 million, 15.9% and
7.0% less than the 4Q05 and 3Q06, respectively, primarily due to a higher efficiency of
sales channels and the increase in chip sales in the prepaid segment, thereby reducing
commissions, partially offset by more acquisitions in the postpaid segment.
Subscriber acquisition costs (SAC) stood at R$ 120 in the 4Q06 and R$ 145 in the
year, down by 9.1% and 8.2% year-on-year, respectively, reflecting the drastic
reduction in handset subsidies in the prepaid segment, practically eliminated in the 4Q06,
which accounted for 77.7% of gross annual additions. As a result, the SAC/ARPU ratio fell
from 4.4 months in the 4Q05 to 3.6 months in the 4Q06, and from 5.0 months in 2005 as a
whole to 4.6 months in 2006.
G&A expenses - excluding depreciation, amortization and personnel expenses -
totaled R$ 101.6 million in the 4Q06, in line with the R$100.3 million recorded in the
4Q05. In 2006, these expenses totaled R$ 434.4 million, versus R$ 391.3 million the year
before. The increase reflects the upturn in IT service costs, combined with non-recurring
7 / 17
8. expenses from the corporate restructuring, and the implementation of the internal control
procedures to meet the requirements of Sarbanes Oxley Law.
Quarterly and annual personnel expenses amounted to R$ 149.1 million and
R$594.9 million respectively. The 17.7% year-on-year increase basically reflects the
interim staff increase, represented by the hiring of 485 new employees in order to improve
customer service and client relations, as well as pre and post-sales support.
Bad debt as a Bad debt expenses totaled R$ 123.3 million in the 4Q06, representing 3.0% of
percentage of total gross revenues, compared to 3.0% and 3.4% in the 4Q05 and 3Q06, respectively. In
total gross 2006, these expenses totaled R$452.0 million, virtually stable in percentage-of-gross-revenue
revenues terms, notwithstanding the strong 33.4% growth in the postpaid client base.
remains stable
Other net operating revenues came to R$ 13.1 million versus R$ 6.5 million in the
4QO5. Other operating revenues basically comprise fines paid by clients related to past due
payments or service cancellations, unpaid dividends, etc., partially offset by expenses from
provisions for contingencies and various taxes on financial transactions. In 2006, net
operating revenue totaled R$103.7 million, versus R$ 0.3 million net expense in
2005. These revenues include non-recurring revenue from the reversal and
recovery of PIS and COFINS taxes, following a judicial verdict in favor of the
subsidiary TIM Nordeste S.A, representing R$ 33.8 million and R$ 52.3 million,
respectively, both allocated in the 1H06.
EBITDA
Fourth-quarter EBITDA (operating result before net financial expenses, excluding
depreciation and amortization) totaled R$ 797.5 million, 44.9% up on the 4Q05 and
17.9% up on the previous quarter.
Annual EBITDA came to R$ 2,492.5 million, 67.7% up on the year before, underlining
the Company’s commitment to combining solid growth with quality of the clients and
profitability.
The EBITDA margin stood at 27.3% in the 4Q06 and 24.6% in 2006, 4.5 p.p and
6.8 p.p. up on the 4Q05 and 2005.
It is worth to mention that the adjusted EBITDA margin, considering the Bill &
Keep system elimination on January 1, 2005 would be of 23% in 2006, 7.3 p.p.
higher than 2005 (15.7%), confirming our efforts to combine strong growth with
healthy profitability expansion.
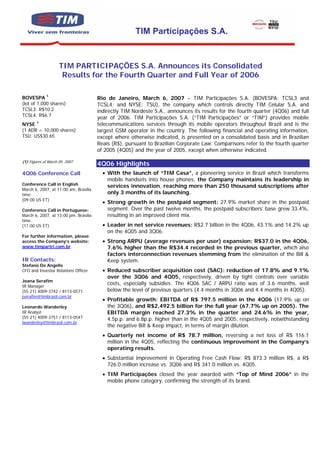
EBITDA
R$ Mln R$ Mln
+45% +68%
797.5 1,485.9 2,492.5
550.3
4Q05 4Q06 2005 2006
8 / 17
9. EBITDA Margin
24.6%
27.3%
23.0%
17.8%
22.9% 21.5%
15.7% (excluding
20.1% deferral of
handsets
4Q06 2005 2006 subsidies)
4Q05
EBITDA Margin Reported
EBITDA Margin Adjusted (Excluding the effect of B&K elimination from Jan 1st, 2005)
Depreciation and Amortization
Quarterly depreciation and amortization expenses amounted to R$ 597.2 million,
12.9% higher than the R$ 528.8 million posted in the 4Q05. In 2006, these
expenses totaled R$2,284.9 million, 19.3% more than the R$1,914.9 million
registered in 2005. Both increases reflect network and IT infrastructure expansion and
improvement.
EBIT
Continuous EBIT (operating result before interest and taxes) totaled R$200.3 million in the 4Q06,
EBIT 830.9% up year-on-year and 102.5% up quarter-over-quarter. Annual EBIT came
recovery: to R$207.6 million, a R$636.6 million improvement over the negative R$429.0
+6.3pp in reported in 2005. The corresponding EBIT margin was 6.9% and 2.1%, up 6.0 p.p. year-
2006 on-year and 7.2 p.p. in annual basis.
Net Financial Result
Net financial expenses totaled R$90.8 million for the quarter, 15.6% lower than
the R$107.5 million expense reported in the 4Q05. For the year as a whole, the
Company recorded a net financial expense of R$ 343.0 million, 7.9% down on the R$372.6
million expense in 2005. It is important to mention that the new accounting practices,
whereby the obligations related to the estimated cost of dismantling radio towers
and equipment in rented properties is recognized (ARO), resulted in a R$26.5
million increase in the 4Q06 financial expenses.
Indebtedness
At the close of the fourth quarter, the Company’s net debt (total debt less cash and
cash equivalents) totaled R$ 1,027.0 million, 42.5% down on the R$ 1,787.0 million
at the end of the 3Q06.
Free operating cash flow was R$ 873.3 million positive, a substantial improvement over the
Positive 3Q06 (R$ 147.3 million), and 4Q05 (R$ 532.3 million).
operating
cash flow Is important to mention that the significant improvement in these results, and the
consequently indebtedness reduction reflect the positive operating results in the
9 / 17
10. 4Q06, the seasonal increase in purchase volume related to CAPEX (44% of the
Company’s annual investment was spent in the 4Q06) and selling activities, mainly
related with the acquisition of mobile handsets.
At the close of 2006, gross debt stood at R$ 2,220.4 million, compared to the
R$1,870.0 million recorded at the end of 2005. The Company’s debt mostly comprises
long-term loans and financing from the BNDES (National Development Bank) and the BNB
(Blanco do Nordeste do Brasil). Cash and cash equivalents amounted to R$ 1,193.5
million in the 4Q06, mainly made up of highly liquid financial investments.
Net Result
TIM Participações closed the 4Q06 with a net income of R$ 78.7 million, showing a
Net income rapid improvement in the Company’s operating results following the consolidation
of R$78.7
of the TIM Brasil companies in the 1Q06. This figure represented a R$194.8 million
million in
the 4Q06 improvement over the net loss of R$116.1 million in the 4Q05. In 2006 as a whole, net income
climbed by R$989.6 million over the year before.
CAPEX
Investments totaled R$ 693 million in the fourth quarter, giving R$1,588.0 million
CAPEX of R$
1.6 billion in
for the year (versus R$1.1 billion in the 4Q05 and R$2.6 billion in 2005), not including the
2006 amount of R$ 21.3 million related to the obligations derived from the discontinued assets
(Assets Retirement Obligation – ARO), 52% of which allocated to the expansion and
improvement of the GSM network’s capacity and quality. Thanks to strong client base growth
and a higher number of launchings of new services, 26% of CAPEX went to developing and
improving IT systems; and 20% to the commodatum program, part of the Company’s
expansion and loyalty-building strategy for the corporate segment and others.
Dividends
Management Despite the Company’s net loss in 2006, management is proposing the distribution to
proposes shareholders as dividends, equivalent to R$ 0.1933 per lot of 1,000 common and preferred
dividend shares and R$1.9330 per ADR (10,000 preferred shares) through the partial realization of the
payments expansion reserve, in the amount of R$450.8 million, and. The proposal will be analyzed at the
Company’s Annual Shareholders’ Meeting to be held in April 2007.
10 / 17
11. About TIM Participações S.A.
TIM Participações is controlled by TIM Brasil Serviços e
Participações S.A., a subsidiary of the Telecom Italia Group.
TIM Participações offers GSM technology – “Global System
for Mobile Communications” - the most widely used in the
world. At the end of December 2006, its network covered
91.6% of the Brazilian urban population.
The cities covered by the GSM network also have access to
GPRS, while 459 cities have the additional benefit of EDGE
technology. These are innovations that facilitate the use of
data and multimedia services across the country.
The Company is proud to offer one of the widest product
and service portfolios in the sector, with specific solutions
for different client needs.
Only company with nationwide presence
“TOP of MIND” in 2006
Second largest company in terms of client
numbers
Largest GSM operator in terms of client
numbers
Leader in business segment
Leader in the service revenue in the
mobile nation market
This document may contain forward-looking statements. Such statements are not statements of historical
fact and reflect the beliefs and expectations of the Company's management. The words "anticipates”,
"believes”, "estimates”, "expects”, "forecasts”, "plans”, "predicts”, "projects”, "targets" and similar words
are intended to identify these statements, which necessarily involve known and unknown risks and
uncertainties foreseen, or not, by the Company. Therefore, the Company’s future operating results may
Disclaimer differ from current expectations and readers of this release should not base their assumptions exclusively
on the information given herein. Forward-looking statements only reflect opinions on the date on which
they are made and the Company is not obliged to update them in light of new information or future
developments.
11 / 17
12. EXOS
ATTACHMENTS
Attachment 1: Balance Sheet (BR GAAP)
Attachment 2: Income Statements (BR GAAP)
Attachment 3: Cash Flow Statements (BR GAAP)
Attachment 4: EBITDA Calculation Statement (BR GAAP)
Attachment 5: Consolidated Operational Indicators
Attachment 6: Glossary
The Complete Financial Statements, including Explanatory Notes are available at the
Company’s Investor Relations Website: www.timpartri.com.br
12 / 17
13. Attachment 1
TIM PARTICIPAÇÕES S.A.
Balance Sheet (BR GAAP) (R$ Thousand)
DESCRIPTION 2006 2005 %
ASSETS 14.200.105 15.233.942 -6,8%
CURRENT ASSETS 4.443.021 4.461.579 -0,4%
Cash and bnks 440.866 519.300 -15,1%
Fianancial assets 752.611 1.253.300 -39,9%
Accounts receivable 2.505.833 2.071.631 21,0%
Inventories 164.108 215.242 -23,8%
Recoverable Taxes 292.542 242.168 20,8%
Deferred income and social contribution taxes 50.450 103.118 -51,1%
Prepaid expenses 221.008 43.730 405,4%
Other current assets 15.603 13.090 19,2%
NON CURRENT 9.757.084 10.772.363 -9,4%
Non current assets
Related parties 16.303 8.836 84,5%
Recoverable Taxes 285.681 297.634 -4,0%
Deferred income and social contribution taxes 29.429 133.510 -78,0%
Judicial deposits 57.420 39.716 44,6%
Prepaid expenses 13.257 19.719 -32,8%
Other 7.191 3.047 136,0%
PERMANENT ASSETS
Investments 6.728 8.310 -19,0%
Intangible 1.922.621 2.170.858 -11,4%
Fixed assets 7.185.864 7.815.808 -8,1%
Deferred 232.590 274.925 -15,4%
LIABILITIES 14.200.105 15.233.942 -6,8%
CURRENT LIABILITIES 4.135.122 4.392.241 -5,9%
Loans and financing 340.762 216.147 57,7%
Suppliers 2.642.858 3.419.596 -22,7%
Salaries and related charges 92.493 94.428 -2,0%
Taxes, charges and contributions 370.264 357.328 3,6%
Related parties 84.064 73.902 13,8%
Authorizatios payable 472.958 141.606 234,0%
Trade accounts payable 38.275 34.792 10,0%
Other 93.448 54.442 71,6%
NON-CURRENT 2.178.605 2.219.018 -1,8%
Loans and financing 1.879.679 1.653.895 13,7%
Trade accounts payable 6.542 8.755 -25,3%
Taxes, charges and contributions - 4.634 -100,0%
Provision for contingencies 128.133 145.722 -12,1%
Supplementary pension plan 6.083 3.584 69,7%
ARO 158.168 397.427 -60,2%
Others - 5.001
SHAREHOLDERS' EQUITY 7.886.378 8.622.683 -8,5%
Capital 7.512.710 7.455.859 0,8%
Capital reserves 135.230 192.081 -29,6%
Income reserves 238.438 974.743 -75,5%
13 / 17
17. Attachment 6
Glossary
Operating indicators
Financial Terms
Customers = Number of wireless lines in service
EBIT = Earnings before interest and tax
Gross additions = Total of customers acquired in the
EBITDA = Earnings before interest, tax, depreciation and
period
amortization
Net additions = Gross Additions – number of customers
EBITDA Margin = EBITDA/ Net Operating Revenue
disconnected
CAPEX – (capital expenditure) capital investment
Market share = Company ’s total number of customers /
Subsidy = (net revenue from goods – cost of sales + vendors
number of customers in its operating area
discounts) / gross additions
Marginal Market share = participation of estimated net
Net debt = gross debt – cash
additions in the operating area.
PL – Shareholders ’ Equity
Market penetration = Company ’s total number of
customers + estimated number of customers of
competitors / each 100 inhabitants in the Company ’s
Technology and Services operating area
Churn rate = number of customers disconnected in the
TDMA = Time Division Multiple Access period
GSM = Global System for Mobile Communications – A system ARPU = Average Total Net Service Revenue per
–
storing and coding cell phone data, such as user calls and per customers in the period
data, enabling a user to be recognized anywhere in the Blended ARPU = ARPU of the total customer base
country by the GSM network. The GSM is now the standard (contract + prepaid)
most used in the world. Contract ARPU = ARPU of contract service customers
EDGE = Enhanced Data rates for Global Evolution – Prepaid ARPU = ARPU of prepaid service customers
technique developed to increase the speed of data MOU = minutes of use – monthly average. in minutes of
transmission via cell phone, creating a real broadband for traffic per customer = (Total number of outgoing minutes +
handsets with the GSM technology. The first EDGE handsets incoming minutes) / monthly average of customers in the
available offer speeds that can reach up to 200 Kbps, period
depending on the handset model. Contract MOU = MOU of contract service customers
SMS = Short Message Service – ability to send and receive Prepaid MOU = MOU of prepaid service customers
alphanumerical messages. SAC = Customer acquisition cost = (marketing expenses
+ commission + Fistel + “ comodato ” + costs of retention)
17 / 17