Projections of Future Tropical Cyclone Activity
•
1 gefällt mir•644 views

Projections of Future Tropical Cyclone Activity Isaac Ginis GSO/URI

Empfohlen
Empfohlen
Weitere ähnliche Inhalte
Was ist angesagt?
Was ist angesagt? (20)
Andere mochten auch
Ähnlich wie Projections of Future Tropical Cyclone Activity
Ähnlich wie Projections of Future Tropical Cyclone Activity (20)
Mehr von riseagrant
Mehr von riseagrant (20)
Kürzlich hochgeladen
Kürzlich hochgeladen (20)
Projections of Future Tropical Cyclone Activity
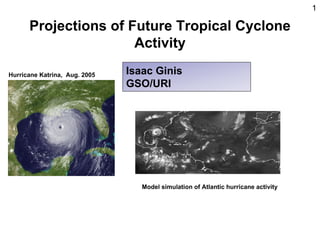
- 1. 1 Projections of Future Tropical Cyclone Activity Hurricane Katrina, Aug. 2005 Isaac Ginis GSO/URI Model simulation of Atlantic hurricane activity
- 2. The zero line is determined from the global mean temperature during the period from 1951 to 1980. The black line is the annual mean and the solid red line is the five-year mean. The green bars show uncertainty estimates.
- 3. There is strong relationship between SST and the hurricane activity (hurricane power) in the Atlantic basin. Increasing data uncertainty Hurricane power (PDI) is proportional to the time integral of the cube of the surface wind speeds accumulated across all storms over Source: Kerry Emanuel, J. Climate (2007). their entire life cycles.
- 4. Atlantic tropical storms (< 2 day duration) show a strong rising trend, but storms of >2 day duration--adjusted for missing storms--do not show a trend.
- 5. United States landfalling hurricanes do not show any long-term trend since 1851
- 6. IPCC Projections of Future Changes in Climate IPCC best estimate for low scenario (B1) is 1.8°C (likely range is 1.1°C to 2.9°C), and for high scenario (A1FI) is 4.0°C (likely range is 2.4°C to 6.4°C). Broadly consistent with span quoted for SRES in TAR, but not directly comparable Source: IPCC 4th Assessment Report.
- 7. Two future projections of Atlantic hurricane power Projection 1: Absolute SST • ~300% projected increase in Power Dissipation • Indirect attribution: CO2 Atlantic SST Hurricanes Projection 2: Relative SST • Projected change: sign uncertain, +/- 80% • Indirect attribution: CO2 Atlantic SST – Global SST Hurricanes • Supported by dynamical models Source: Vecchiet al. Science (2008)
- 8. Example of a regional model that reproduces the interannual variability and trend of Atlantic hurricane counts (1980-2006) 18-km grid model nudged toward large-scale (wave 0-2) NCEP Reanalyses Source: Knutson et al., 2007, Bull. Amer. Meteor. Soc.
- 9. The 26.5oC “threshhold temperature” for Atlantic tropical storm formation: a climate dependentthreshhold, which may increase to ~28.5oC by the late 21st century with climate warming. Note the decrease in overall number of storms in the warmer climate Source: Knutson et al., 2008, Nature Geoscience.
- 10. Example of a “double-downscaling” method used to explore frequencies and intensities of Atlantic hurricanes at high resolution Geophysical Fluid Dynamics Laboratory/NOAA
- 12. SUMMARY OF PROJECTED CHANGE Cat 4+5 frequency: 81% increase, or 10% per decade Estimated net impact of these changes on damage potential: +28% • Colored bars show changes for the18 model CMIP3 ensemble (27 seasons); dots show range of changes across 4 individual CMIP models (13 seasons). Source: Bender et al., Science, 2010.
- 13. Late 21st Century Climate Warming Projection-- Average of 18 CMIP3 Models (27 Simulated Hurricane Seasons) Source: Bender et al., Science, 2010
- 14. Author Team: Tom Knutson, Co-Chair Geophysical Fluid Dynamics Laboratory/NOAA, Princeton, USA John McBride, Co-Chair Center for Australian Weather and Climate Research, Melbourne, Australia Johnny Chan University of Hong Kong, Hong Kong, China Kerry Emanuel Massachusetts Institute of Technology, Cambridge, USA Greg Holland National Center for Atmospheric Research, Boulder, USA Chris Landsea National Hurricane Center/NOAA, Miami, USA Isaac Held Geophysical Fluid Dynamics Laboratory/NOAA, USA Jim Kossin National Climatic Data Center/NOAA, Madison, USA A.K. Srivastava India Meteorological Department, Pune, India Masato Sugi Research Institute for Global Change/JAMSTEC, Yokohama, Japan
- 15. SUMMARY ASSESSMENT: Detection and Attribution: It remains uncertain whether past changes in any tropical cyclone activity (frequency, intensity, rainfall, etc.) exceed the variability expected through natural causes, after accounting for changes over time in observing capabilities.
- 16. SUMMARY ASSESSMENT: Tropical Cyclone Projections: Frequency It is likely that the global frequency of tropical cyclones will either decrease or remain essentially unchanged due to greenhouse warming. We have very low confidence in projected changes in individual basins. Current models project changes ranging from -6 to - 34% globally, and up to ± 50% or more in individual basins by the late 21st century. “Likely”: >67% probability of occurrence, assessed using expert judgment
- 17. SUMMARY ASSESSMENT: Tropical Cyclone Projections: Intensity Some increase in mean tropical cyclone maximum wind speed is likely (+2 to +11% globally) with projected 21st century warming, although increases may not occur in all tropical regions. The frequency of the most intense (rare/high-impact) storms will more likely than not increase by a substantially larger percentage in some basins. “More likely than not”: >50% probability of occurrence, assessed using expert judgment
- 18. SUMMARY ASSESSMENT: Tropical Cyclone Projections: Rainfall Tropical cyclone rainfall rates are likely to increase. The projected magnitude is on the order of +20% within 100 km of the tropical cyclone center.
- 19. SUMMARY ASSESSMENT: Tropical Cyclone Projections: Genesis, Tracks, Duration, and Surge Flooding • We have low confidence in projected changes in genesis location, tracks, duration, or areas of impact. Existing model projections do not show dramatic large-scale changes in these features. • The vulnerability of coastal regions to storm surge flooding is expected to increase with future sea level rise and coastal development, although this vulnerability will also depend on future storm characteristics.
- 20. Implications to Rhode Island • Continued sea level rise means that storm surges and waves ride on a higher base level, causing storm surge impacts such as coastal erosion, even from minor storms, to increase, possibly dramatically. • Increased hurricane rainfall rates and intensity would increase the risk of coastal and inland flood and wind damage in areas affected by landfalling hurricanes.