

Empfohlen
Empfohlen
Weitere ähnliche Inhalte
Was ist angesagt?
Was ist angesagt? (20)
Ähnlich wie HIV/AIDS 2008 For Civics C
Ähnlich wie HIV/AIDS 2008 For Civics C (20)
Mehr von Richard Walls
Kürzlich hochgeladen
Kürzlich hochgeladen (20)
HIV/AIDS 2008 For Civics C
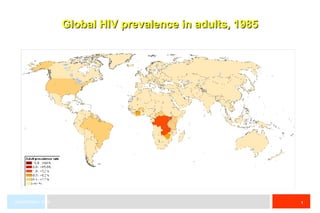
- 1. Global HIV prevalence in adults, 1985 UNAIDS/WHO, 2006
- 2. Global HIV prevalence in adults, 1995 UNAIDS/WHO, 2006
- 3. Global HIV prevalence in adults, 2005 UNAIDS/WHO, 2006
- 4. July 2008 e Global summary of the AIDS epidemic, December 2007 Total 33 million [30 – 36 million] Adults 30.8 million [28.2 – 34.0 million] Women 15.5 million [14.2 – 16.9 million] Children under 15 years 2.0 million [1.9 – 2.3 million] Total 2.7 million [2.2 – 3.2 million] Adults 2.3 million [1.9 – 2.8 million] Children under 15 years 370 000 [330 000 – 410 000] Total 2.0 million [1.8 – 2.3 million] Adults 1.8 million [1.6 – 2.1 million] Children under 15 years 270 000 [250 000 – 290 000] Number of people living with HIV in 2007 People newly infected with HIV in 2007 AIDS deaths in 2007
- 6. Estimated number of people living with HIV and adult HIV prevalence Global HIV epidemic, 1990–2007; and, HIV epidemic in Sub-Saharan Africa, 1990–2007 Number of people living with HIV % HIV prevalence, adult (15–49) % HIV prevalence, adult (15 – 49) Number of people living with HIV (millions) % HIV prevalence, adult (15 – 49) Number of people living with HIV (millions) These bars indicate the range around the estimate NOTE: Even though the HIV prevalence stabilized in Sub-Saharan Africa, the actual number of people infected continues to grow because of ongoing new infections and increasing access to antiretroviral therapy. Global HIV epidemic, 1990–2007 HIV epidemic in Sub-Saharan Africa, 1990–2007 0 10 20 30 40 0 1.0 2.0 3.0 4.0 1990 ‘ 91 ‘ 92 ‘ 93 ‘ 94 ‘ 95 ‘ 96 ‘ 97 ‘ 98 ‘ 99 2000 ‘ 01 ‘ 02 ‘ 03 ‘ 04 ‘ 05 ‘ 06 2007 1990 ‘ 91 ‘ 92 ‘ 93 ‘ 94 ‘ 95 ‘ 96 ‘ 97 ‘ 98 ‘ 99 2000 ‘ 01 ‘ 02 ‘ 03 ‘ 04 ‘ 05 ‘ 06 2007 0 5 10 15 20 25 30 0 3.0 6.0 9.0 12.0 15.0
- 7. A global view of HIV infection 33 million people [ 30–36 million ] living with HIV, 2007
- 8. July 2008 e Total: 33 million (30 – 36 million) Western & Central Europe 730 000 [580 000 – 1.0 million] Middle East & North Africa 380 000 [280 000 – 510 000] Sub-Saharan Africa 22.0 million [20.5 – 23.6 million] Eastern Europe & Central Asia 1.5 million [1.1 – 1.9 million] South & South-East Asia 4.2 million [3.5 – 5.3 million] Oceania 74 000 [66 000 – 93 000] North America 1.2 million [760 000 – 2.0 million] Latin America 1.7 million [1.5 – 2.1 million] East Asia 740 000 [480 000 – 1.1 million] Caribbean 230 000 [210 000 – 270 000] Adults and children estimated to be living with HIV, 2007
- 9. July 2008 e Estimated number of adults and children newly infected with HIV, 2007 Western & Central Europe 27 000 [14 000 – 49 000] Middle East & North Africa 40 000 [20 000 – 66 000] Sub-Saharan Africa 1.9 million [1.6 – 2.1 million] Eastern Europe & Central Asia 110 000 [67 000 – 180 000] South & South-East Asia 330 000 [150 000 – 590 000] Oceania 13 000 [12 000 – 15 000] North America 54 000 [9600 – 130 000] Latin America 140 000 [88 000 – 190 000] East Asia 52 000 [29 000 – 84 000] Caribbean 20 000 [16 000 – 25 000] Total: 2.7 million (2.2 – 3.2 million)
- 10. July 2008 e Estimated adult and child deaths from AIDS, 2007 Total: 2.0 million (1.8 – 2.3 million) Western & Central Europe 8000 [4800 – 17 000] Middle East & North Africa 27 000 [20 000 – 35 000] Sub-Saharan Africa 1.5 million [1.3 – 1.7 million] Eastern Europe & Central Asia 58 000 [41 000 – 88 000] South & South-East Asia 340 000 [230 000 – 450 000] Oceania 1000 [<1000 – 1400] North America 23 000 [9100 – 55 000] Latin America 63 000 [49 000 – 98 000] East Asia 40 000 [24 000 – 63 000] Caribbean 14 000 [11 000 – 16 000]
- 11. July 2008 e Western & Central Europe 1300 [<1000 – 1800] Middle East & North Africa 26 000 [18 000 – 34 000] Sub-Saharan Africa 1.8 million [1.7 – 2.0 million] Eastern Europe & Central Asia 12 000 [9100 – 15 000] South & South-East Asia 140 000 [ 110 000 – 180 000 ] Oceania 1100 [1200] North America 4400 [2600 – 7300] Latin America 44 000 [37 000 – 58 000] East Asia 7800 [5300 – 11 000] Caribbean 11 000 [9400 – 12 000] Children (<15 years) estimated to be living with HIV, 2007 Total: 2.0 million (1.9 – 2.3 million)
- 12. July 2008 e Estimated number of children (<15 years) newly infected with HIV, 2007 Total: 370 000 (330 000 – 410 000) Western & Central Europe <200 [<100] Middle East & North Africa 5700 [3800 – 8000] Sub-Saharan Africa 330 000 [300 000 – 360 000] Eastern Europe & Central Asia 3200 [2400 – 4300] South & South-East Asia 21 000 [14 000 – 29 000] Oceania <1000 North America < 500 [<200] Latin America 4600 [4200 – 8300] East Asia 2000 [1200 – 3100] Caribbean 1800 [1500 – 2100]
- 13. July 2008 e Western & Central Europe <200 Middle East & North Africa 4400 [3300 – 5400] Sub-Saharan Africa 240 000 [220 000 – 260 000] Eastern Europe & Central Asia 1600 [1100 – 2200] South & South-East Asia 17 000 [13 000 – 20 000] Oceania <500 North America <200 [<100 – <500] Latin America 3100 [2300 – 4400] East Asia 1200 [<1000 – 1900] Caribbean 1200 [<1000 – 1400] Estimated deaths in children (<15 years) from AIDS, 2007 Total: 270 000 (250 000 – 290 000)
- 14. HIV prevalence (%) among 15–24 years old, by sex, selected countries, 2005–2007 0 5 10 15 20 25 % HIV prevalence Swaziland South Africa Zimbabwe Central African Republic Côte d'Ivoire Sierra Leone Rwanda Haiti Guinea Ethiopia Benin DR Congo Niger Senegal Cambodia India Uganda Chad Dominican Republic Mali Female Male
- 15. Dorrington RE, Johnson LF, Bradshaw D, Daniel T. The demographic impact of HIV/AIDS in South Africa. National and provincial indicators for 2006. HIV prevalence by sex and age in South Africa, 2006
- 16. Comprehensive knowledge of HIV among young people (ages 15–24), 1999–2007 1999 –2003 2010 2004–2007 0 20 40 60 80 100 % Year Male Female 2005 Target 2010 Target Source : MEASURE DHS (2008)
- 17. Percentage of most-at-risk populations reached with HIV prevention programmes, 2005–2007 Sex workers Injecting drug users Men having sex with men % Median 60.4%* (39 countries) 46.1%** (15 countries) 40.1%* (27 countries) 20 50 80 60 70 0 10 30 40 90 100 * Percentage of sex workers and men having sex with men reported knowing where they can receive an HIV test and that they were given condoms. ** Percentage of injecting drug users who reported knowing where they could receive an HIV test and be provided with condoms and sterile injecting needles and syringes. Source : UNGASS Country Progress Reports 2008
- 18. Number of people receiving antiretroviral drugs in low- and middle income countries, 2002−2007 Source : Data provided by UNAIDS & WHO, 2008. end- 2002 end- 2004 end- 2003 end- 2005 0.4 0.8 1.2 1.6 2.2 2.8 Millions Year 2.4 2.6 3.0 0.0 0.2 0.6 1.0 1.4 1.8 2.0 end- 2007 end- 2006 North Africa and the Middle East Eastern Europe and Central Asia East, South and South-East Asia Latin America and the Caribbean Sub-Saharan Africa
- 19. Per capita HIV expenditures from domestic public sources in low- and middle-income countries, 2004–2007 Year 2004 2006 2005 2007 4 8 12 0 2 6 10 14 US$ Sub-Saharan Africa Upper middle income countries Rest of the world Upper middle income countries Rest of the world Low and lower middle income countries Sub-Saharan Africa Low and lower middle income countries (9.89) (1.17) (0.63) (0.14) (12.01) (2.04) (1.15) (0.20)